


If Housing Is So Affordable, Why Doesn't It Feel That Way?
Housing is affordable. How affordable? Near-record affordable.

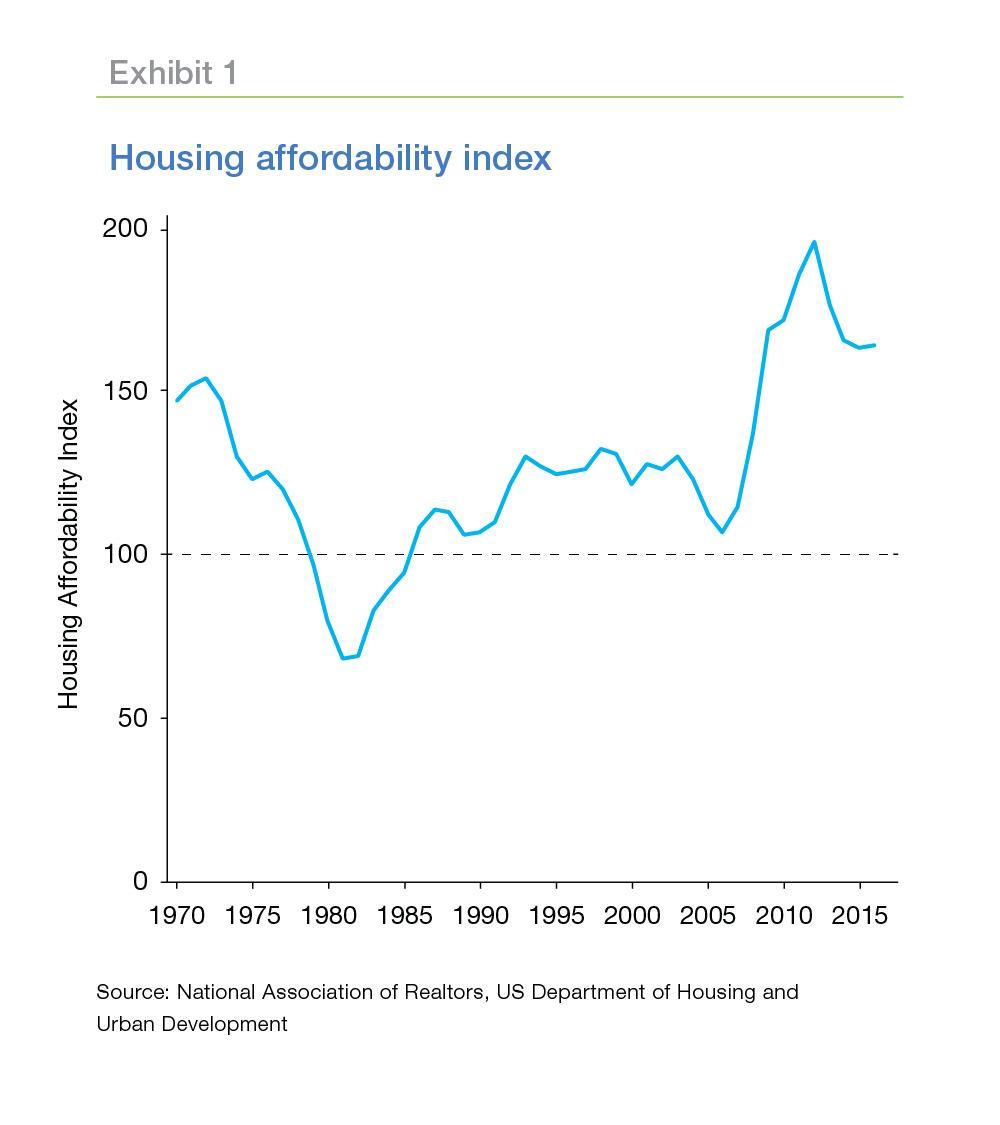
Don’t take my word for it. The Housing Affordability Index (HAI) developed by the National Association of Realtors (NAR) and published on the HUD website backs me up (Exhibit 1). This index, perhaps the most-widely-cited measure of housing affordability—reports the ratio of median family income required to qualify for a conventional mortgage on the median- priced home.1 A value of 100 indicates the median family income is just enough to qualify for the mortgage. Higher values mean the median-income family has more than enough to qualify.
The HAI has been rising steadily for over 35 years with just a brief interruption during the housing crisis of the mid-2000s. The index reached a record high in 2012 when the median family income was about twice as high as the income needed to qualify to buy the median-priced home. Since then the HAI has subsided a bit but is still near the record high.
However, it looks like no one has told the market how affordable housing is. Consider these recent headlines:
Enlarge Image
- A Housing Affordability Crisis That’s Worse for the Lowest Income Americans (PBS, 2017)2
- Rising Home Prices, Rents Spur Housing Affordability Concerns (eCredit Daily, 2017)3
- An affordable-housing shortage in the US is about to get worse (Business Insider, 2017)4
- Harvard Report Raises Housing Supply, Affordability Issues (Mortgage Daily News, 2017)5
So why doesn't it feel like housing is affordable? It turns out there isn't just one reason for the feeling that housing is out of reach—there are multiple reasons. We'll examine some of the leading candidates to see whether housing is unaffordable or if it just feels that way. But first, let's clarify what the HAI is telling us and what it's leaving out.
What the Housing Affordability Index measures—and what it misses
The Housing Affordability Index (HAI) combines information on house prices, family incomes, and mortgage rates—all important drivers of affordability. But no single index can tell the whole story. For instance, potential homebuyers may have sufficient income to qualify for a mortgage on the median-priced house, but they may have significant other debts that push their debt-to-income ratio (DTI) above the qualifying limit. Or their credit score may be too low. Or…and the list goes on.
Of all the ingredients in the HAI formula, the mortgage rate may be the most important. It's no accident that the HAI bottomed out in 1981 when the rate on a 30-year fixed rate mortgage peaked at close to 19 percent. Similarly, the HAI peaked in 2012 when the mortgage rate was approaching its all-time low. Exhibit 2 displays the close correlation between the mortgage rate and the HAI. The unprecedented volatility of house prices in the 2000s has weakened that correlation slightly in recent years, but the relationship is still clear (Exhibit 3).

Now let's consider some of the other factors and perceptions that aren't always reflected in the HAI.
Why housing feels unaffordable
Houses are just too expensive…
Nationally, house prices now stand higher than their previous peak at the end of the housing boom (Exhibit 4). House prices have risen an average of just over six percent per year since the house price trough in 2012, and they show no sign of slowing down. Incomes, however, have not kept up. Per capita income increased only 2.4 percent on average per year.

…especially where I live
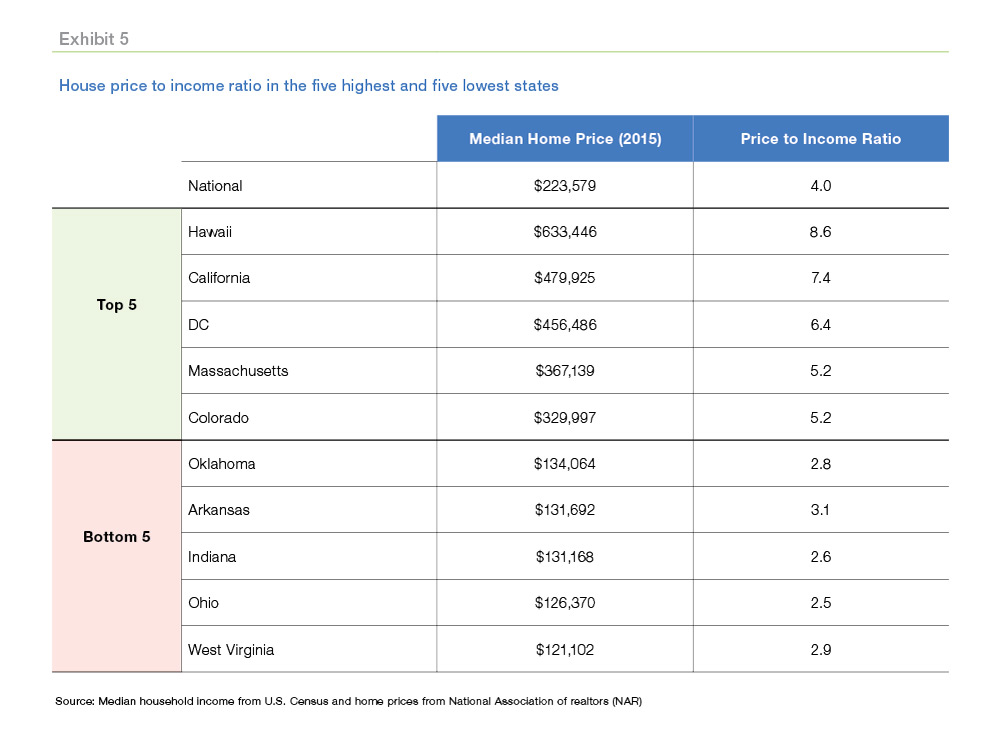
House prices—and incomes—vary widely across the United States. Exhibit 5 displays the median house price and the ratio of the median house price to the median household income in the five highest-priced and five lowest-priced states. In 2015, the median price nationally stood at $223,579, four times the median household income in the U.S. The median price in Hawaii is $633,446, 8.6 times the median household income in Hawaii. In contrast, the median price house price in Ohio is $126,370, 2.5 times the median household income in Ohio.
The contrast between affordable and unaffordable areas is even more pronounced at the local level. Exhibit 6 displays a map of the five counties in the San Francisco metro area. We used the NAR formula to calculate a housing affordability index for each ZIP code in the metro area.6 In Marin, San Francisco, and San Mateo counties, the median-income household cannot qualify for a mortgage to buy the median-priced home in any ZIP code in those three counties. And in Alameda and Contra Costa counties, houses are affordable in just 37 of the 85 ZIP codes.
On the other hand, house prices in the Kansas City metro area are very affordable (Exhibit 7). The median-income family in Kansas City can afford the median-priced house in all but three ZIP codes.

In fact, the average family headed by a service worker, with an income just under 60 percent of the median-income family, would qualify to buy the median-priced home in two-thirds of the ZIP codes in the Kansas City metro.
Even if I could afford to buy, there aren’t any houses available
The supply of houses for sale is very tight. Residential construction ground to a halt during the housing crisis of the mid-2000s and has yet to recover fully. Housing starts bottomed out at 550,000 in 2009, well below the historical average of about 1.5 million starts per year. And less than 1.3 million starts are projected this year.
In fact, it would take several years of above-average starts to accommodate all the household formations that were deferred during the crisis. However, the continuing difficulty home builders confront in attracting skilled labor—currently there are over 150,000 job openings in residential construction—is likely to keep the rate of housing starts below average for some time (Exhibit 8).

The limited supply of available homes increases the perception that homes are unaffordable. New listings are snatched up quickly, often by cash buyers. Bidding wars are commonplace. To make matters worse, the challenge of finding a new home discourages some existing homeowners from listing their current residences. This imbalance between the demand for and supply of homes boosts house prices further and can transform the perception of unaffordability into actual unaffordability.
You may think I can qualify for a mortgage, but I'm not so sure
The HAI measures whether the median family income is sufficient to qualify for a mortgage on the median-priced home. However, there are other requirements the borrower must meet to obtain a mortgage. And, in the aftermath of the Great Recession, lenders tightened many of these requirements, making it difficult for some potential homebuyers to qualify for a mortgage. Hurdles faced by borrowers include—
DOCUMENTATION OF STABLE INCOME
The collapse of house prices in the late-2000s and the subsequent defaults highlighted the importance of a borrowers' ability and willingness to repay their loan. Potential borrowers today must document an income that is both adequate and stable. This requirement can pose a problem for small business owners, self-employed professionals, and workers in the gig economy. These borrowers may have trouble documenting their incomes. In addition, their incomes may vary from year to year making it difficult to determine their stable income, the level of income that can be relied on in assessing ability to pay.
FOCUS ON CREDIT SCORES
Borrowers with low credit scores find it harder to qualify for a mortgage today than they did before the housing crisis. Exhibit 9 (following page) displays the average FICO scores of mortgage borrowers from 2001 to 2016. Scores increased in each credit tier, but they increased the most for lower-FICO borrowers. The score of a high-FICO borrower (the 90th percentile of FICOs) increased 20 points over this 16-year period. In contrast, the score of a lower-FICO borrower (10th percentile) increased 70 points. And fewer lower-FICO borrowers qualified for loans. According to CoreLogic, the number of successful applicants in both the 620-659 FICO range and the below-620 range fell by over seven percent in this period. And the Urban Institute7 estimates that post-crisis changes in lender credit standards reduced the number of mortgage loans originated by 6.3 million between 2009 and 2015.

Not everyone shows up on the FICO radar. Many families have no credit cards. There also are an estimated nine million “unbanked” households—people with no checking or savings accounts.8 Many have no loans.
According to the Consumer Financial Protection Bureau (CFPB), around 26 million people are “credit invisible”, that is, they do not have a credit history with any of the credit reporting agencies. An additional 19 million are unable to be scored—they do not have a sufficient or recent enough credit history to be given a credit score. These so-called credit invisibles—along with many others who have very thin credit files—find it difficult to obtain a mortgage, because lenders have trouble assessing their credit worthiness.
Some credit-scoring companies have started using alternative data to assess the creditworthiness of the credit invisibles. Alternative data can include rental records, cellphone and cable payments, checking account histories and public property records that indicate how often people change homes. FHFA, Fannie Mae, and Freddie Mac continue to engage with a broad range of stakeholders about the relevant factors that would be involved in migrating to a newer credit score model(s), including the costs, operational implications, and potential impacts on access to credit. Our goal is to help determine the best path forward for the industry, taxpayers, and consumers.
DEBT
Underwriting standards place limits on the ratio of a borrower’s debt to his or her income. A high debt-to-income (DTI) ratio increases the probability a borrower may be unable to meet all their obligations at some point in the future. A high DTI ratio is the most common reason for rejecting a mortgage application.9
There are separate limits for the ratio of the mortgage balance to the borrower’s income (the
so-called front ratio) and the ratio of the borrower’s total debt—mortgage, auto, student loan, credit cards, etc.—to income (the back ratio). High house prices can increase the front ratio above allowed limits, even though low mortgage rates may keep monthly payments low. High levels of student debt boost the back ratio and appear to be inhibiting some Millennials from buying their first home.10 (See Student loans and homeownership for more on this topic.)
DOWN PAYMENTS
Many people mistakenly believe they must have a 20 percent down payment to obtain a mortgage. While it is true that current guidelines for down payments are more conservative than what sometimes passed muster at the height of the housing boom, more than half of borrowers today make down payments that are smaller than 20 percent.11
For all these reasons, it is undeniable that it can be more difficult to get a mortgage today than it was, say, fifteen years ago. The individuals most affected are those with a low credit score and a high DTI and LTV ratio. Research by Li and Goodman (2014)12 indicates the denial rate for such applicants jumped from 29 percent in the period just before the crisis to 41 percent in the 2010 to 2013 period. And without a mortgage, houses are unaffordable for many people.
I can buy the house, but can I afford to maintain it?
Many first-time homebuyers are surprised by the on-going costs of ownership. Property taxes and homeowner’s insurance represent significant costs (Exhibit 10). Property taxes range from a low of 0.3 percent in Hawaii to a high of 2.1 percent in New Jersey. Maintenance costs average around one percent of the house price per year. Borrowers sometime regard these as part of the cost of the mortgage, since, for many borrowers, payments for taxes and insurance are collected as part of the monthly mortgage payment. However, the cost of taxes and insurance can increase over time even if the borrower has a fixed-rate mortgage.

First-time homebuyers—who previously relied on landlords to pay for utilities, make repairs, maintain landscaping, and handle all the other aspects of upkeep—may be unprepared for the responsibilities of homeownership. Water heaters cost more than expected, furnaces flame out just as the holiday bills arrive, and who can you call to check out those strange noises in the wall? In addition, many first-time buyers purchase “fixer-uppers” to find a home in their price range, and these homes typically have higher maintenance costs.
So, is housing affordable or not?
Yes
Thanks to very low mortgage rates, monthly mortgage payments are affordable for the average household despite currently-high house prices. The NAR’s Housing Affordability Index (HAI) correctly captures this aspect of affordability. And borrowers who choose a 30-year fixed-rate mortgage can continue to enjoy low monthly payments even if mortgage rates rise in the future. Moreover, many potential first-time buyers can reasonably expect their incomes to increase as their careers progress, thus reducing the costs of homeownership as a share of their incomes.
In addition, homeownership has proven to be an effective way for ordinary Americans to build wealth. It's been estimated that homeownership increases net wealth by $9,000-to-$10,000 per year.13 And homeownership contributes to strong and stable communities. In recognition of these benefits, public policy provides support for homeownership. For example, the deductibility of mortgage interest and rules exempting a large portion of capital gains on sale increase the economic benefits of homeownership.
...but...
Hurdles to homeownership arise from the difficulty of finding a house to buy and of meeting all the requirements to obtain a mortgage. The supply of homes for sale is very tight, especially starter homes. And underwriting requirements are more rigorous than they were in the past. Many potential first-time borrowers are stymied by variable employment and income histories and the challenge of accumulating a down payment while simultaneously paying down their student loans. In fact, a high level of household debt, particularly student debt, poses perhaps the largest obstacle to first-time homebuyers.
...and here's how we help...
Freddie Mac is committed to making housing affordable. In fact, it's part of our mission as spelled out in our charter. Here are some of the ways we help.
BORROWER RESOURCES
Buying a home can be confusing. And financing a home purchase is even more complicated. Freddie Mac provides information to potential homebuyers to help them through the home buying process. For instance,
- My Home by Freddie Mac provides information on many aspects of housing and housing finance. Tutorials, videos, quizzes, worksheets, infographics, calculators and much more for potential homebuyers, current homeowners and renters.
- CreditSmart online financial training helps consumers build and maintain better credit, make sound financial decisions, and understand the steps to sustainable homeownership. CreditSmart is available in English and Spanish and has reached over four million consumers nationwide and trained more than 43,000 instructors.
Sometimes borrowers need face-to-face assistance. We've got that covered too.
- Borrower Help Centers—Freddie Mac works with trusted national nonprofit intermediaries to prepare prospective buyers for responsible homeownership and to help struggling borrowers with Freddie Mac-owned mortgages avoid foreclosure. Currently there are 14 Borrower Help Centers in nine states and the District of Columbia. Prospective buyers who don’t live near a Borrower Help Center can get assistance by telephone.
BEHIND-THE-SCENES ASSISTANCE
Freddie Mac works with lenders and other real estate professionals to make homeownership possible. Borrowers may not realize Freddie's roles in this area, but these initiatives provide tangible help for prospective homeowners.
- Down payment assistance—Freddie Mac's Home Possible Advantage® allows lenders to offer low down payment mortgages for qualified first-time homebuyers. Down payments as low as three percent of the house price are allowed, and the down payment can be a gift from a family member or a grant from a government body or housing finance agency.
1 The house price in the HAI is the median price of a single-family home in recent transactions. The HAI assumes the borrower makes a 20 percent down payment and the monthly principal and interest payments on the mortgage are no more than 25 percent of the median gross family income.
2 http://www.pbs.org/wgbh/frontline/film/poverty-politics-and-profit/
3 http://www.businessinsider.com/affordable-housing-crisis-shortage-worse-2017-5
4 http://www.mortgagenewsdaily.com/06162017_housing_studies.asp
5 For details on the calculation, see Where do the service workers in San Francisco live?
6 http://www.urban.org/urban-wire/overly-tight-credit-killed-11-million-mortgages-2015
7 2015 FDIC National Survey of Unbanked and Underbanked Households accessed at https://www.fdic.gov/householdsurvey/.
9 Parents who co-signed student loans for their Millennials may also find themselves with high DTI ratios.
10 CoreLogic, conforming purchase mortgages.
11 Li, Wei and Laurie Goodman. (2014) “A Better Measure of Mortgage Application Denial Rates.” Urban Institute. http://www.urban.org/sites/default/files/publication/33501/2000031-A-Better-Measure-of-Mortgage-Application- Denial-Rates.pdf
12 Herbert, Christopher E. (2013), “Is Homeownership Still an Effective Means of Building Wealth for Low-income and Minority Households? (Was it Ever?)” Harvard University, Joint Center for Housing Studies.
PREPARED BY THE ECONOMIC & HOUSING RESEARCH GROUP
Sean Becketti, Chief Economist
Ajita Atreya, Quantitative Analyst Sr.
Penka Trentcheva, Quantitative Analyst Sr.
Venkataramana Yanamandra, Quantitative Analyst Sr.