


Why is Adulting Getting Harder? Young Adults and Household Formation
"Adulting is hard"
Young adults of this era lead lives quite different from earlier generations. Compared to older generations, as a group they have been slow to reach life milestones traditionally associated with adulthood, such as getting married, having children, living independently and forming their own households.
A popular meme, “adulting is hard”, provides a humorous take on the challenges faced by young adults (or perhaps anyone struggling with adult responsibilities). Like a lot of good comedy, the phrase has a tinge of cruelty. For today’s young adults, adulting is hard, because the economic environment has been tough in recent years; wage growth has been weak and housing costs have risen rapidly. On top of that, education and health care costs have skyrocketed. Compared to 2000, average annual expenditures for young adults in 2016 increased 36 percent, while average annual expenditures on health care and education have more than doubled.
The challenges faced by today’s young adults could be slowing household formation and represent a major obstacle to U.S. housing markets reaching their full potential. We explore factors that may be contributing to the low rates of household formation for young adults and what that could mean for the future.
Young adults–growing population, falling headship rates
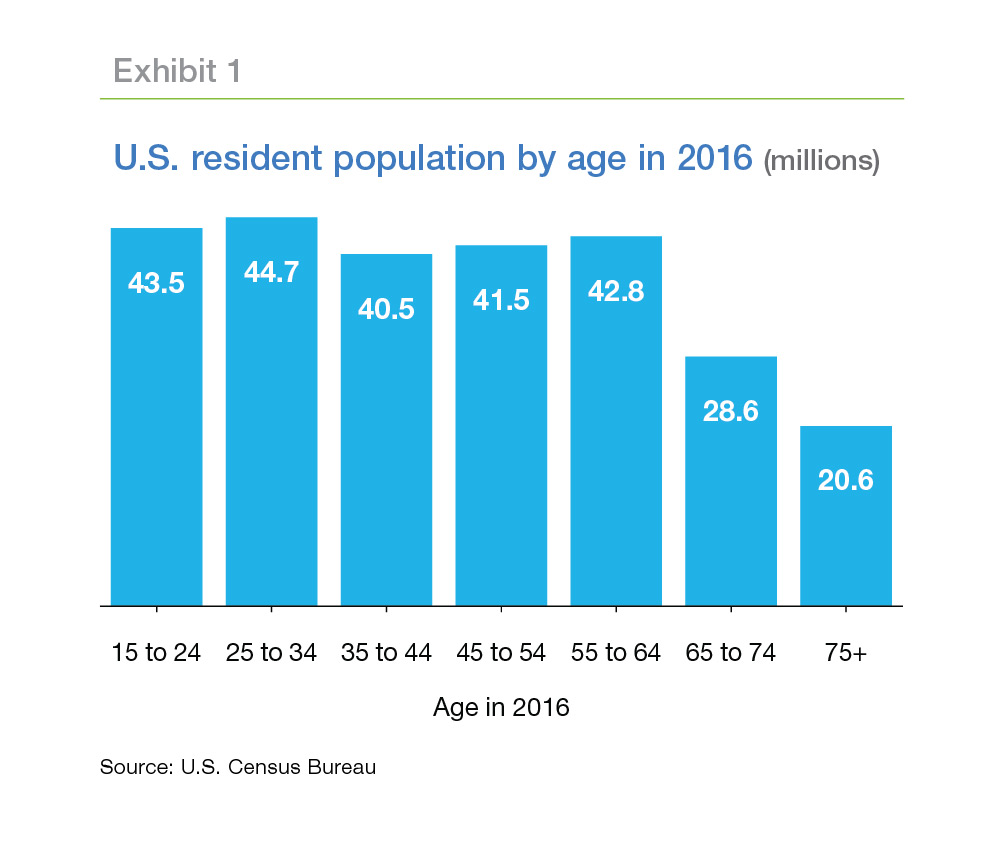
The U.S. population distribution currently skews young. According to the U.S. Census Bureau, there were nearly 45 million young adults aged 25 to 34 in the United States in 2016, over four million more than those aged 35 to 44 (Exhibit 1).1 These young adults should be fueling the housing market, driving demand higher for years to come.
But so far, despite the swell in the young adult population, household formation hasn’t surged. Rather, the U.S. has seen modest rates of household formation. Although we’ve seen gradual increases in first-time homebuyers and the formation of young adult households, these increases have been very slow when compared to young adults of 2000. For example, the rate of heading a household (headship rate) for young adults in 2016 was down 3.6 percentage points as compared to young adults in 2000. If these young adults had formed households at the rate of the young adults in 2000, then the U.S. would have had 1.6 million additional households in 2016.
A decline in household formation has a major impact on the U.S. economy and housing markets, with implications for homeownership, residential investment and wealth building. Due to the long- lasting nature of these impacts, it’s important to understand the nuances of the shift in young adult household formation. Even relatively small percentage changes affect millions.
Looking ahead, many housing market watchers assume that those missing young adult households will emerge, literally, from their parents’ basements. With many young adults returning home to live with parents or doubling up with roommates, there seems to be tremendous pent-up demand for housing from the young adult population. Will these young adults accelerate household formation, making up for lost time? Will the next generation reverse the trend of declining household formation rates for young adults?
Let’s look at the young adults of 2016, and compare them to the young adults in 2000. Then, we can consider how various factors influence the rate of household formation by young adults.
Finally, using the insights we glean from our analysis, we can consider scenarios for the future and how young adults may show up in the housing market.
How are today's young adults different?
Young adults of this era are different from earlier generations on several fronts. They are more racially diverse and are slower to reach milestones traditionally associated with adulthood, such as getting married, having children, living independently and forming their own households.
Many young adults choose to live with their parents rather than to move out and live independently. The share of young adults living with their parents has grown substantially in recent years. As of 2016, 15 percent of young adults were living in their parents’ homes, which is five percentage points higher than the young adults who lived in their parents’ homes in 2000. In addition, when young adults strike out on their own to live independently from parents, they often double up with a roommate. According to the Pew Research Center, nearly one in three adults in the U.S. shared a household.2 Such living arrangements have caused the household formation rate for young adults to trend down in recent years. In 2000, there were 18.6 million households headed by young adults, and by 2016, this number increased to about 20 million. However, if we consider the population growth of young adults, the share of young adults that headed households decreased by 3.6 percent, from 49.2 percent in 2000 to 45.6 percent in 2016.
Population growth together with the evolution of headship rates drive household formation. The slow rate of household formation during the Great Recession was primarily due to a decline in headship rates among young adults. If the headship rate had remained at 2000 levels, we would have had 1.6 million additional young adult households in 2016. So, why is the headship rate lower among young adults today?
Researchers have found different reasons to explain the decline in young adult household formation. Many attribute the low headship rate to the Great Recession, including labor market conditions, house prices, incomes and debt.3 A recent paper also indicates that it has become more socially acceptable for young adults to live at home.4 It is crucial to understand why the headship rate is lower among young adults as declining household formations has serious implications for U.S. housing demand.
Intuitively, household formation depends on one’s stage in life, such as age, marital status, and whether one has children. It also depends on the cost of living independently, such as choice of geography, housing costs, and an individual’s ability to pay these costs—which is affected by education, income, employment and debt. When comparing young adults of 2000 to young adults of 2016 (Exhibit 2), we observe five noticeable differences across these variables:5
- Marriage and fertility rates have declined.
- More live in central cities where the cost of living is high.
- They are more educated.
- They are earning more.
- The labor force participation has declined.

Young adults today are delaying marriage, and fewer are having children. Per the Urban Institute, the economic shock of the Great Recession put marriage on hold for many young adults. However, marriage rates are slowly returning to pre-recession levels. Declining marriage rates coincide with the increased share of young adults living with their parents and is regarded as one reason for the decline in household formation (FRBSF, 2016).
Those young adults who have moved out of their parents’ homes generally have moved to central cities where the cost of living is high. Because home prices are high, more young adults are renting, and many are choosing to live with roommates instead of forming their own individual households. Per Freddie Mac’s Multifamily Renter Research, 7 in 10 renters are at least somewhat willing to sacrifice space to live in an urban area.
Compared to 2000, more young adults have earned a bachelor’s degree. Higher education also frequently means higher student debt, which is often cited as the biggest factor dragging down household formation rates among young adults.
In terms of labor market conditions, the labor force participation rate for young adults has seen a substantial decline, particularly for men. This could be partially due to an increase in the share of young adults earning income from digital platforms such as Uber, Airbnb and TaskRabbit—jobs that typically supplement income rather than replace full-time work and were not included in the Labor Department’s counts until 2017. Per capita income is up modestly in inflation-adjusted terms for all young adults since 2000. But for those young adults who are working, per capita real income is up about $2,000 since 2000.
In addition to these factors, young adults are more racially and ethnically diverse. Household formation rates tend to vary by race and ethnicity so a shift in the composition of the population could drive household formation rates.
How do these factors influence the trend in household formation rates we saw for young adults?
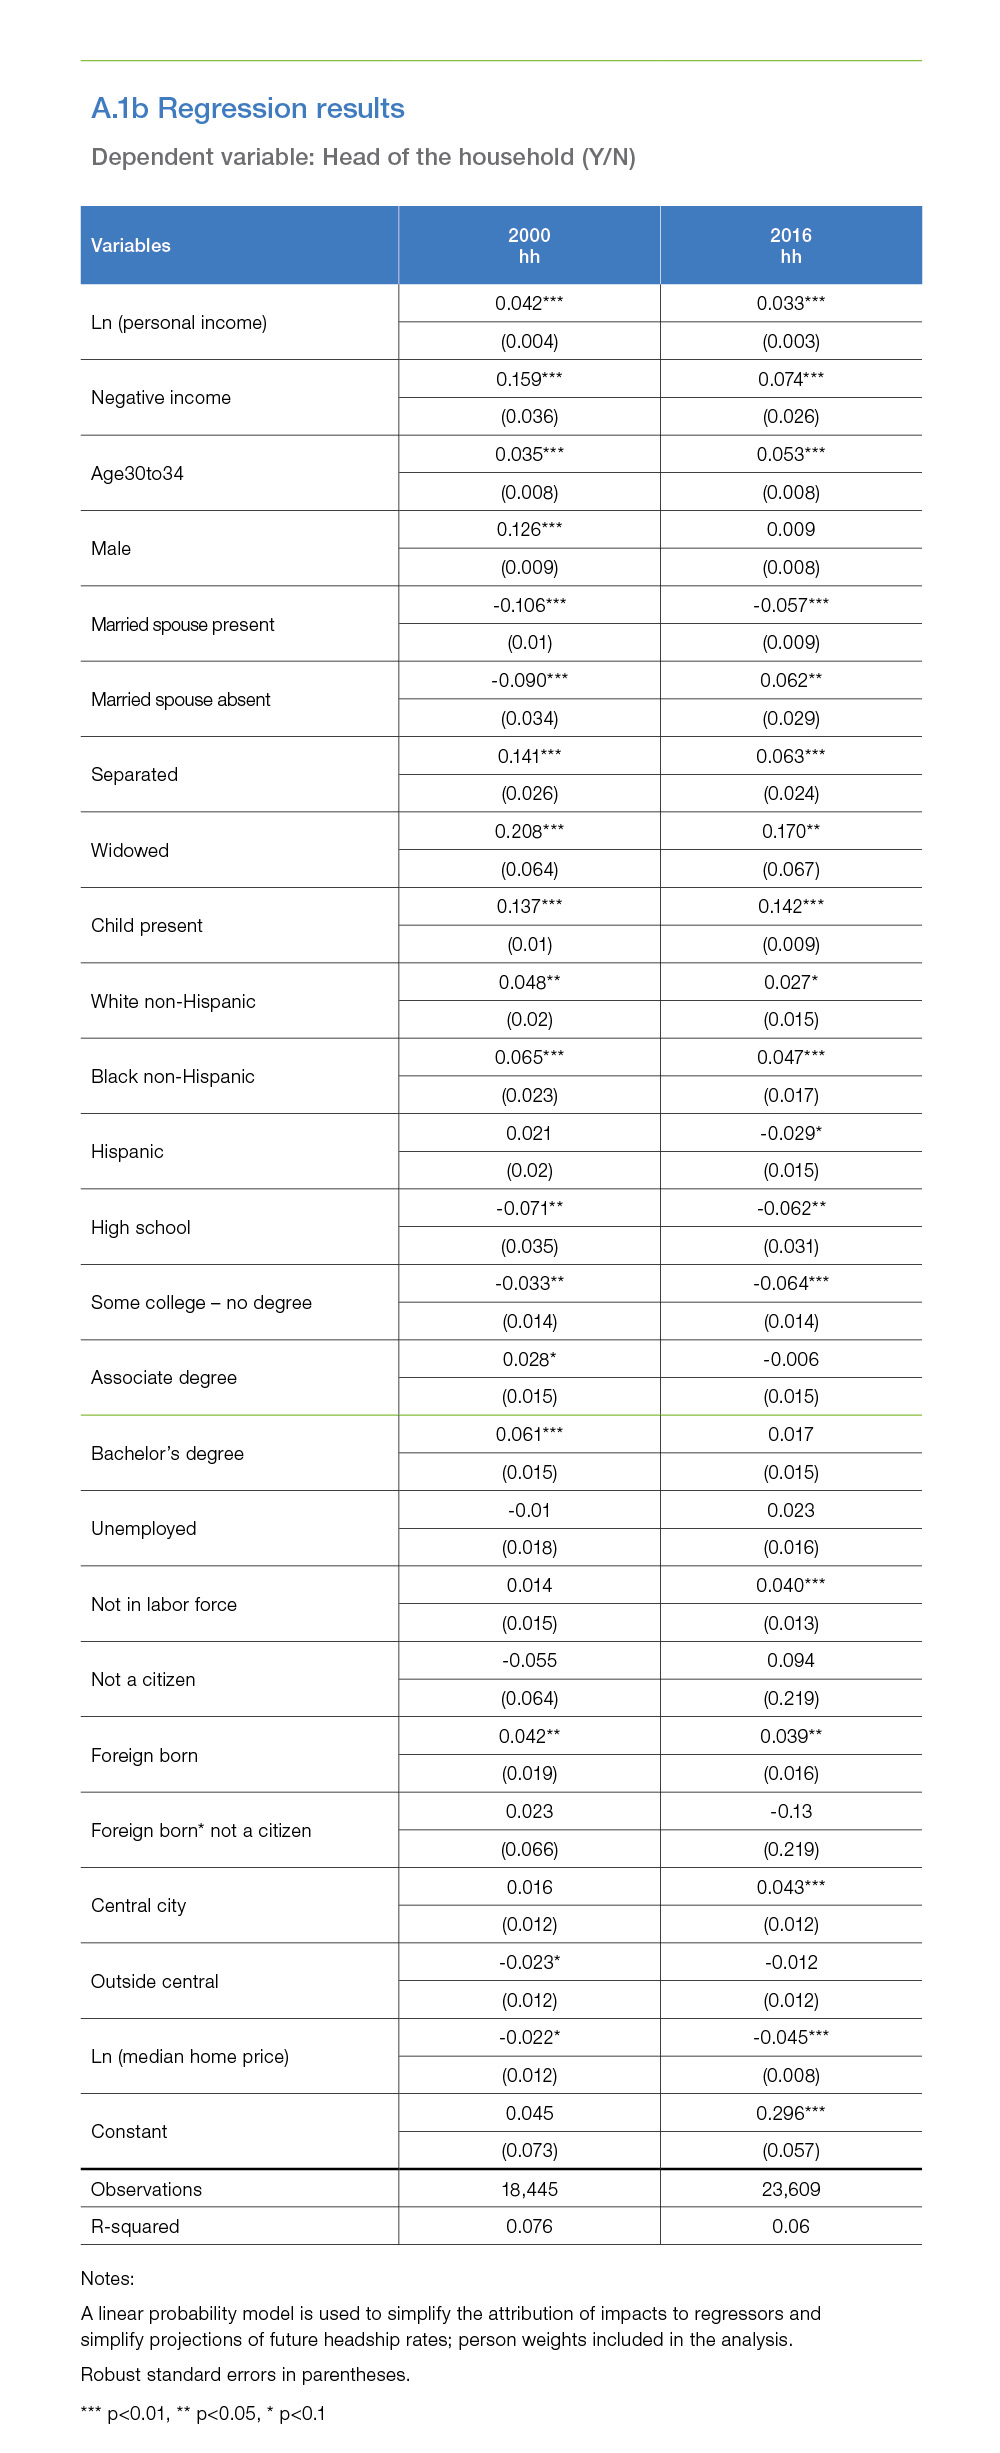
To answer this question, we built a statistical model using person-level records from the U.S. Bureau of Labor Statistics’ Current Population Survey, made available through the Integrated Public Use Microdata Series (IPUMS). Our statistical model predicted the likelihood of a person heading their own household controlling for a variety of factors. Full details of our methodology and estimation results can be found in Appendix A.1.
Discussion of model results
In general, as people get older, they are more likely to get married, have children and form their own households. This has held true for young adults in 2016. We find that the older age cohorts of young adults (age 30 to 34), married young adults and those who have children are more likely to form a household.
As expected, increases in housing costs (captured by median home prices in our model) decrease the likelihood of young adults forming households. A one-percent increase in house prices decreases the likelihood of household formation by almost five percent. Higher incomes and higher education levels perhaps provide young adults confidence to form their own households. We find that, all else equal, a one-percent increase in personal income increases the likelihood of household formation by a little over three percent. Similarly, all else equal, young adults with a bachelor’s degree are more likely to form a household.
Exhibit 3 ranks the contribution of these factors to the headship rate gap among young adults in 2000 versus 2016. Per our analysis, more than half of the gap in headship rate (between 2000 and 2016) is due to housing costs and labor market outcomes.

Housing costs alone, captured by median home prices, account for more than one quarter (28 percent) of the gap in household formation. From 2000 to 2016, real median house prices increased by 29 percent, but young adult per capita real income only rose one percent over that same period. The increase in real house prices relative to income increased the ratio of median home prices to young adult per capita income from 5.6 in 2000 to 7.0 by 2016.
Another 23 percent of the gap is due to differences in labor market outcomes, which include income and employment. Although personal incomes have increased, they have not increased enough to correct the gap. Particularly important is labor market participation. Persons who are not active in the labor market and have zero or negative income have a substantially lower likelihood of forming a household than those active in the labor market and earning even modest income.
Apart from the cost of living and labor market outcomes, differences in marriage and fertility rates account for 18 percent of the headship rate gap. A combination of factors related to demographics such as race, ethnicity, age, and gender account for 12 percent of the headship rate gap. Education and geography are two factors that favored young adults in 2016 relative to 2000. Thirteen percent of the gap in the headship rate is corrected by educational differences. Young adults who have moved to central cities have added marginally to new households in 2016. Overall, the variables we can control for explain about two-thirds of the decline in headship rates.
How many households did we lose to these differences in various factors?
As mentioned above, if the 2000 headship rates had persisted, we would have had an additional 1.6 million young-adult households in 2016. Exhibit 4 shows the various factors that have contributed to the number of households lost from 2000 to 2016.

Approximately 63 percent of the gap (or 986,000 households) can be explained by the factors discussed above: housing costs, labor market outcomes, marriage and children, race and age, education, and geography. The remaining gap of around 37 percent (or 590,000 households) is unexplained by our factors. The unexplained portion may be comprised of other factors, such as debt (especially student debt), credit, underwriting, increased medical care and education expenditures and shifts in tastes. Our analysis did not capture these other factors, which are also important for household formation.
Household Formation Projections: 2025
What does all this mean for future household formation? How will these factors influence future housing demand?

We think about it two ways: First, we look at how young adult household formation will evolve by 2025. Will the young adults catch up to the headship rate of the young adults in 2000, or will they continue to lag? We also look at how young adults in 2025 will show up in the housing market. Due to sheer numbers, we’re going to see more households. The question is how many more?
To give a historical perspective, consider the number of young adult households in the 1970s and 1980s as reflected in Exhibit 5. In 1970, young adults aged 25-34, headed 11.7 million households. By 1980, these young adults, now aged 35-44 headed 14 million households, adding 2.3 million households between 1970 to 1980. In 1990, the 25-34 year olds headed 20.5 million households and by 2000, these young adults now aged 35-44 years, headed 24 million households or an additional 3.5 million households since 1990.
How might today’s young adults contribute to household formation by 2025? Our research indicates that the two biggest factors explaining the decline in household formation rates for young adults are housing costs and labor market outcomes. Let’s understand how the evolution of these variables impact future household formation.
We put together three scenarios to see how household formations might evolve for today and tomorrow’s young adults:
- Baseline: We assume current trends in terms of economic, sociological, labor market and housing market factors persist over the next 10 years.
- Optimistic: We assume economic conditions improve by 2025. In this scenario, we keep the housing costs fixed and vary labor market outcomes. Specifically, we match the 1990s experience and have real personal income go up by 15 percent for each age and race/ethnicity group. We also push the labor force participation and unemployment rates to 2000 levels.
- Pessimistic: We assume housing market conditions deteriorate. We keep the labor market and income fixed but vary housing costs. Specifically, we assume that housing supply persisted in falling short of demand, and real house prices rose an additional 20 percent over the next 10 years.
Our baseline scenario reflects an economy that remains largely unchanged. This provides a view on how evolving demographics may drive household formation rates in the absence of any significant shift in the economic environment. But the economy could turn favorably or unfavorably. We consider two plausible alternatives in our optimistic and pessimistic scenarios.
The U.S. labor market has been improving over the past few years. Though the unemployment rate has fallen below estimates of the natural rate of unemployment, we have not seen an acceleration in wage growth. This may be partially because labor force participation rates have begun to recover. As the economy improves, many people who left the labor force have returned, keeping the unemployment rate stable and impeding wage growth. Perhaps the decline in labor force participation for young adults was largely a hangover of the Great Recession.6 What if labor force participation rates for young adults picked back up and income growth also accelerated? We consider that possibility in our optimistic scenario.
As we discussed in our November 2017 Insight, housing markets are out of balance, and housing supply is not meeting demand. Per Freddie Mac Multifamily’s 2018 Outlook, multifamily permits and starts have been tapering over the last two years, down 11.4 percent and 9.8 percent, respectively, since 2015. Construction of 1-unit buildings has increased to offset the decline in multifamily activity, but the overall level of construction remains well below our estimate of long-run housing demand. If that persists, we could see house prices continue to increase faster than incomes. What if housing costs kept rising? We consider that possibility in our pessimistic scenario.
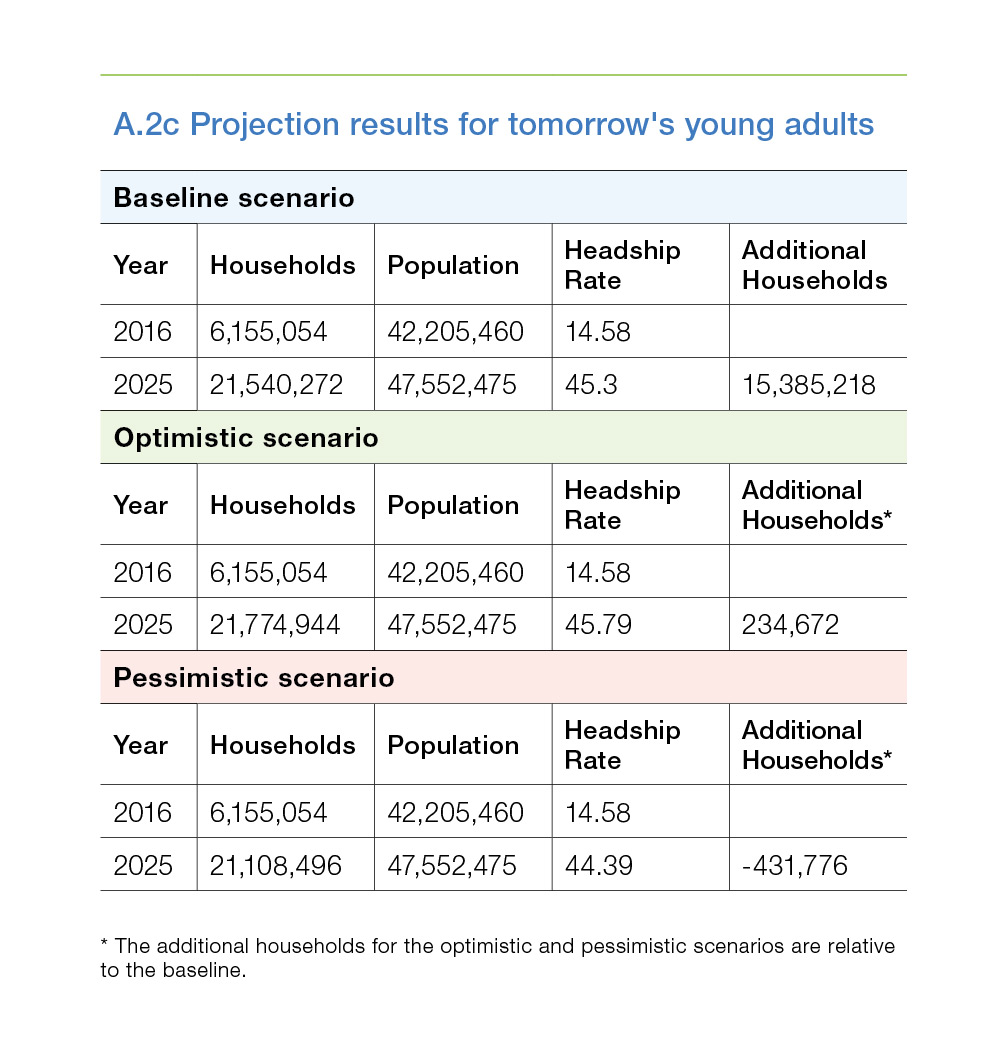
For all three scenarios, we use the 2014 U.S. Census population projections by age and race/ ethnicity to adjust population demographics. Details of our projection methodology and scenarios can be found in Appendix A.2. Note that our data and methodology are similar in spirit, if different in details, to the widely cited household formation projections regularly produced by the Joint Center for Housing Studies.7 Our results are complementary to their estimates in that our analysis provides insight into how variations in key factors, housing costs and the labor market outcomes might impact future household formations.

For today’s young adults, we fix education and immigration status variables at their 2016 levels and carry them through 2025 for all the scenarios. For all the other variables, we assume that in 2025 these young adults will look like the 35-44-year old’s of 2016 and use the 2016 35-44 year-old means for the projections. For young adults in 2025, we keep all variables at their 2016 levels. We only change the labor market and income variables in the optimistic scenario and only change house prices in the pessimistic scenario. Exhibit 6 summarizes the key differences between the scenarios, while full details can be found in Appendix A.2.
Using the variable values and their influence on household formation on the projected population, we estimate the number of households that would be formed. These scenarios show that young adults could add somewhere between 19 and 21 million additional net new households by 2025. Young adults ages 25 to 34 in 2016 could add between 4.2 and 4.5 million net new households while future young adults (ages 15-24 in 2016) could add between 15 and 16 million households by 2025, as shown in Exhibit 7.

Conclusion
Based on our analysis, housing costs and labor market outcomes explain over half of the gap between the household formation rates of young adults in 2016 versus young adults in 2000.
Household formation is an important predictor of growth in the housing market. For example, when the economy was strong, young adults went on to form their own households, thereby increasing the demand for housing. However, during the recession many young adults moved back in with parents or doubled up with roommates shrinking the number of households and shrinking demand as well. To prepare for future housing demand, it is important that we track trends in household formation and project future housing demand.
We expect that as life progresses and today’s young adults age, they will add around 20 million households to the U.S. economy driving housing demand over the next decade. But, housing costs are a major factor holding back young adult household formations. Our research results indicate that 28 percent of the decline in young adult household formation is due to housing costs. If housing costs continue to rise, household formation will be suppressed, and we could see about 600,000 fewer households over the next decade.
Alternatively, we could see housing costs stabilize and the labor market improve, driving young adults’ household formations up 300,000 relative to the baseline.
There is substantial pent-up demand for household formation from today’s young adults. That demand will tax a housing market that is struggling to produce enough supply to meet demand under current conditions. Rising housing costs along with the substantial pent-up demand will add pressure to housing markets and increase the urgency for solutions that provide affordable housing.
For young adults, renting is often the first choice when forming a household. In a survey conducted by Freddie Mac Multifamily Renter Research, 55 percent of Millennials (currently aged 21-37) think that renting is a good choice for them. To make renting more affordable, Freddie Mac Multifamily offers numerous products that provide financing for rental units affordable for low-income and working families. For example:
- Its Targeted Affordable Housing Platform provides financing for the preservation and rehabilitation of multifamily properties with regulatory rent or income restrictions. These include properties with Section 8 vouchers, tax-exempt loans, those receiving Low-Income Housing Tax Credits, and many others.
- Freddie Mac offers several products to preserve "Naturally Occurring Affordable Housing," which do not have rent restrictions and face significant risk of being lost to deterioration, abandonment and gentrification. This includes a new Social Impact Financing vehicle.
- Small Balance Loans, which primarily finance smaller properties ranging from $1 million to $7.5 million in high-cost markets. These units are more likely to provide housing for working families such as nurses, police officers and firefighters. In fact, last year Freddie Mac financed more than 100,000 units of affordable and workforce housing through the SBL program.
- Its Green Advantage® suite of products, which finance energy- and water-saving improvements that help lower operating costs for buildings, keep utility costs low and protect the environment.
Through these and other programs, Freddie Mac Multifamily funded more than 680,000 rental units affordable to low- and moderate-income families earning no more than 100 percent of the area median income.
Many young adults will eventually look to become homeowners. As part of its ongoing support of affordable housing, Freddie Mac offers mortgage products and resources that help potential borrowers achieve the dream of homeownership. For example:
- Payment Assistance provides flexible sources of down payment funds within Home Possible Mortgages; it also helps consumers and their lenders identify additional, eligible down payment programs.
- CreditSmart is a free, web-based tutorial that talks about the steps to homeownership, from the importance of good credit to qualifying for a loan and selecting a lender.
- MyHome is a consumer-focused resource center featuring tools, resources and information on renting, purchasing and owning a home.
Drawing on our unique position in the marketplace, Freddie Mac is also working to better understand the behavior of the borrowers of the future.
References:
Abraham, Katharine G. and Melissa S. Kearney. 2018. “Explaining the Decline in the U.S. Employment-to-Population Ratio: A Review of the Evidence.” NBER Working Paper No. 24333.
Bleemer, Zachary, Meta Brown, Donghoon Lee, and Wilbert van der Klaauw. 2015. “Debt, Jobs, or Housing: What’s Keeping Millennials at Home.” Staff Report No. 700. New York, NY: Federal Reserve Bank of New York.
Cooper, Daniel and Luengo‐Prado, María José. 2017. “Household Formation Over Time: Evidence from Two Cohorts of Young Adults." Federal Reserve Bank of Boston Research Paper Series Current Policy Perspectives Paper No. 15-4.
Dettling, Lisa. 2016. "Effects of Entering Adulthood During a Recession." IZA World of Labor 2016:242
Fisher, Lynn M. and Jamie Woodwell. 2015. “Demographics and the Numbers Behind the Coming Multi-Million Increase in Households.” An MBA Research Report.
Fred Furlong. 2016. "Household Formation Among Young Adults." Federal Reserve Bank of San Francisco, FRBSF Economic Letter
Goodman, Laurie, Rolf Pendall and Jun Zhu. 2015. “Headship and Homeownership: What Does the Future Hold?” Urban Institute
McCue Daniel and Christopher Herbert. 2016. “Updated Household Projections, 2015-2035: Methodology and results.” Joint Center for Housing Studies Working Paper.
Paciorek, Andrew. 2016. “The Long and Short of Household Formation.” Real Estate Economics 44(1): 7–40.
Sarah Flood, Miriam King, Steven Ruggles, and J. Robert Warren. 2017. Integrated Public Use Microdata Series, Current Population Survey: Version 5.0. [dataset]. Minneapolis: University of Minnesota. https://doi.org/10.18128/D030.V5.0.
Appendix
A.1. Data
Our data comes from the U.S. Bureau of Labor Statistics’ Current Population Survey, made available through the Integrated Public Use Microdata Sample (IPUMS). For projections, we use 2014 population projections from the U.S. Census Bureau. The CPS microdata is composed of individual records containing information collected on persons and households and weights are provided as some records represent more cases than others. We use individual records from year 2000 and 2016. We restrict our sample to non-group quarter households and consider ages 25-34 in our analysis. After dropping observations with missing information, we retain more than 18,000 sample records each year for our analysis.

A.2 Methodology for projecting household formation
We first run a regression of the factors (the same set of economic, demographic, educational and housing market factors which drive the housing market as shown in the text above) on the headship rate to determine the impact each would have on the headship. We do this by race and age.
For race, we group the population into four racial/ethnic groups: Non-Hispanic Whites, Hispanics, Non-Hispanic blacks and Non-Hispanic others. We run the regression for two 10-year cohorts to see how these factors drive the headship rate:
- Ages 25-34 (today’s young adults in 2016)
- Ages 35-44 (today’s young adults in 2025)
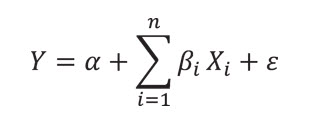
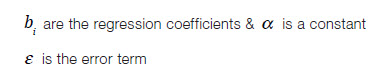
Where:
Y is the dependent variable—head of the household (Y/N)
Xi are the factors—personal income, negative/zero income, male, married spouse present, married spouse absent, separated, widowed, households with children, white non-Hispanics, black non- Hispanics, Hispanics, high school, some college no degree, associate degree, bachelor’s degree, unemployed, not in labor force, not a citizen, foreign born, foreign born and not a citizen, living in central city, living outside central city and median house prices.
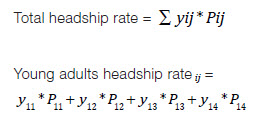
Next, we estimate the means of each of these factors for 2016 by race and age. We then obtain the sum-product of the coefficients obtained through regression and the means of these factors. And finally, we multiply these sum-products with the population estimates to get the number of households under the various scenarios.
For the scenarios, we fix some of the factors (such as education levels and immigration status) at their 2016 levels and carry the through the years until 2025. And for some factors, such as sociological factors like marriage rate and having children, we let them evolve with time—i.e., we assume that in 2025, today's young adults will look like the 35-44 year olds of today. In other words, we impose that future cohorts match past cohorts at a particular age. So, for example, in 2025 35 to 44 year-old Hispanic marriage rates match the 2016 marriage rates for 35 to 44 year-olds.
X = factors from Oaxaca Blinder; Demographic (Age of marriage, number of children, gender), Education, House prices and Metro status (in central city, outside central city)


1 For purposes of this report, the term "young adult" refers to individuals and households between the ages of 5 and 34. The most recent comprehensive data available is for 2016.
2 Living in a shared household refers to living in a household with an extra adult who is not the household head, the spouse or cohabiting partner of the head, or an 18- to 24-year old student.
3 See reference for Cooper and Prado (2017), Blemmer et al. (2015), Dettling and Hsu (2014) and Pacioreck (2016).
4 See reference for Cooper and Prado (2017).
5 We use data from the U.S. Bureau of Labor Statistics' Current Population Survey (CPS), made available through the Integrated Public Use Microdata Series (IPUMS) unless noted otherwise.
6 For more on the decline in the employment to participation ratio, see Abraham and Kearney, 2018. The authors look at factors leading to the decline in the employment rate for young adults between 1999 and 2016. On the demand side, increased trade, particularly with China, has led to declines in wages and employment. The impact is felt mostly on manufacturing jobs. Increased use of labor saving technology is another factor cited for the reduced labor demand. On the supply side, the authors identify increased costs of entering the labor force as a factor leading to reduced employment rates. These costs include increased availability of safety net assistance; earned income tax credit; lack of support for working parents, especially a rise in spousal employment; increased value of leisure time as well as opioid drug use. Along with these factors, changes in societal norms have made it more acceptable for young adults, particularly men, to be financially supported by parents or partners.
7 Also see Goodman et. al. (2015) and Fisher and Woodwell (2015).
PREPARED BY THE ECONOMIC & HOUSING RESEARCH GROUP
Len Kiefer, Deputy Chief Economist
Ajita Atreya, Quantitative Analytics Senior
Venkataramana Yanamandra, Quantitative Analytics Senior