


Quarterly Refinance Report
U.S. households own real estate worth over $25 trillion and have mortgage debt of just $10 trillion for over $15 trillion in net homeowner equity.1 One way homeowners can tap their equity without selling their property is to take a cash-out refinance. Based on Freddie Mac’s Quarterly Refinance Statistics, “cash-out” borrowers, those that increased their loan balance by at least 5%, represented 83% of all conventional refinance loans; the highest share since the third quarter of 2007, but still lower than the 89% share reached during the third quarter of 2006. While the share of cash-out refinances is near its historical high, the total cash-out volume remains much lower than in the previous decade. Adjusted for inflation in 2018 dollars, in the fourth quarter, an estimated $14.8 billion in net home equity was cashed out during the refinance of conventional prime-credit home mortgages, down from the $20.4 billion a year earlier and substantially less than the peak cash-out refinance volume of $104.8 billion during the second quarter of 2006.
An estimated $14.8 billion in net home equity was cashed out during the refinance of conventional prime- credit home mortgages, down from the $20.4 billion a year earlier.
With mortgage rates starting to gradually increase, ending the last quarter of 2018 at 4.8% for the 30-year fixed-rate mortgage rate, compared with 3.9% in the fourth quarter of 2017, there are not many borrowers left who can lower their mortgage rate through a refinance. That is why the refinance origination volume has been moderating in recent quarters. In our February 2019 Economic Outlook, we estimated refinance originations have declined to about $100 billion in the fourth quarter of 2018, or about 26% of total first lien, single-family originations. This compares to a total of $195 billion first lien, single-family refinance originations in the fourth quarter of 2017. Our fourth quarter 2018 Refinance Report gives light on the refinance activities trends for the conventional originations market.
1 See Financial Accounts of the United States, Federal Reserve Board https://www.federalreserve.gov/releases/z1/.
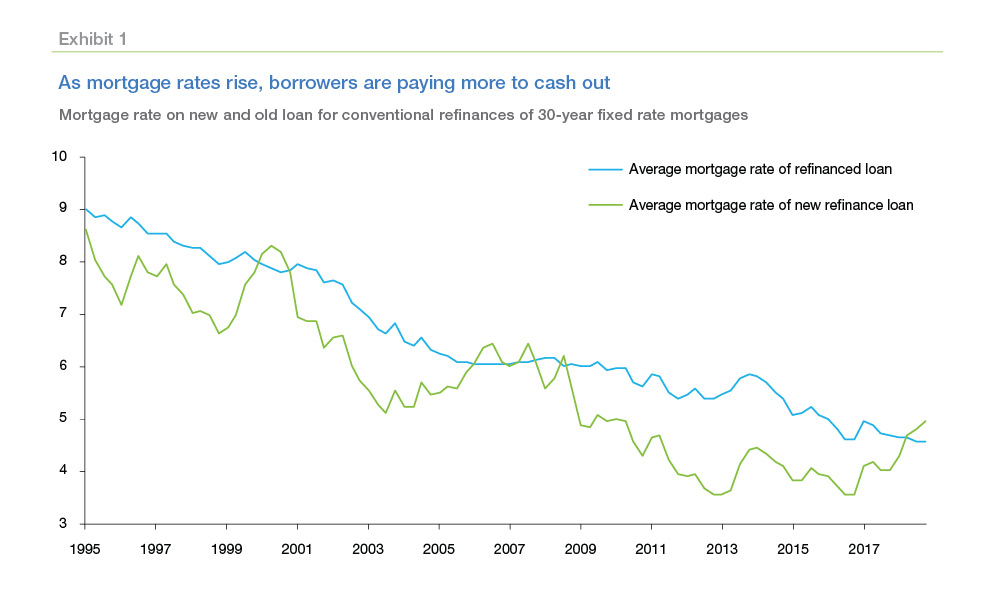
On average, borrowers who refinanced their first lien mortgage in the fourth quarter of 2018 took about 40 basis point higher rates, compared with about a 70 basis points rate decrease a year earlier and much lower than the almost 190 basis points rate reduction during the second quarter of 2013. Exhibit 1 compares the average mortgage rate of the old refinanced loan against the average mortgage rate of the new refinance loans for each quarter in our matched sample.
Many of the refinances during the fourth quarter of 2018 were not for rate reduction, but rather for cashing out equity to consolidate other higher interest debt or pay other bills or for home improvements. Those borrowers are on average willing to accept a higher mortgage rate on their new mortgage.
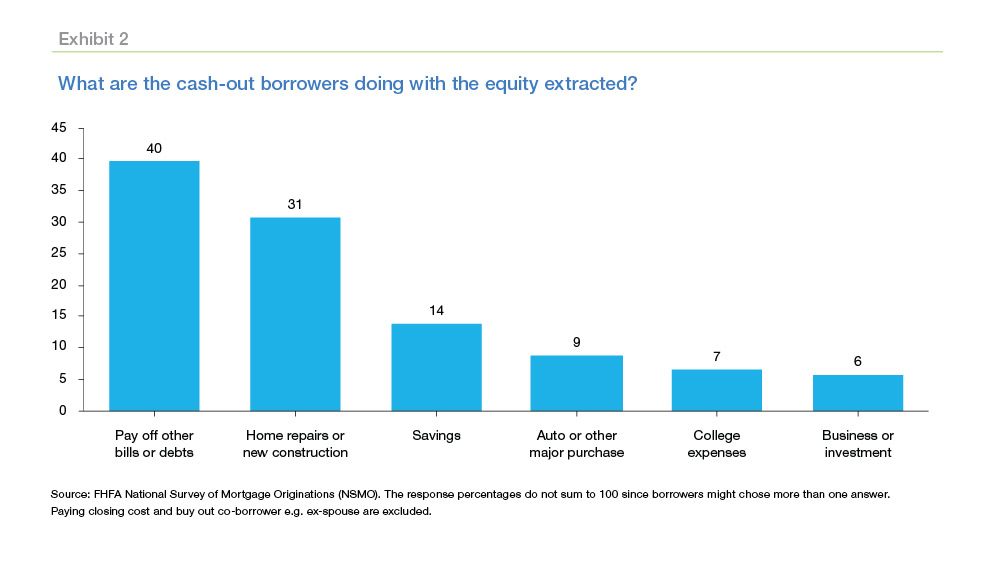
An important question has always been what are the cash-out borrowers doing with the equity they extract? To shed some light on this topic we analyzed the Federal Housing Finance Agency (FHFA) National Survey of Mortgage Originations(NSMO). NSMO is conducted quarterly and is jointly sponsored by the Federal Housing Finance Agency (FHFA) and the Bureau of Consumer Financial Protection (BCFP). It provides information “for a nationally representative sample of newly originated closed-end first-lien residential mortgages in the United States, particularly about borrowers’ experiences getting a mortgage, their perceptions of the mortgage market, and their future expectations.”
The latest survey data available captures loans originated from January 2013 through December 2016. According to the latest survey data, borrowers who refinanced and their new mortgage amount was higher than the closed loan have used the extra funds to pay other bills, home repairs and construction, savings, buying a new car (see Exhibit 2). About 40% responded that they used the money to pay off other bills or debt; approximately 31% of the borrowers used their home equity for repairs or new construction; 14% responded they have used these money for savings; and about 9% of borrowers used the money to buy an automobile; borrowers who responded they have used the cash-out amounts to pay college expenses were about 7%. These percentages in these responses are not mutually exclusive, i.e., same borrowers might have used to extra cash extracted in different ways.
More than 95% of refinancing borrowers chose a fixed-rate loan. Fixed-rate loans were preferred regardless of what the original loan product had been. For example, 94% of borrowers who had a hybrid ARM refinanced into a fixed-rate loan during the fourth quarter. In contrast, only 3% of borrowers who had a fixed-rate loan chose an ARM.
The fourth quarter Quarterly Refinance Statistics also includes statistics on refinances for 22 large metropolitan areas. In 2018 median house values on refinance loans have risen in all the 22 large metro areas included in the report, with the highest increases in Seattle, San Francisco, Dallas, Denver, Tampa, Miami and Houston where home values rose more than 30%. The smallest house price increases were registered in Baltimore, Chicago, Philadelphia and St. Louis areas. The cash- out share of refinances was more than 60% in all 22 CBSAs, though metro areas where house price increases were higher, the share of “cash-out” borrowers was large. The “cash-out” share was highest in the Dallas, Pittsburgh and Tampa metro areas were above the national share of 83%.
PREPARED BY THE ECONOMIC & HOUSING RESEARCH GROUP