


Proximity to a Metro Rail Station and Its Impact on Washington, DC Metropolitan House Prices: Amenity or Not?
Location, Location, Location are the three magic words when it comes to real estate. Everyone shops for the “right location” when buying a home, but determining the right location varies tremendously from buyer to buyer.
In metropolitan areas, where the cost of the commute is high, and time is of the essence, metro rail (light rail) provides an easy transport alternative. While proximity to a metro station can reduce commuting cost in terms of time and offer a level of convenience, it also comes with certain drawbacks—factors such as noise, crowded neighborhood streets and parking issues could become a nuisance. Depending on the buyer’s preference, proximity to a metro station could either increase or decrease the value of a house. This Insight analyzes whether DC Metro Area residents consider proximity to a Metro rail station to be an amenity or not, and how much value such proximity adds to or subtracts from the price of a house.1
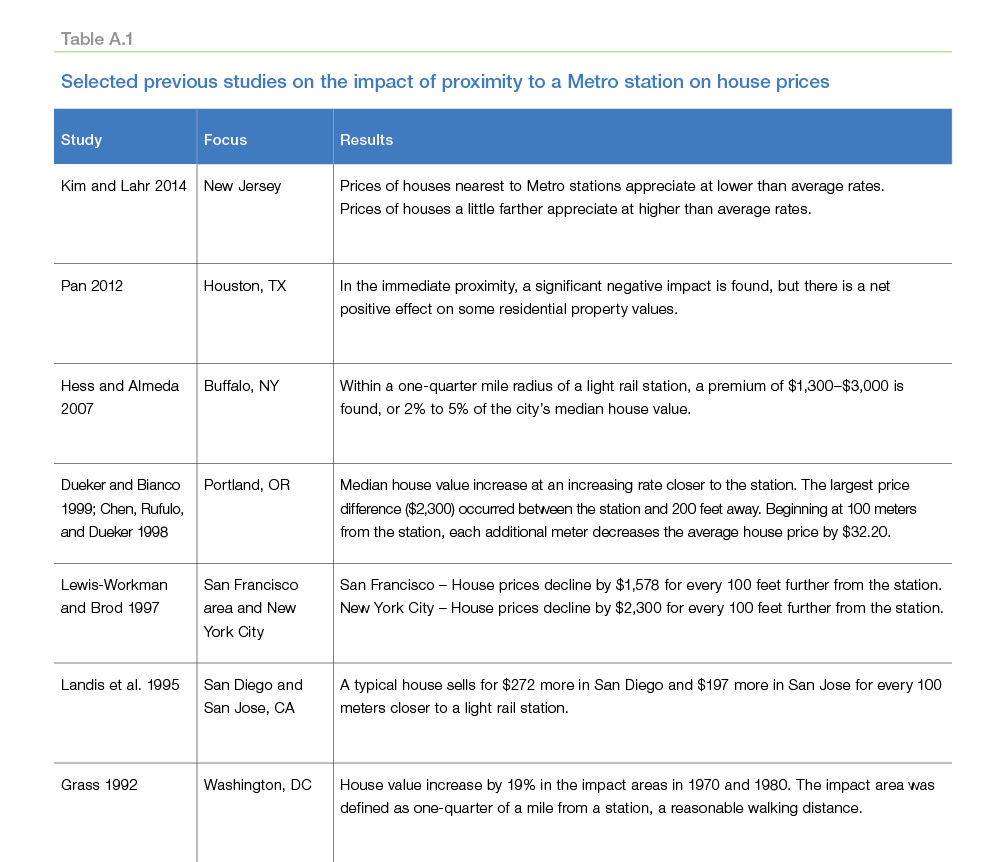
Washington Metro rail (known as “Metro”) began operations in 1976 and serves the District of Columbia, as well as several surrounding jurisdictions in Virginia (Arlington and Fairfax counties, including the independent cities of Alexandria, Fairfax and Falls Church) and Maryland (Montgomery and Price George’s counties). Metro is the second-busiest rapid transit system by ridership in the United States. Several studies have analyzed the impact of nearby light rail stations on residential property prices, but only a handful of studies have focused on the DC Metro Area (see Appendix A.1).
Within this Insight, we find that proximity to a Metro station in the DC Metro Area increases the prices of nearby houses. Additionally, we find that the closer the house is to the station, the higher the price.2 In some cases, This means that, when putting up a house for sale, highlighting the details about the proximity to a Metro station in the house listing may make the listing much stronger in terms of price.3
The value added to house prices, however, does vary. For example, the premium is higher for homes less than $415,000 and lower for more expensive homes. This may be because residents of lower cost homes may rely more heavily on public transportation and, therefore, may place a higher premium on proximity to a Metro station.
For many homebuyers in the congested DC Metro Area, cutting down on commuting time is of value. The sections that follow describe the questions we considered to tease out the effect of proximity to a Metro station on house prices.
What makes up house prices?
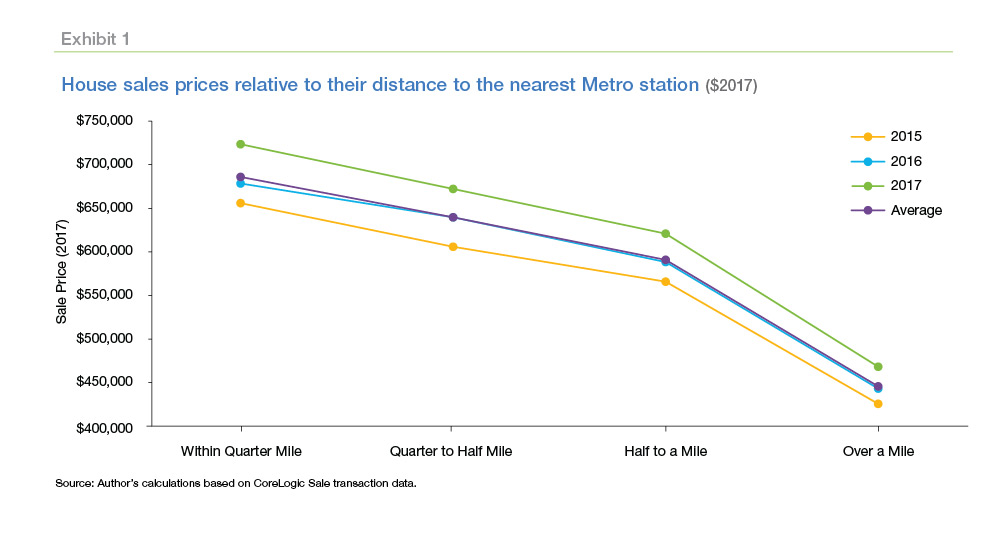
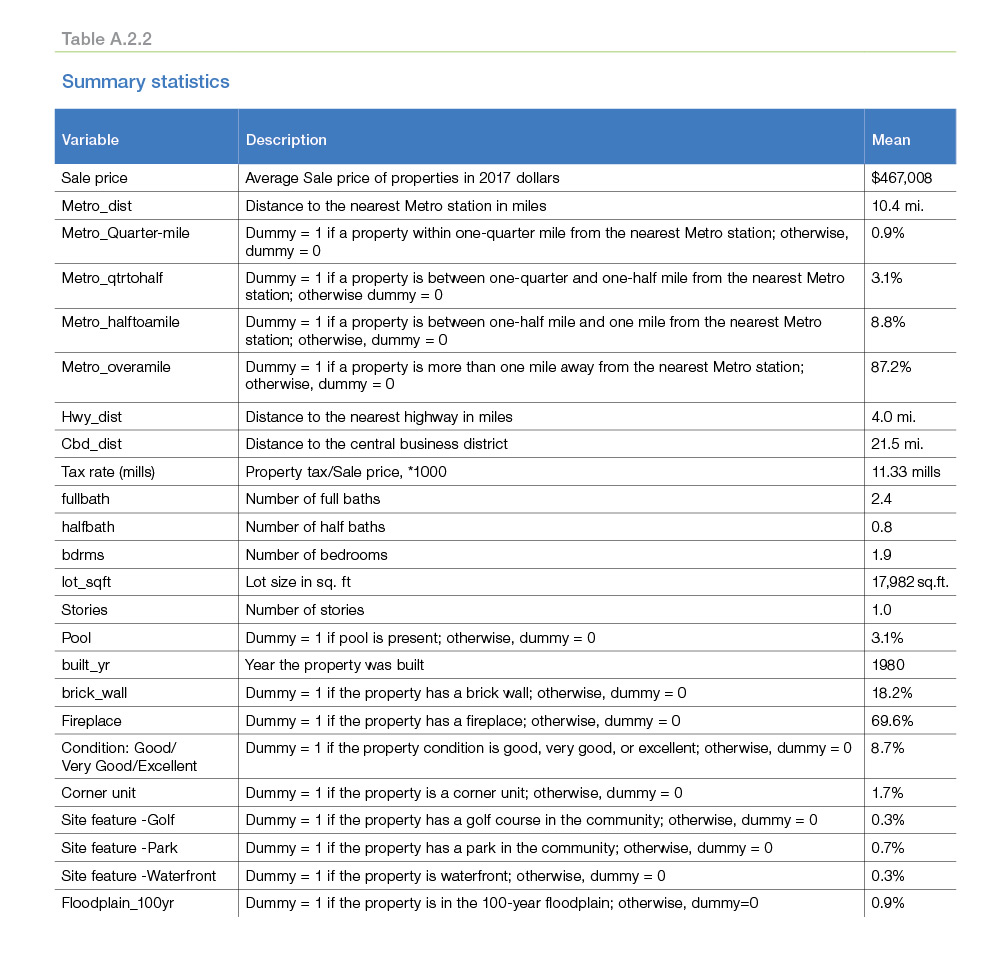
There are several factors to consider when pricing a house. A house’s appeal is first and foremost influenced by its location, followed by its structural attributes, including the number of bedrooms, bathrooms, and lot size, as well as amenities such as neighborhood and schools. Between 2015 and 2017 (our study period), houses sold for $467,008 on average in the DC Metro Area. The average distance to the nearest Metro station was 10.4 miles. These houses, on average, had 2 bedrooms, 2 full baths, 1 half-bath, and a lot size of 0.4 acre. Of all the homes sold during our study period, approximately 13% were within a mile of a Metro station, including 1% within one-quarter mile, 3% within one-quarter mile to one-half mile, and 9% within one-half mile to one mile. The rest were located more than one mile from the nearest Metro station. Exhibit 1 shows how prices vary according to the distance to a Metro station. See Appendix A.2 for other attributes tested.
How much value does proximity to a Metro station add to a typical house?
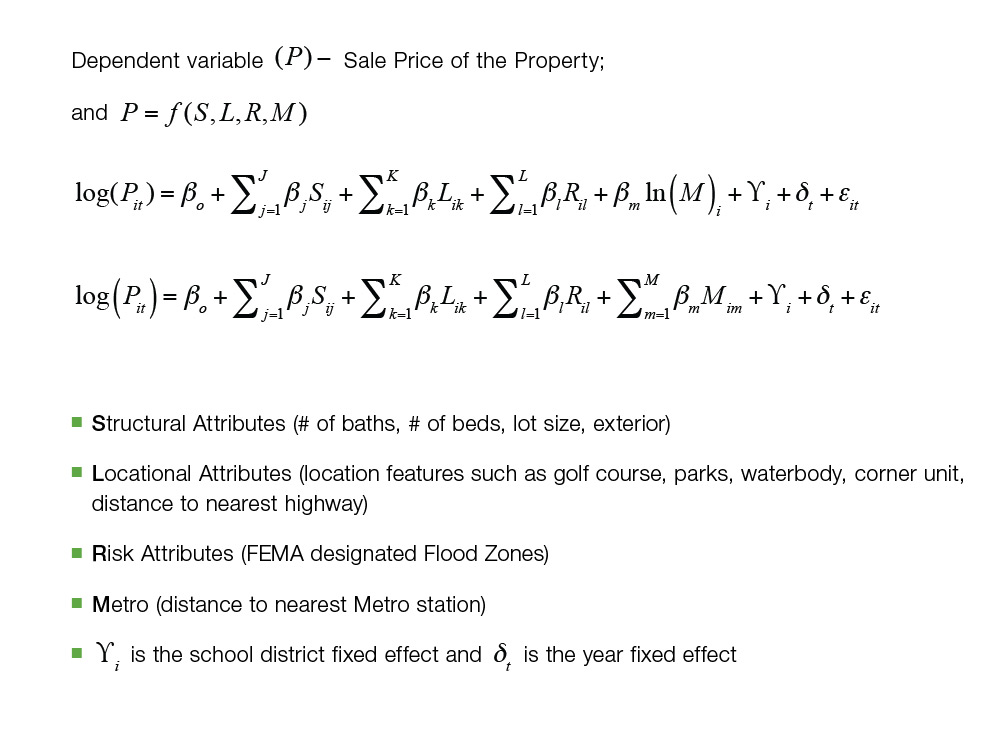
To quantify the value of a nearby Metro station on house prices, we use a hedonic model. This statistical method has been extensively used in previous studies to tease out the impact of a single variable of interest (in our case, proximity to a Metro station) on house prices. Full details of the model can be found in Appendix A.3.
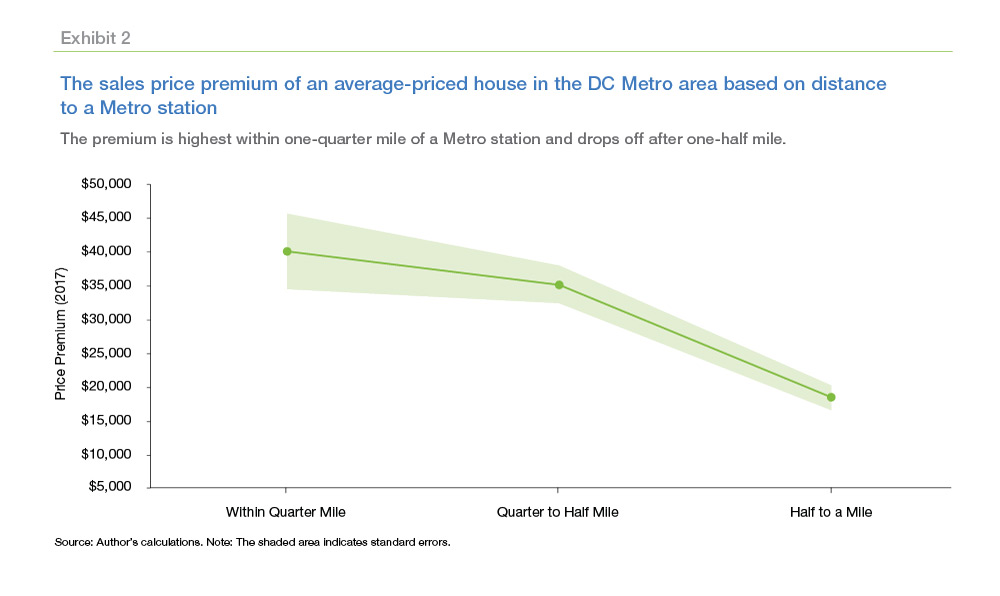
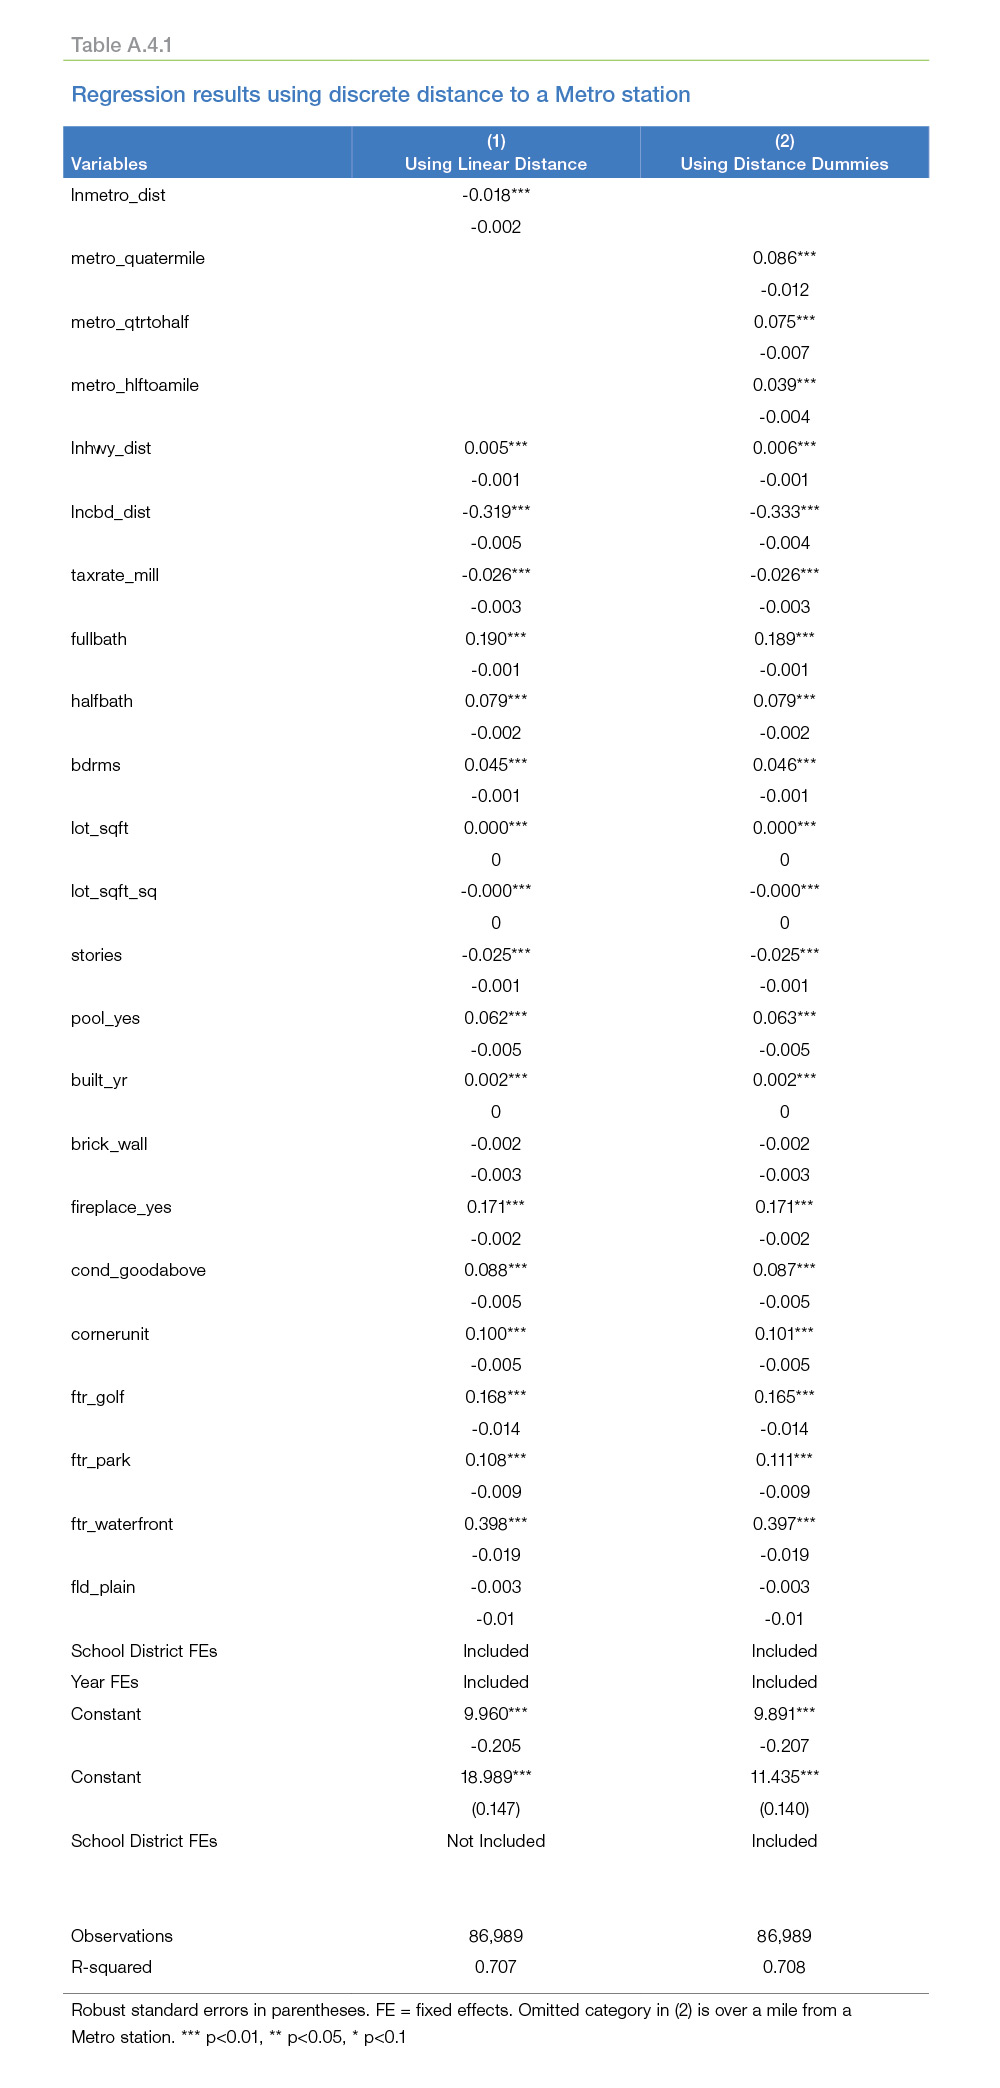
Consistent with most of the previous studies, our results indicate that there is a price premium for houses that are located closer to Metro stations in the DC Metro Area. For example, using small discrete distances, houses within a quarter mile of a Metro station, a reasonable walking distance, sold for 8.6% more than houses over a mile away. Similarly, houses within a quarter mile to a half mile of a Metro station sold for 7.5% more, and houses within a half mile to a mile sold for 3.9% more. Consequently, the price increase for houses one mile away is almost $8,640 and that amount goes up by $1,636 for every 100 feet closer the house is to a Metro station. Exhibit 2 shows the price premium for a typical house in the DC Metro Area based on proximity to a Metro station.
Is the amount of the house price premium the same for all houses?
The short answer is, no.
House prices differ significantly across localities and neighborhoods in the DC Metro Area. For example, in our study period, an average house in the Virginia suburb of Reston sold for almost $400,000, but an average house in nearby McLean, Virginia, one of the wealthiest areas in the country, sold for more than double that amount ($958,000). We sorted all the houses in the DC Metro Area from least expensive to most expensive and determined the impact of a nearby Metro station on each price point. This exercise reveals potential differences in the importance of proximity to a Metro station because residents of lower cost houses may depend more on Metro and thus may place more of a premium on proximity to a Metro station while residents of more expensive houses may not.
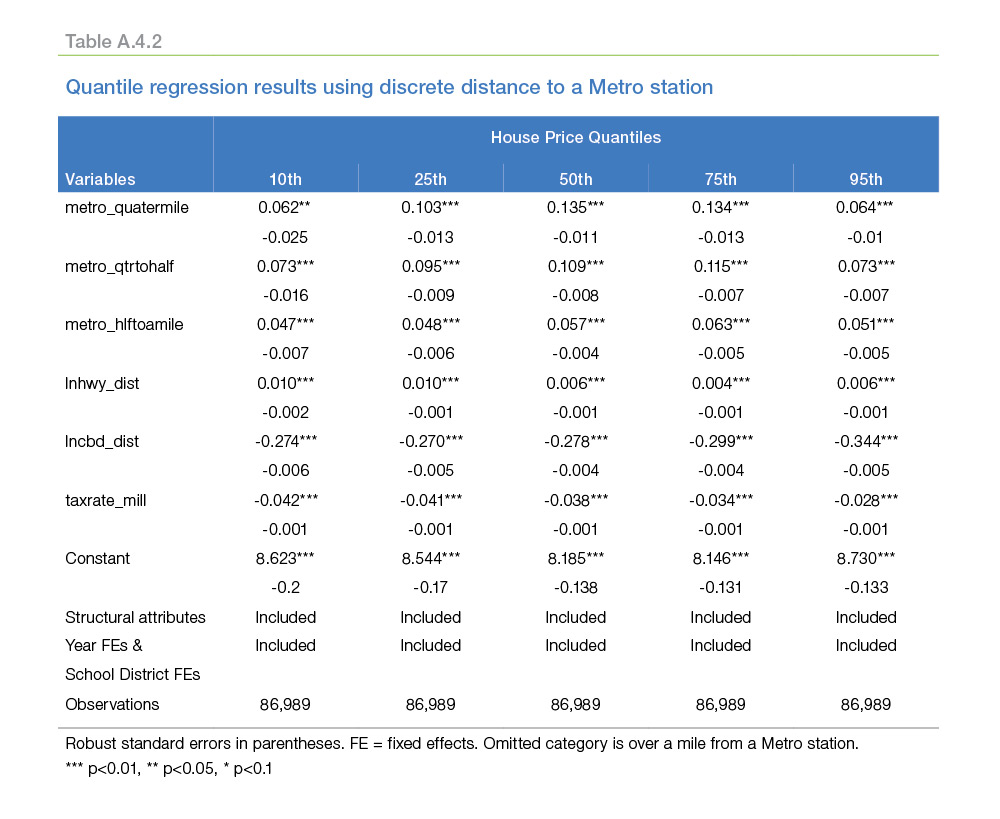
As expected, our analysis indicates that proximity to a Metro station has the smallest effect on the most expensive houses.4 In other words, buyers who buy more expensive houses do not value proximity to a Metro station as much as other buyers. Exhibit 3 presents the price premium
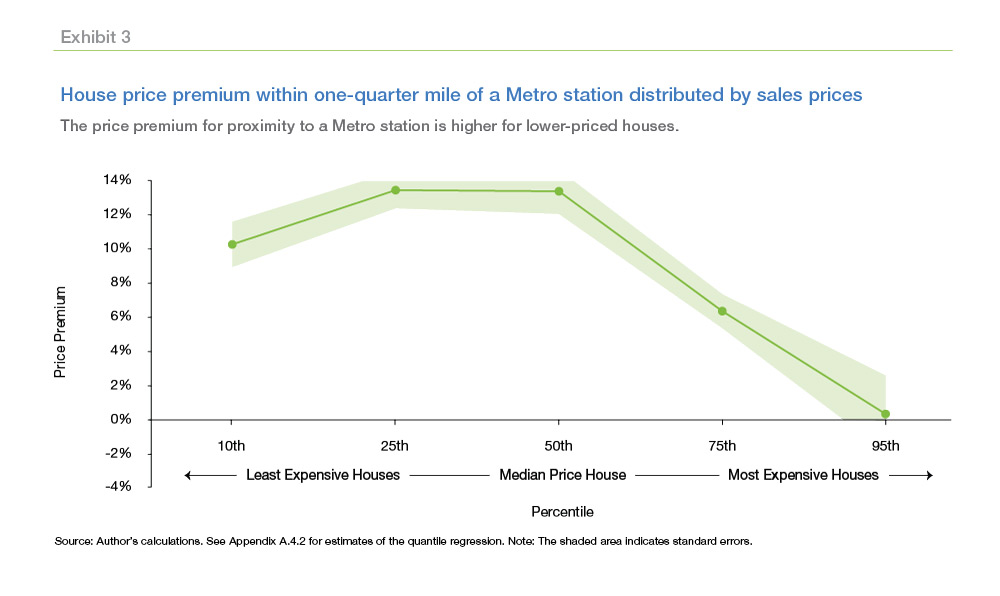
within one-quarter mile of a Metro station distributed by house prices. The price premium is the highest in the 25th and 50th percentile of the house prices, where prices range from $310,000 to $415,000. At this house price range, the price premium is around 13-14%, which is equivalent to about $41,000 to $55,000. By comparison, the price premium is insignificant in the 95th percentile of house prices, where prices are over $870,000.
Other notable findings
Other explanatory variables that were included in our analysis, such as structural attributes, show the expected results. For example, an additional full bath, half bath and bedroom add almost 19%, 8% and 4.6%, respectively, to house prices. A corner unit in the DC Metro Area was valued at 10% more than other units. Having a golf course, park or waterfront as a community feature commanded a premium of almost 16.5%, 11% and 40% on house prices, respectively. More notably, in the DC Metro Area, an increase in the property tax rate by $1 per every $1,000 in assessed value (11.33 to 12.34 mills) decreases the price of a house by 2.6%, which means that the tax liability is capitalized into house prices.
Appendix
Appendix A.1 Literature Review
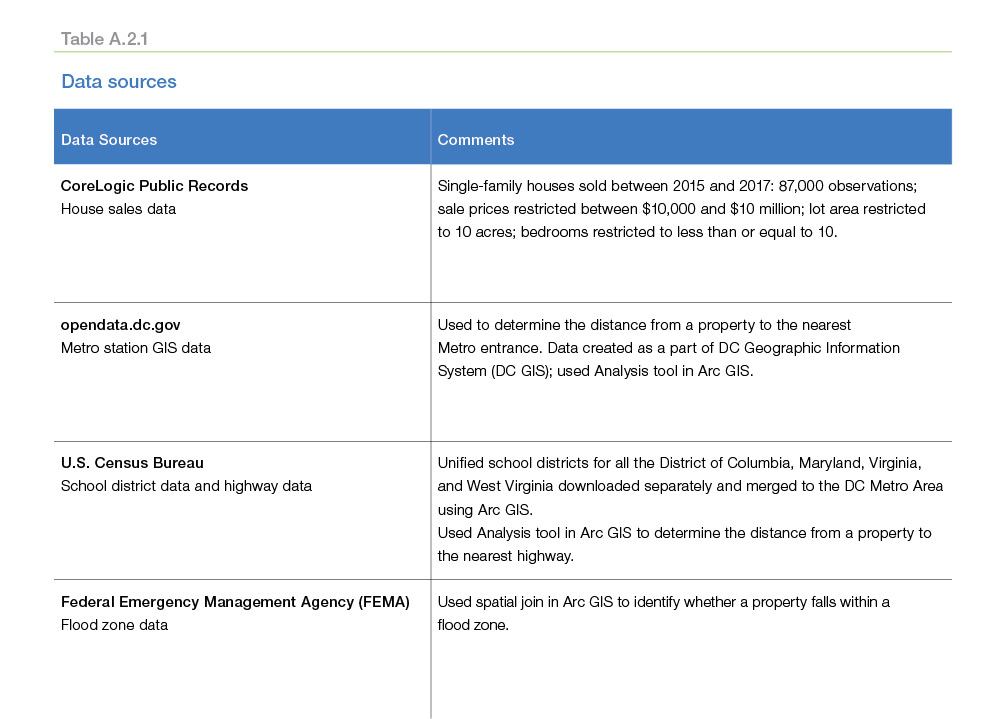
Appendix A.2 Data
Appendix A.3 Methods
We use a hedonic model focusing on properties sold between 2015 and 2018 in the DC Metro Area.
Appendix A.4 Results
References
Chen, Hong, Anthony Rufulo, and Kenneth Dueker. 1998. “Measuring the Impact of Light Rail Systems on Single-Family House Prices: A Hedonic Approach with GIS Applications.” Prepared for the Transportation Research Board, 77th Annual Meeting.
Dueker, Kenneth J. and Martha J. Bianco. 1999. “Light Rail Transit Impacts in Portland: The First Ten Years.” Presented at Transportation Research Board, 78th Annual Meeting.
Grass, R. G. 1992. “The Estimation of Residential Property Values around Transit Station Sites in Washington, DC” Journal of Economics and Finance 16 (2): 139–46.
https://doi.org/10.1007/BF02920114
Hess, D. B., and T. A. Almeida. 2007. “Impact of Proximity to Light Rail Rapid Transit on Station-area Property Values in Buffalo, New York.” Urban Studies 44 (5-6): 1041–68.
Kim, K., and M. L. Lahr. 2014. “The Impact of Hudson-Bergen Light Rail on Residential Property Appreciation.” Papers in Regional Science 93 (1): S79–S97.
Landis, John, Robert Cervero, Subhrajit Guhathukurta, David Loutzenheiser, and Ming Zhang. 1995. Rail Transit Investments, Real Estate Values, and Land Use Change: A Comparative Analysis of Five California Rail Transit Systems. Monograph 48, Institute of Urban and Regional Studies, University of California at Berkeley.
Lewis-Workman, Steven, and Daniel Brod. 1997. “Measuring the Neighborhood Benefits of Rail Transit Accessibility.” Transportation Research Record 1576 (1): 147–53.
Pan, Q. 2012. “The Impacts of an Urban Light Rail System on Residential Property Values: A Case Study of the Houston Metro Rail Transit Line.” Transportation Planning and Technology 36 (2): 145–69.
1 The DC Metro Area includes the District of Columbia and parts of Virginia and Maryland, along with a small portion of West Virginia. It is also known as the Washington-Arlington-Alexandria, DC-VA-MD-WV Metro Area.
2 We include single-family residences and townhouses in our analysis. Distance to Metro station is the Euclidean distance from the centroid of the property to the nearest Metro station.
3 This result is in line with Lewis-Workman and Brod 1997 research in San Francisco and New York City. See Appendix A.1 for selected literature review.
4 We use quantile regression that allows the effect of the explanatory variables to differ over house prices to determine whether the Metro premium was uniform across all house prices.
PREPARED BY THE ECONOMIC & HOUSING RESEARCH GROUP
Sam Khater, Chief Economist
Len Kiefer, Deputy Chief Economist
Ajita Atreya, Senior Macroeconomic Housing Economist