


Family Budget Burdens Squeezing Housing: Child Care Costs
There's something else keeping Susan and Peter up at night besides their newborn and 2-year-old: wondering how to pay the bills. Child care, in particular, is eating into their budget. It’s far more than the cost of repaying their student loans, and approaching the cost of their rent. They’ve deferred trying to save for a down payment for a home. Susan is even thinking about quitting her part-time job for a few years and staying home with kids.
As Susan and Peter, and millions of parents with very young children can attest, the list of expenses for a family unit can be never-ending. From housing and medical bills to child care and food, a paycheck, or even two paychecks, can only go so far. The good news is that family income at the national level has grown somewhat: For a family of four (two adults, two children), real median family income rose by 18.7% from 1990 to 2018. However, is this enough to help families meet their obligations—especially families with young children?
In many states, child care can cost as much as or more than housing and has skyrocketed over the last few decades.
This Insight focuses on one particular cost, child care, and how it compares to other family budget burdens, especially housing. Child care is an unavoidable expense for working parents, especially single parents and parents with younger children. In many states, child care can cost as much as or more than housing, and this cost has skyrocketed over the last few decades
The real (inflation-adjusted) price of child care increased by nearly 49% from 1993 to 2018 (Exhibit 1), according to the Bureau of Labor Statistics’ Consumer Price Index (CPI).
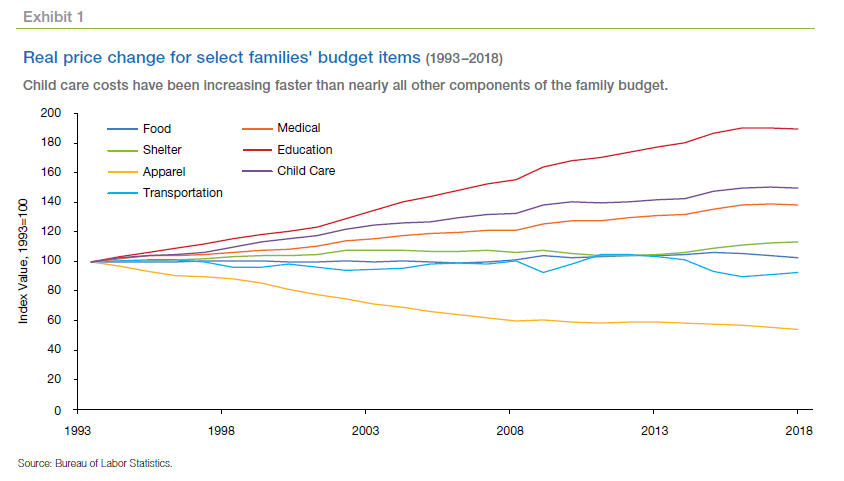
Only education expenses have grown faster (90%). By contrast, housing increased by only 14% in real terms from 1993 to 2018.1 Budget items such as transportation and food remained flat in real terms during the period, while the cost of apparel declined.
The sections that follow tease out how child care expenditures have risen over time as compared to other expenses and how much of a family’s income is affected. We find that child care expenditures for all types of care is about half the national median mortgage payment and nearly 80% of the national median rent. Existing research shows that while child care continues to put financial distress on many families, lower-income families bear the greatest burden: For a family making less than $1,500 per month who have children under the age of fifteen, almost 40% of its income goes toward this expense. We also find that families are spending the same share of their income on child care today as they did decades ago, on average. Finally, to contain costs, in practice, families resort to lower-cost alternatives, piecing together child care arrangements with relatives, friends, and neighbors.
What is the cost of child care?
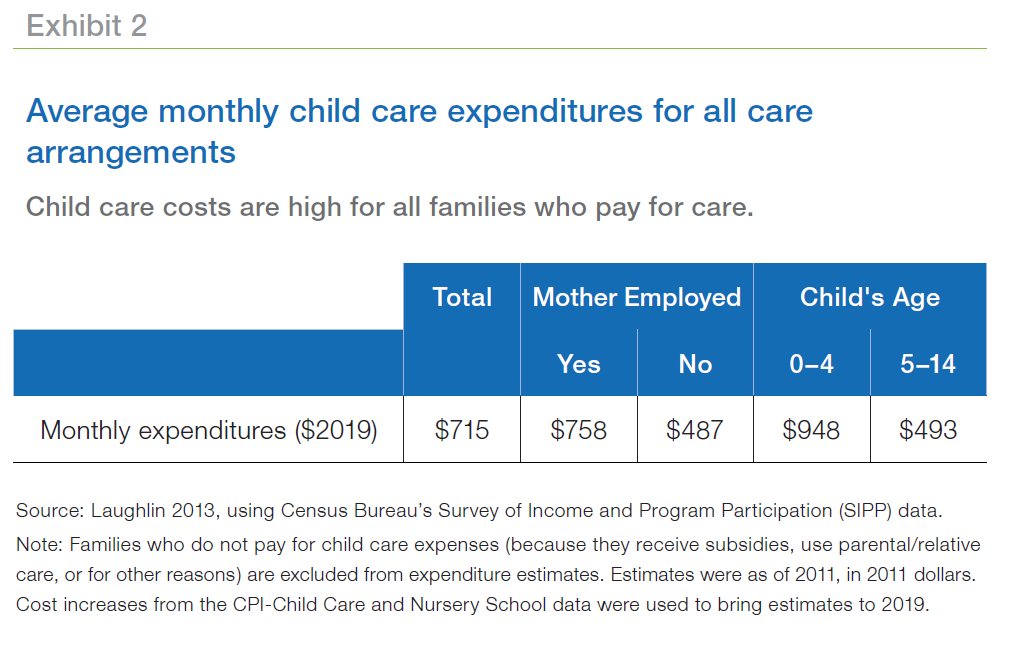
Families with young children spend significant amounts on child care. We estimate the average expenditure2 to be $715 per month (in 2019 dollars) across all modes of care for all children under 15 years of age, among those families paying for care (Exhibit 2).
This figure rises to $758 per month when the main parent with child care responsibilities is employed (referred to as “Mother Employed,” given that the reference parent will be the mother in most cases). The cost is greatest for younger children (infants, toddlers, and 4-year-olds), at $948 per month, compared to school-age children who spend much of their day in school, and incur costs only in after-school care or enrichment activities.
Traditionally, two modes of child care have been available to families: formal and informal care. Among formal care arrangements, center-based child care facilities (which include day care centers, nursery schools, and preschools) are the most expensive.
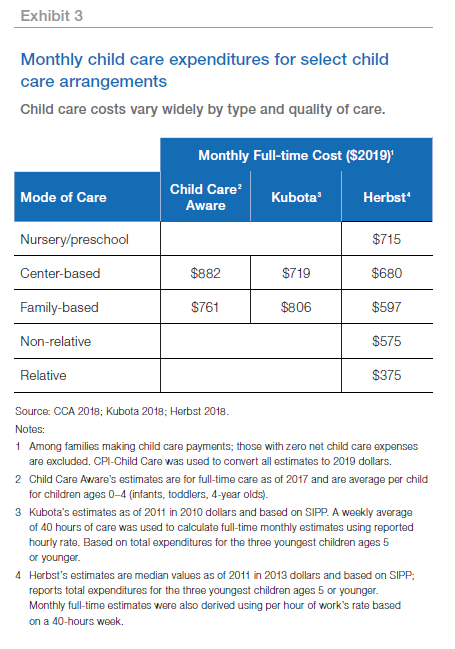
The national average cost of full-time center-based care for children ages 0– 4 is $882 per month per child (in 2019 dollars), according to Child Care Aware of America (2018).3 The other category of formal care is family day care centers, defined as providers who care for two or more children outside the child’s home. Costs for family-based child care are slightly lower than center-based care, at $761 per month per child, on average.
The informal sector includes care with relatives (such as grandparents) and non-relatives (such as babysitters, nannies, friends, and neighbors). Costs are typically lower, reflecting the fact that some tend to be lower quality and less structured than the formal counterpart. Overall, preschool, nursery, and center-based day cares cost the most, followed by family day care, non-relative care, and relative care.
How costly is child care compared to other budget items?
Child care costs are quite large relative to other household expenses. We estimate that the mean child care expenditure for all types of care is $715 per month in 2019 at the national level (Exhibit 2). That is about half the national median mortgage payment in 2018 of $1,566 and nearly 80% of the national median rent of $899 in 2018.4
While student loans have received a lot of attention, student loan repayments are far less than monthly child care expenditures, on average.
Student loans have received a lot of attention in the media for their unprecedented level of growth and their detrimental impact on millennials trying to buy a house. However, in terms of monthly obligations, monthly student loan repayments remain on average far below monthly child care expenditures. While student loan balances have nearly tripled (increasing 280% from 2005 to 2015), student loan payments have increased only 50 percent, from an average of $234 in 2005 to $351 in 2015 ($378 in 2019 dollars).5 This is about half the overall cost of child care, and lower than most child care arrangement costs presented in Exhibit 3.
How burdensome is the cost of child care for families, especially low-income families?
While child care expenditure levels are important, what is ultimately relevant to families is their ability to afford these expenses. The child care affordability literature defines "child care burden" as the percent of family income that is spent on child care. In Exhibit 4, we consider the child care burden for different income groups.
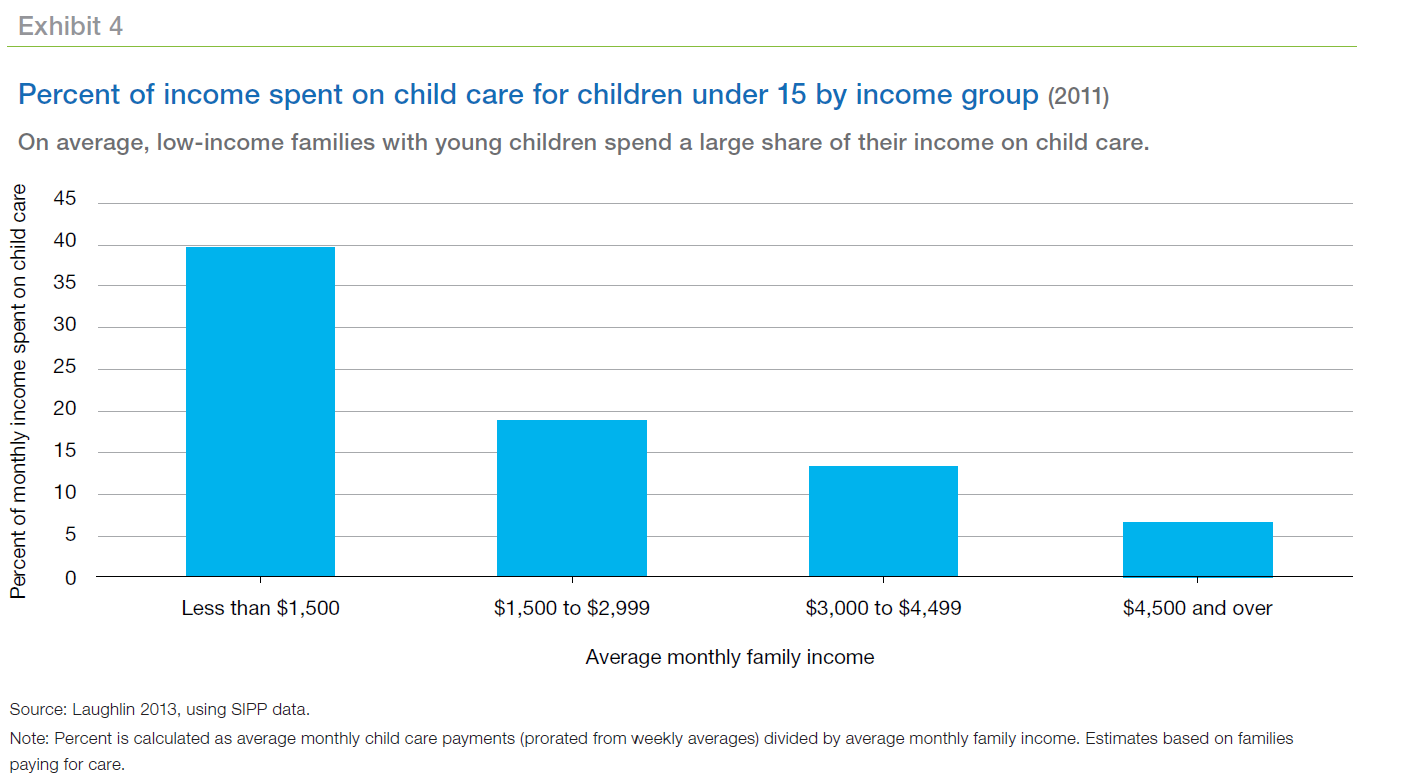
First, all families with children under 15 years who make child care payments spent on average 7% of their income on child care in 2011.6 Furthermore, low-income families are disproportionally more burdened. Families who had non-zero child care costs making less than $1,500 per month spent almost 40% of their income on child care.
Even though low-income families spend a bigger share of their income on child care, they spend considerably less than their higher-income counterparts. This means higher-income families are choosing higher-quality care, while low-income families are more likely to choose informal care to contain costs. Indeed, only about one-quarter (23.8%) of families below the poverty level use organized care facilities (center-based, nursery/preschool, and family day care), compared to 40.5% for families at or above the poverty level.7
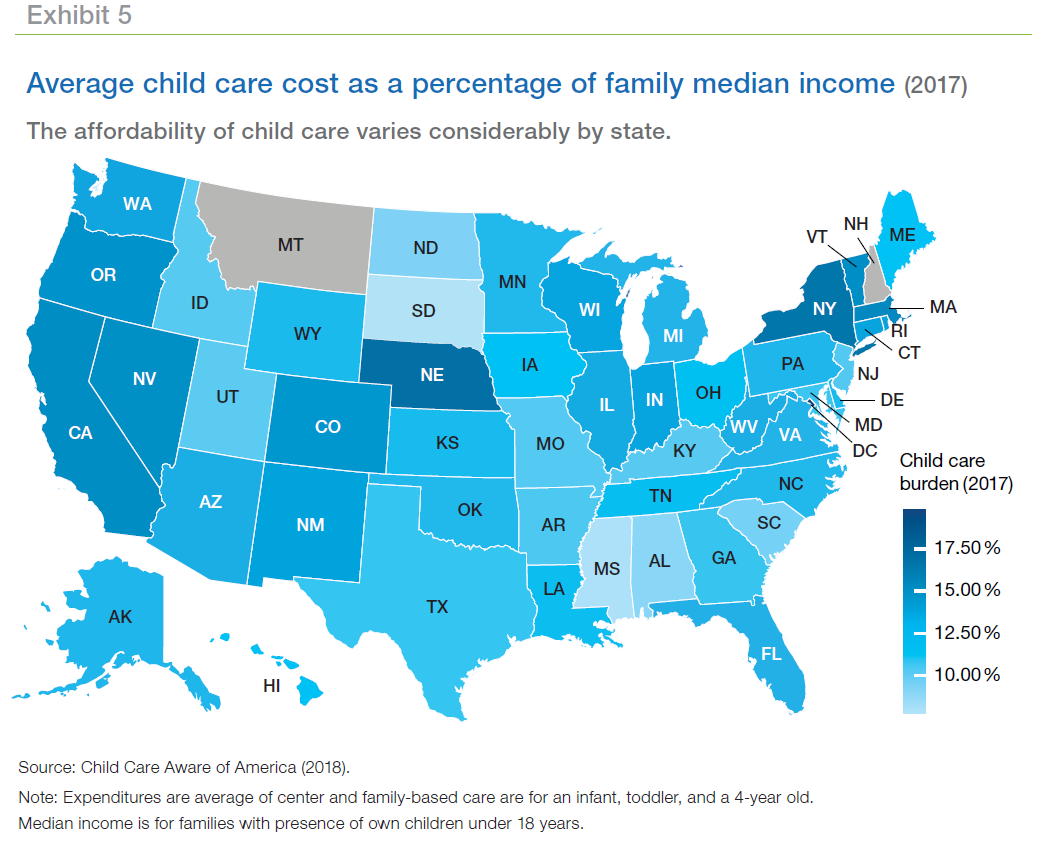
The child care burden varies considerably at the state level. Nationally, families with children using center-based and family day care spend 13.3% of their income on child care.8 The burden ranges from 7.9% in Mississippi to 19.3% in Washington, DC, and is highest in the Northeast and West Coast (Exhibit 5). Exceptions to this pattern are Nebraska (in the Midwest), which is among the most unaffordable states because its family day care centers are very expensive, and New Jersey (on the East Coast) which is relatively affordable, at 10.4%.
Has child care become increasingly burdensome over time?
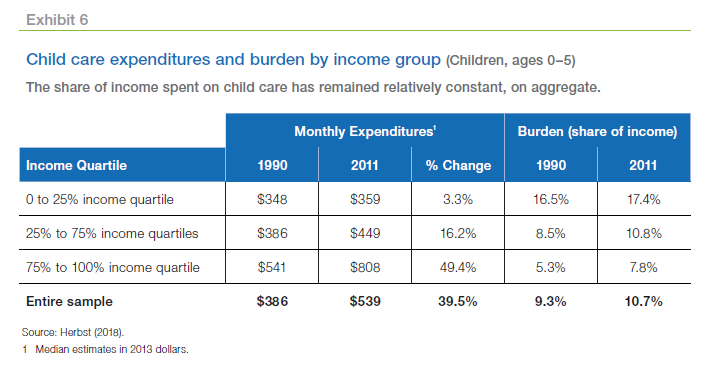
While child care costs continue to be a large budget item for many families, their share of family income has not changed much over the period. Herbst (2018) finds that this share for children ages 0–5 increased from 9.3% in 1990 to 10.7% in 2011. The increase is also moderate but slightly higher for families in the top income quartile, reflecting a higher increase in expenditures for this income group. The burden for high-income families grew from 5.3% in 1990 to 7.8% in 2011. In contrast, low-income families have had a small increase in both child care expenses and share of income (Exhibit 6).
Are there any low-cost child care alternatives?
So far, this Insight has documented the rise of child care expenses over the last few decades. In practice, however, the news is not all bad for families: Many receive free child care through subsidies, Head Start programs, or by having a relative/parent provide care. Families also may choose other lower-cost alternatives to full-time center-based and family day care including faith-based organizations, relatives, and non-relatives.
The percent of families that do not pay for child care has increased over time. The Census Bureau reports that the share of families with children under 15 paying for care has declined markedly, from 42% in 1997 to 32% in 2011.9
Families are also choosing to use informal care in larger proportions to control rising costs of child care. More than half of families with children under 5 (55%) used an informal care arrangement in 2011, according to the Census Bureau.10
Conclusion
This Insight has documented the rising cost of child care for working families with young children. Between 1993 and 2018, child care expenditures rose more 49% in real terms—more than the growth in most other household budget items. Families paying for care spend 10.5% of their income on child care, with lower-income families spending materially more. However, this share has remained relatively constant over the period.
The fact that among those who pay for care, over half use informal care arrangements may have some implications: To the extent that informal nonparental care can be less reliable or less structured, this may likely lead to a gap in school readiness between economically advantaged and disadvantaged families. Recent research documents that high-quality child care can yield lifetime benefits in terms of pro-social behavior and soft skills like teamwork, problem-solving, and emotional intelligence. There is strong evidence that the social returns from these investments are strongly positive.11
Another consequence of rising child care costs is the trade-off faced by families, especially women, between working and staying at home to care for children. Women’s labor force participation, after rising from 1985 to 2000, has been declining since 2000, coinciding with an uptick in the rate of growth in child care costs. While it is not clear whether these patterns are causal or merely a coincidence, some research12 has estimated a negative impact of child care costs on women’s labor force participation. It remains true that access to quality affordable child care is and will remain an impediment to women’s ability to work, making it harder for families to cover housing costs or save for a down payment to buy a house.
Finally, a word of caution is in order regarding the child care burden estimates in this Insight: the numbers reported are aggregate-level figures and, as such, are not fully representative of distributional differences at the family level. The 10.5% national burden masks the fact that many families spend significantly more on child care.13
References
Blau, Francine, and Lawrence W. Kahn. 2013. “Female Labor Supply: Why Is the United States Falling Behind?” The American Economic Review 103 (3): 251–56.
CCA (Child Care Aware of America). 2018. The US and the High Cost of Child Care: A Review of Prices and Proposed Solutions for a Broken System. 2018 Report. Arlington, VA: Child Care Aware.
Heckman, James J. 2006. “Skill Formation and the Economics of Investing in Disadvantaged Children.” Science312 (5782): 1900–1902.
Heckman, James J., Seong Hyeok Moon, Rodrigo Pinto, Peter A. Savelyev, and Adam Yavitz. 2010. “The Rate of Return to the HighScope Perry Preschool Program.” Journal of Public Economics 94 (1-2), 114–28.
Hendren, Nathaniel and Ben Sprung-Keyser. 2019. “A Unified Welfare Analysis of Government Policies.' NBER Working Paper No. 26144, National Bureau of Economic Research, Cambridge, MA.
Herbst, Chris M. 2018. "The Rising Cost of Child Care in the United States: A Reassessment of the Evidence." Economics of Education Review 64 (C): 13–30.
Kubota, So. 2018 “Child Care Costs and Stagnating Female Labor Force Participation in the US.” Unpublished working paper. https://drive.google.com/file/d/18ywB-GrgYcYtocKIBJ7v9ttbUE8UnA2e/view
Laughlin, Lynda 2013. “Who’s Minding the Kids? Child Care Arrangements: Spring 2011.” Current Population Reports, P70-135. U.S. Census Bureau, Washington, DC.
Mattingly, Marybeth J., Andrew P. Schaefer, and Jessica A. Carson. 2016. "Child Care Costs Exceed 10 Percent of Family Income for One in Four Families." National Issue Brief No. 109, the Carsey School of Public Policy, University of New Hampshire. https://scholars.unh.edu/carsey/288
1 Housing is captured by the CPI component “shelter,” which includes rent and owner’s equivalent rent (OER)—the amount of rent that would need to be paid to substitute a currently owned house as a rental property. The Bureau of Labor Statistics (BLS) uses OER in computing its shelter index rather than the current property value because it is immune to wide fluctuations in house prices. This modest increase in the housing cost at the national level is not representative of increases in any specific housing market. For example, housing in Denver increased by 39%, while housing in Detroit and Cleveland declined over the period.
2 Throughout this Insight, child care expenditure estimates using the Survey of Income and Program Participation (SIPP) data are based on families that have non-zero child care expenses (that is, while the survey sample includes families who have zero out-of-pocket child care costs because they receive subsidies, use parental/relative care, or for other reasons, these cases are excluded from the analysis).
3 Two other studies estimate somewhat lower, but still high, monthly costs: $665 (Kubota 2018) and $636 (Herbst 2018). Kubota (2018) reports a real hourly rate based on actual reported hours of care. To provide a full-time estimate, a weekly average of 40 hours was used for the conversion. The full-time estimates in Herbst (2018) were similarly calculated using hourly rates. Herbst estimates median rather than mean values, arguing that the cost distribution in his sample is skewed toward a few large values, which may make averages less representative.
4 American Community Survey–Census Bureau. Table B25088 for owner cost (with and without mortgage), Table B25058 for rent (contract rent).
5 For details, see
Most student loan payments remain affordable, says Cleveland Fed economist
6 The share is 10.5% for children ages 0–4.
7 See Laughlin (2013, Table 2)
Who’s Minding the Kids? Child Care Arrangements: Spring 2011
8 This measure of family burden is based on state-level data from CCA and is constructed using expenditures on center- based and family day care (averaging across the two) divided by the median income of families with children at the state level. The 10.5% estimate in Exhibit 4 is lower because it includes all care types, whereas the 13.3% number is restricted to center-based and family day care.
9 Laughlin (2013, Figure 4)
Who’s Minding the Kids? Child Care Arrangements: Spring 2011 (census.gov) . Herbst (2018) also finds that the proportion of families paying for care with the youngest child under 5 decreased from 59% in 1990 to 41% in 2011.
10 Laughlin (2013, Table 3)
Who’s Minding the Kids? Child Care Arrangements: Spring 2011 (census.gov).
11 See, for example, Heckman (2006), Heckman et al. (2010), and Hendren and Sprung-Keyser (2019).
12 See Blau and Kahn (2013); Kubota (2018).
13 See Mattingly et al. (2016).
PREPARED BY THE ECONOMIC & HOUSING RESEARCH GROUP
Sam Khater, Chief Economist
Doug McManus, Director of Financial Research
Kadiri Karamon, Senior Quantitative Analyst