


Refinance Trends in the First Quarter of 2020
American homeowners have many options when it comes to mortgage financing. Most homeowners with a mortgage opt for a fully pre-payable 30-year fixed rate mortgage. The fixed rate locks in a fixed payment for the life of the loan, while the 30-year term lowers the required monthly payment. Locking in a fixed rate protects American homeowners from the risk of an increase in mortgage interest rates and the higher payments that would come with it under an adjustable rate mortgage. The fully pre-payable feature of home mortgages gives American homeowners the added flexibility of refinancing their mortgage should interest rates fall. American homeowners can also refinance their mortgage to extract home equity via a cash-out refinance. As we noted in a previous report, American homeowners who extract equity typically use the funds to pay off other debts (credit cards, student loans) or to finance home improvement projects.
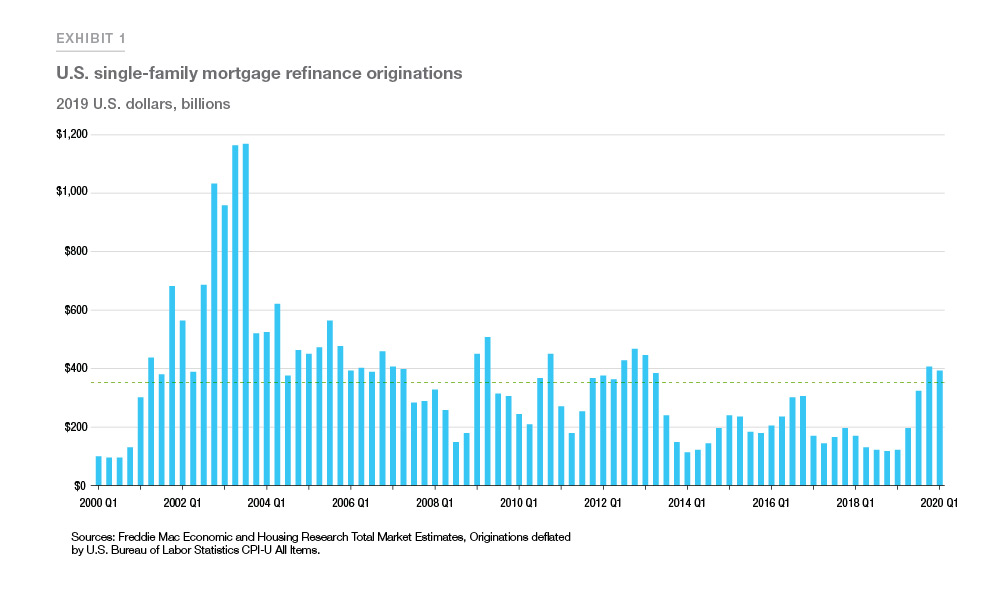
With mortgage rates reaching a then-historical low in March of 2020,1 mortgage refinancing activity surged at the end of the first quarter of 2020 (Exhibit 1). There were nearly $400 billion in single-family first lien refinances in inflation-adjusted 2019 dollars. This is about double the volume of a year earlier, but remains about one third of the nearly $1.2 trillion inflation- adjusted refinances we saw in the third quarter of 2003.
This report explores various aspects of mortgage refinancing activity in the first quarter of 2020 and compares recent activity to historical trends. Detailed statistics about mortgage refinance activity can be found in our Quarterly Refinance Statistics.
Since the end of last year mortgage rates declined about 0.20 percentage points to 3.5% for the 30-year fixed-rate mortgage, down from 4.4% during the same quarter a year earlier. The historically low mortgage rates in the first quarter of 2020 fueled an increase in refinance activities. In the first three months of the year, refinance activities have picked up to about 65% of all first lien single-family mortgage applications according to the Mortgage Bankers Association Weekly Applications Survey.
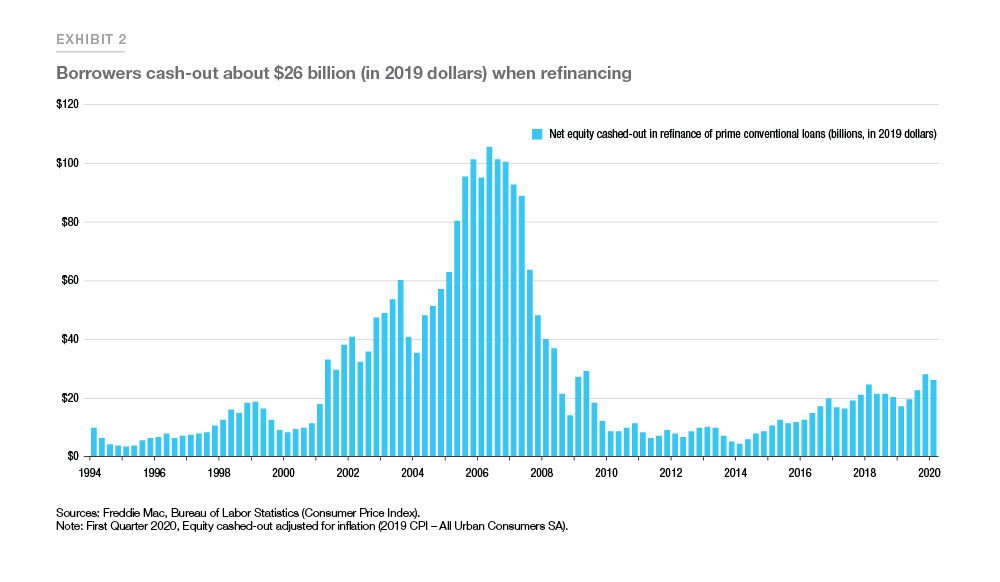
Based on Freddie Mac’s Quarterly Refinance Statistics, “cash-out” borrowers, those that increased their loan balance by at least 5%, represented 42% of all refinance loans; a slight decline from the previous quarter, much lower than the 89% share reached during the third quarter of 2006. The total cash-out volume was also lower compared to the previous decade. Adjusted for inflation in 2019 dollars, an estimated $26.3 billion in net home equity was cashed out during the refinance of conventional prime-credit home mortgages in the first quarter, up from $17.3 billion a year earlier and substantially less than the peak cash-out refinance volume of $106.7 billion during the second quarter of 2006 (See Exhibit 2).
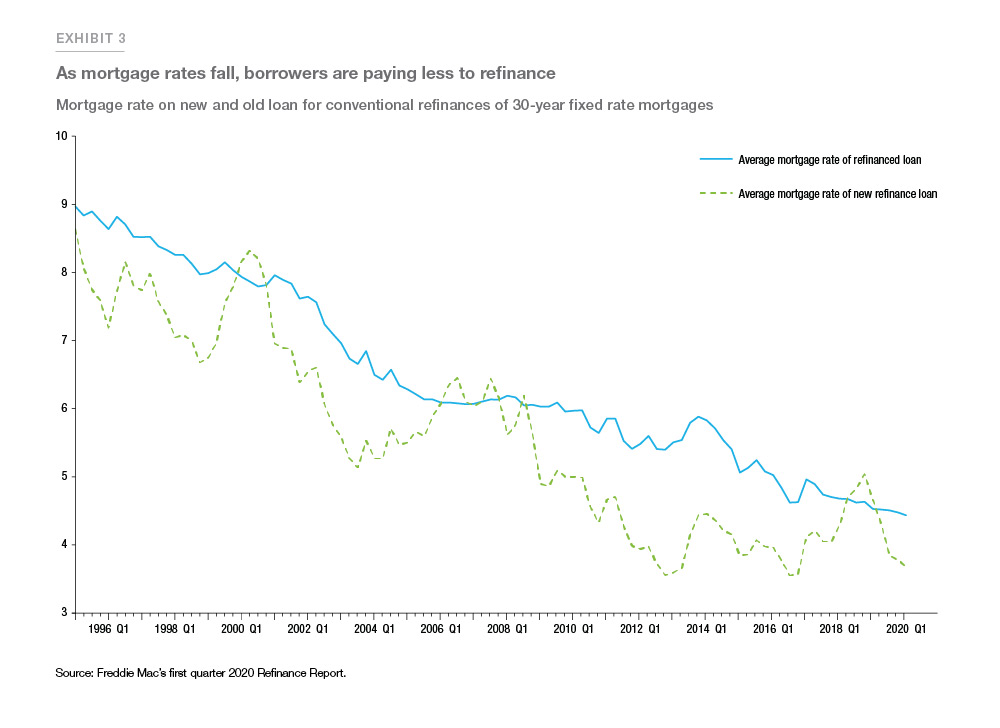
On average, borrowers who refinanced their first lien mortgage in the first quarter of 2020 lowered their rate by about 0.75 percentage points. A year earlier refinance borrowers only lowered their rate by 0.15 percentage points on average. The interest rate savings were much lower than the almost 1.90 percentage point rate reduction borrowers got in the second quarter of 2013.
Exhibit 3 compares the average mortgage rate of the old refinanced loan against the average mortgage rate of the new refinanced loans for each quarter in our matched sample.
During the first quarter of 2020, borrowers saved on average close to $2,000 dollars in annual interest payments by refinancing, though the amount saved differed significantly by refinance purpose; borrowers who refinanced in order to lower their rate or extend the term of their loan saved on average about $2,300 in annual interest payments while cash-out borrowers saved on average less than $1,000 in annual interest payments.
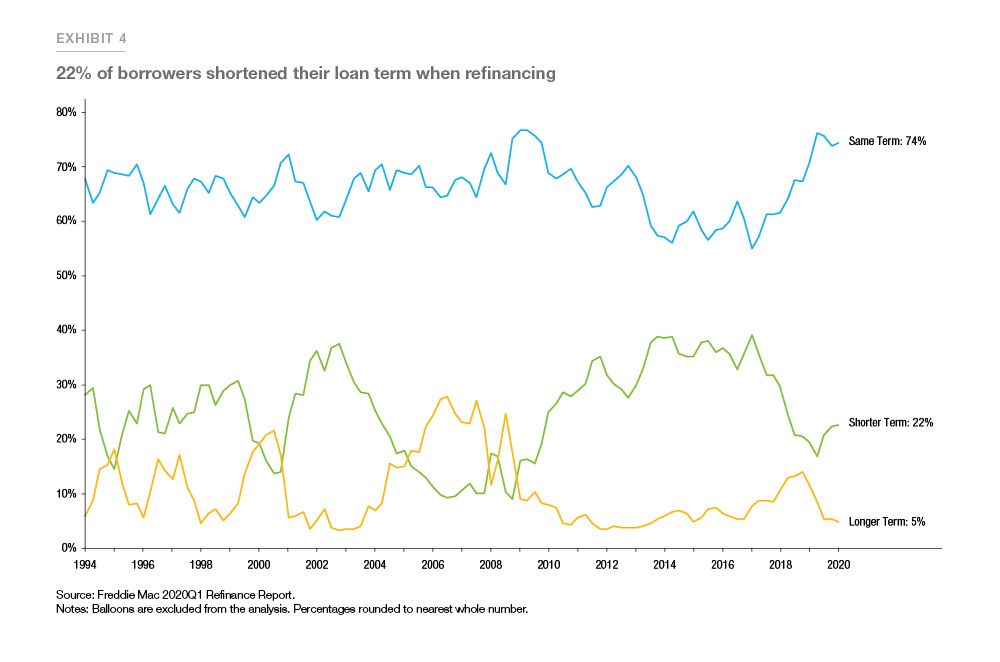
Of borrowers who refinanced in the first quarter of 2020, about 22% shortened their loan term, unchanged from the prior quarter (see Exhibit 4). The difference in mortgage rates between the 30-year and 15-year fixed rate loans averaged 0.54 percentage points. Borrowers tend to refinance into shorter term products when the mortgage rate difference between the 30-year and 15-year products is larger. For example, in the first quarter of 2014, the difference between the 30-year and 15-year fixed-rate loan products was 0.96 percentage points, and more than 37% of borrowers shortened their loan term.
In terms of product distribution, more than 98% of refinancing borrowers chose a fixed-rate loan. Fixed- rate loans were preferred regardless of whether the original loan had a fixed rate or an adjustable rate.
First-time refinance borrowers
Our unique data allows us to tabulate trends for what we call First-Time Refinance Borrowers (FTRB). FTRB are borrowers who refinance a loan and the refinanced loan was for the purchase of a home as a First-Time Home Buyer (FTHB). FTRB statistics give us insight into FTHB that has previously been unexplored. Over the past few years we have seen a surge in FTHBs as the Millennial generation has started to enter peak homebuying years and the homeownership rate for under 35 has increased.
Per the latest Census Housing Vacancy Survey for the first quarter of 2020, the homeownership rate for households under 35 was 37.3%, up almost two full percentage points from the first quarter of 2019.
FTHBs entering the market over the past few years have experienced falling mortgage interest rates and rising house prices. This has enabled them to refinance their loans, lowering payments and tapping home equity.
Exhibit 5 shows the share of FTRB among refinance borrowers in Freddie Mac data dating back to 1996. In the first quarter of 2020, the FTRB share was 19%. That means that nearly one in five conventional refinance borrowers was a first-time refinancer. That was up substantially from a few years ago. In recent quarters, FTRBs have typically been refinancing to lower their rate or extend their term. Just 15% of FTRBs extracted home equity through a cash-out
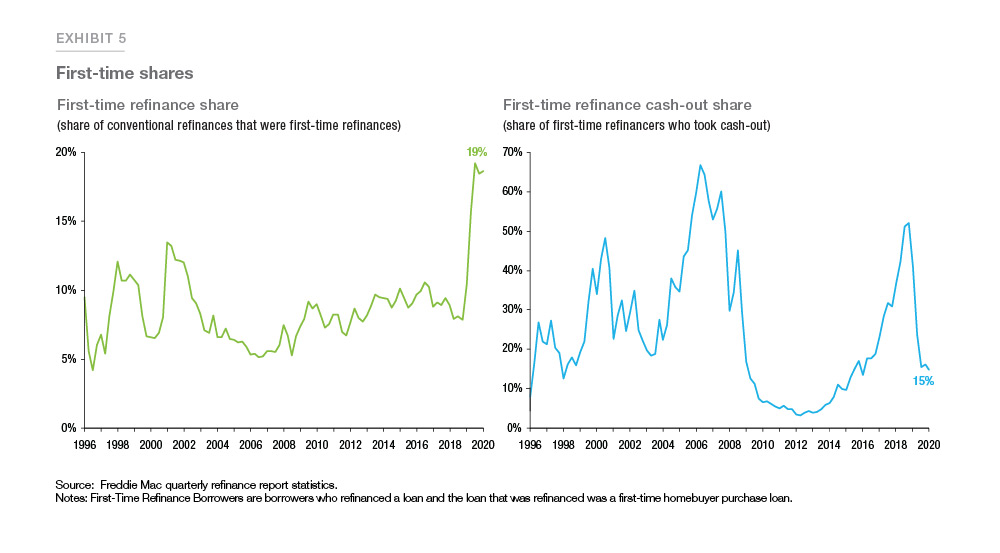
In the first quarter of 2020, FTRBs saved on average $2,200 in annual interest payments when they refinanced their loan, about $200 more in savings when compared to all refinance borrowers. In the first quarter of 2020, 15% of FTRBs cashed-out equity. During that same period, non-FTRBs took cash out in 39% of refinances. Among cash-out refinances, FTRBs cashed out on average about $60,000 in equity, while non-FTRBs cashed out on average about $67,000.
Examining FTRBs we can also learn about the household finances of recent FTHBs. The time between the original home purchase and refinance for FTRBs in the first quarter of 2020 was 33 months on average. Over that time the qualifying income of FTRBs increased 11%, or an annualized rate of about 3%. FTRBs generally improved their credit, with their FICO score increasing on average by 12 points. These trends point to a generally improving household credit situation and a stronger economy ahead of the COVID-19 pandemic. However, these statistics should be interpreted with some care as they only apply to refinance borrowers. Households that faced adverse economic conditions may have difficulty refinancing. There also could be differences in the propensity to refinance that relate to these statistics. Nevertheless, they provide an interesting window into the finances of FTHBs.
Conclusion
This report examines refinance trends through the first quarter of 2020. Most of that period encompassed a pre-pandemic economy that was characterized by low unemployment and a robust economy. Since then the COVID-19 pandemic has ravaged the health of the American people and presented one of the most challenging economic environments in a generation. Nevertheless, we have seen mortgage refinance activity remain robust through April and May. This report establishes a useful baseline for comparison when we tabulate the data for the second quarter of 2020 and beyond to see how the mortgage market responded in a pandemic world.
References
1 Freddie Mac’s Primary Mortgage Market Survey began on the week of April 2, 1971. It reached then-record low of 3.31% in the week of November 21, 2012. In the week of March 5, 2020, it reached a new record low of 3.29%. In April and May of 2020, the rate fell even lower. As of writing the historical low rate of 3.13% was reached in the week of June 18, 2020.
PREPARED BY THE ECONOMIC & HOUSING RESEARCH GROUP