


The Growth of Sole-person Households: Creating Even More Demand for Smaller, More Affordable Homes
The COVID-19 pandemic has brought many changes to the housing market. More and more homebuyers started looking for homes away from cities and demanding larger homes as their needs changed with remote work.
In the older neighborhoods in metro areas across the United States, smaller homes are being knocked down and replaced by larger homes. This trend began even before the pandemic hit. The latest data from the U.S. Census Bureau’s Survey of Construction (SOC) shows that in 1990, 29% of new single-family homes completed had four or more bedrooms. That share had increased to 43% by 2019 (pre-pandemic) and further increased to 44% by 2020. The share of three-bedroom homes declined from 57% to 44% in 2020, and the share of homes with two bedrooms or less declined from 15% to 10% over the same period.1 Bigger homes are important for households with larger families, but the average household size in the United States has been declining since 1960, and household composition has also changed.2
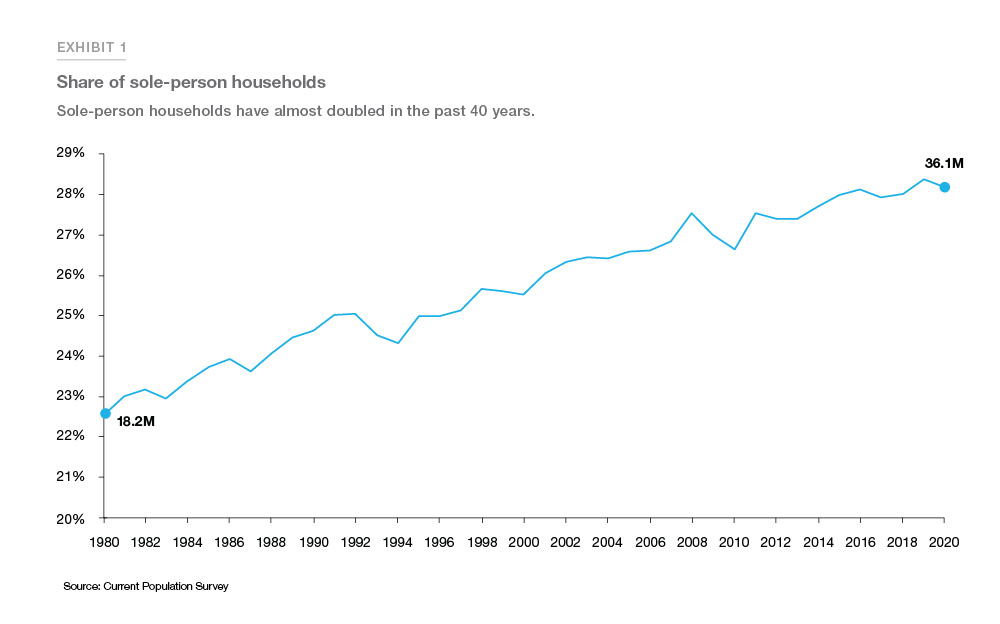
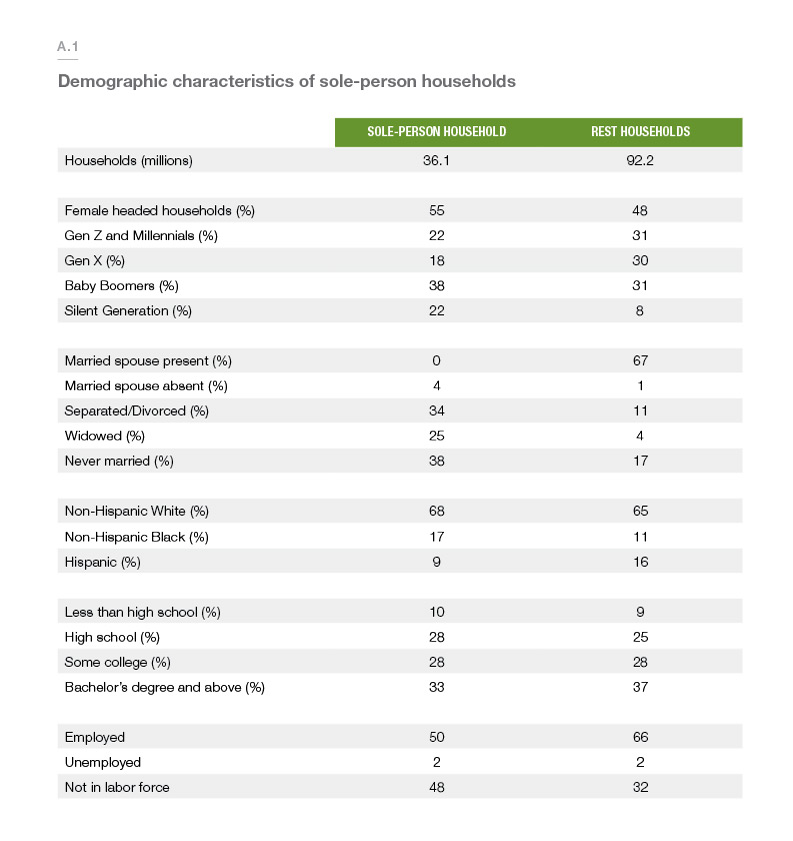
One of the key changes in household composition is the increase in sole-person households.3 In the past 40 years, sole-person households have almost doubled in the United States. According to the 2020 Current Population Survey, 36.1 million households—or 28% of all households—are sole- person (Exhibit 1). For sole-person households, in theory, massive homes may not be suitable from both a size and affordability perspective.
As household composition evolves, will sole-person households continue to increase and should construction also focus on building smaller homes? Understanding the evolution of household composition is particularly important not only to homebuilders but also to realtors and mortgage lenders.
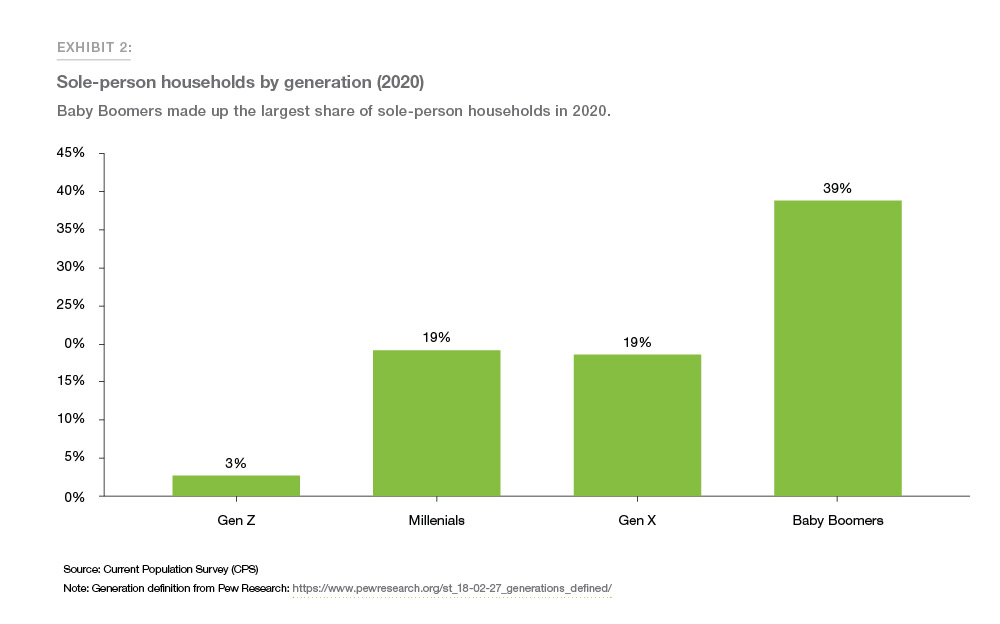
The generational composition of sole-person households as reflected in Exhibit 2 is revealing. Baby Boomers made up 39% of sole-person households in 2020, and their share is likely to rise because of life events such as divorces and deaths of spouse/partners. Millennials made up 19% of all sole- person households. In the next 10 years, this cohort will be in the peak of their family years (like the current Gen X-ers) and thus their share of sole-person households will likely decline. Gen Z-ers, who made up only 3% of sole-person households in 2020, will likely replace Millennials and perhaps remain sole-person households longer due to delayed marriage.4 Gen X-ers (who made up 19% of sole-person households) will begin aging out of their peak family years and slowly move toward becoming sole-person households (like the Baby Boomers).
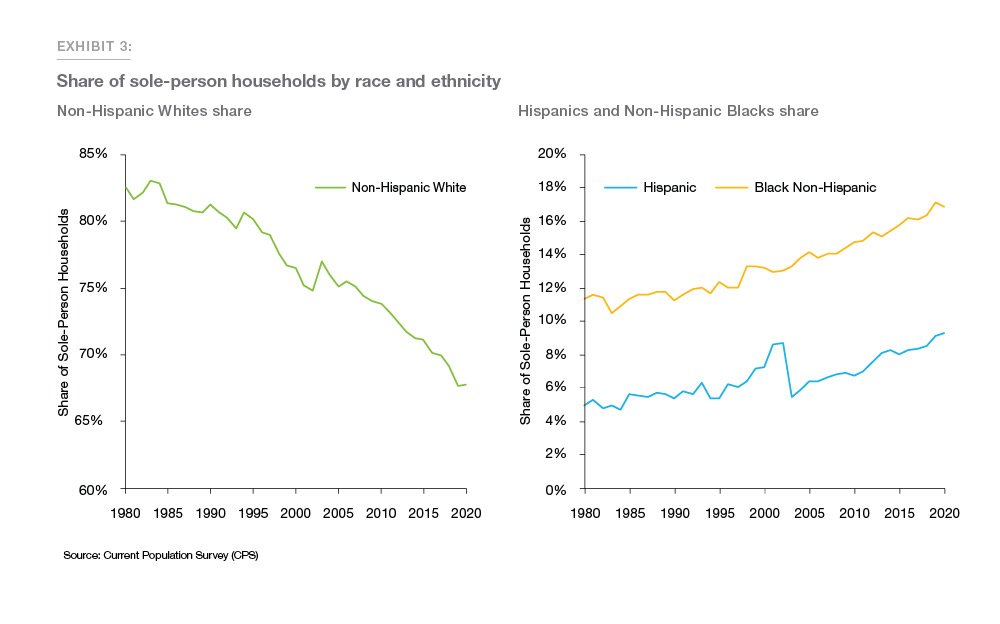
Along with the generational shift, another key factor that will determine the future share of sole- person households is the mix of race and ethnicity. For example, in 2020, non-Hispanic Whites made up 68% of sole-person households, non-Hispanic Blacks made up 17%, Hispanics made up 7%, and the rest were from other races. Over time, while non-Hispanic Whites' share of sole-person households has declined, non-Hispanic Blacks' share has increased. Hispanics' share of sole- person households has remained relatively flat except for a sharp decline between 2007 and 2009 during the Great Recession (Exhibit 3).
In this Research Note, we estimate the future rise or fall in share of sole-person households and determine how that share is impacted by dynamics across generations, race and ethnicity.
Factors that predict sole-person households
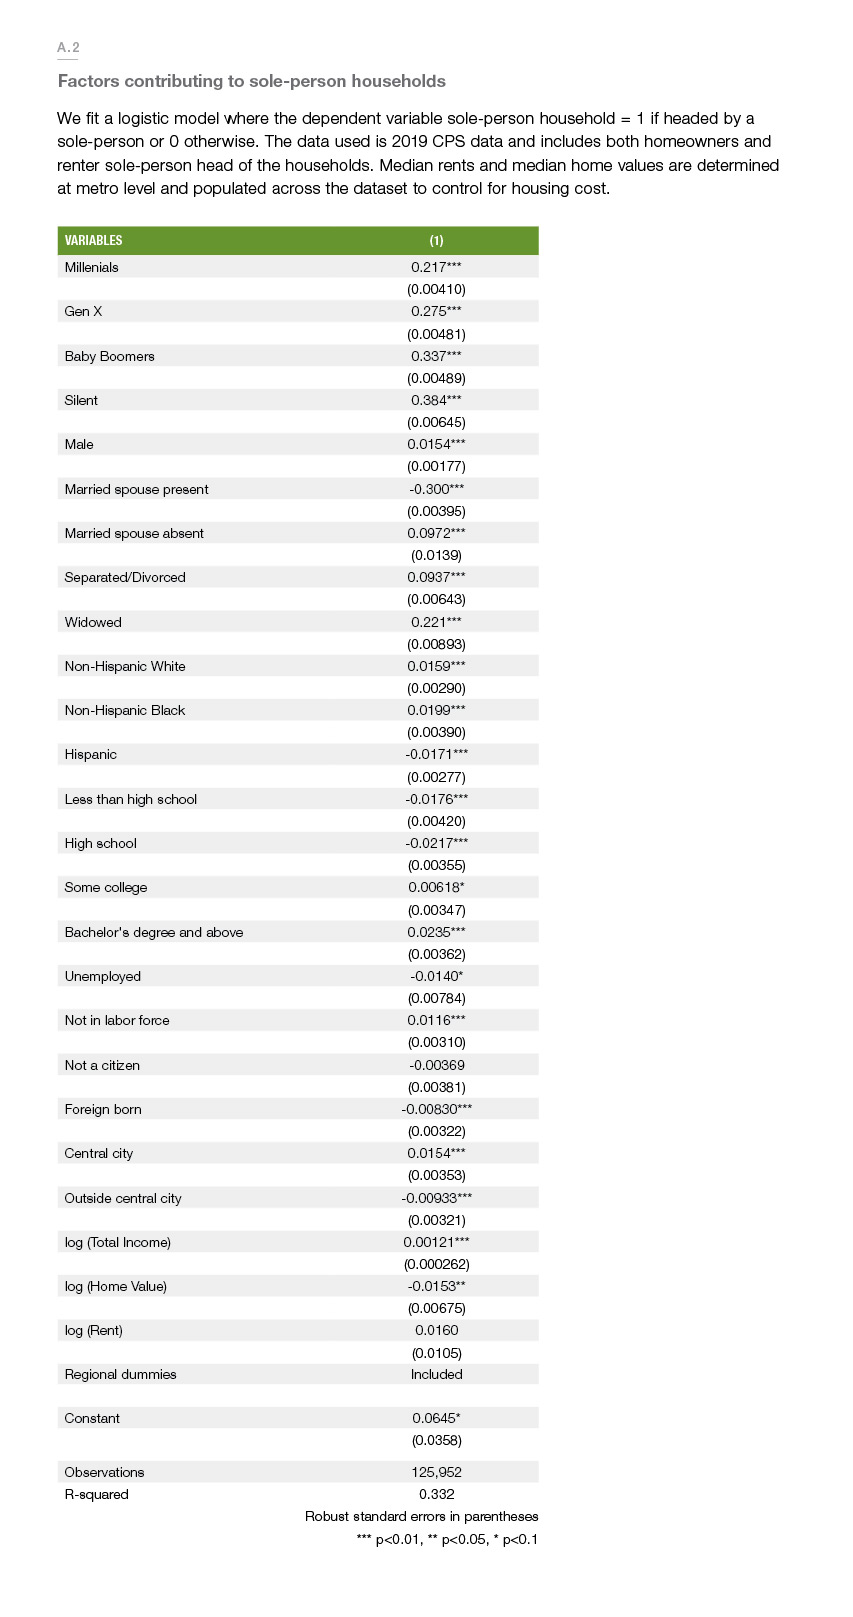
To identify the key factors contributing to the growth in sole-person households, we built a statistical model using person-level records from the Current Population Survey jointly sponsored by the U.S. Census Bureau and U.S. Bureau of Labor Statistics, and made available through the Integrated Public Use Microdata Series (IPUMS). Our statistical model predicted the likelihood of a person living alone in a sole-person household controlling for a variety of factors. Three main demographic characteristics stand out as predictors of sole-person households:
- Age or generation
- Marital status (separated/divorced/widowed)
- Race and ethnicity
Three main predictors of sole-person households are age, marital status, race and ethnicity.
When it comes to sole-person households, there is a trade-off between cost of living and personal space. For Gen Z-ers who may be earning less than those in other generations, doubling up is a cheaper option. After controlling for cost of housing, income, employment status, immigration status, and regional differences, we find that there is an increase in the likelihood of becoming a sole-person household with increasing age. For example, compared to Gen Z-ers, Baby Boomers are 33% more likely to be a sole-person household, and the likelihood decreases for younger generations (see Appendix A.2 for regression results). With increasing age, life events, such as separations or divorces or deaths of spouses/partners, also occur that are other major predictors of sole-person households. For example, widowed individuals are 22% more likely to form sole-person households.
Racial and ethnic differences also have an impact on whether a household is sole-person. For example, Hispanics are 1.7% less likely to live in sole-person households while non-Hispanic Whites and non-Hispanic Blacks are 1.5% and 1.9% more likely to live in a sole-person household relative to other races, respectively.
The future of sole-person households
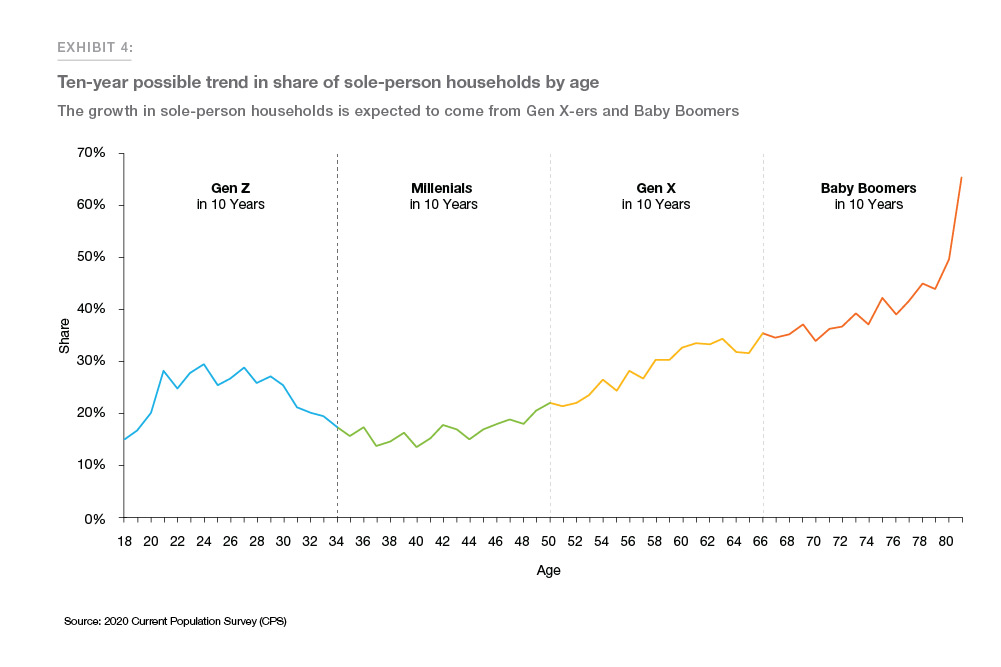
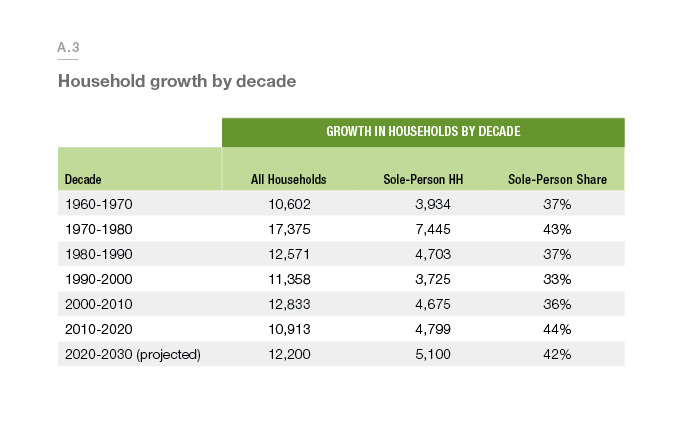
Simply put, household growth is driven by adult population growth and the population's changing age distribution and race and ethnicity mix; that is true for sole-person households as well. In the past decade (2010-2020), 44% of household growth was contributed by sole-person households (see Appendix A.3). What about the next decade? Exhibit 4 shows a possible trend in sole-person household formation that different generations will likely follow in the next ten years assuming the sole-person household share at each age remains constant. For example, if the current relationship between age and the share of the sole-person households continues to hold, sole-person household formation will remain flat for Millennials, while Gen X and Baby Boomers will increasingly form sole-person households.
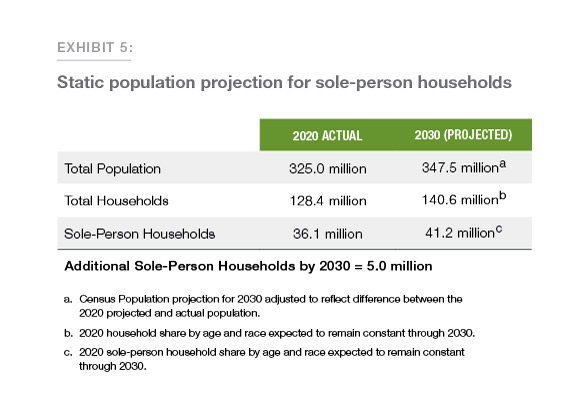
For sole-person household projections, we utilize population projections that the U.S. Census Bureau provides. The population projections, however, were adjusted to account for the discrepancies in the actual and the projected population. For example, the 2020 actual population (325 million) is lower than the projected population (332 million). To account for such a discrepancy, we apply the difference in projected and actual 2020 population by age and race to estimate a new adjusted population projection for 2030.
To project future households, we first calculate the share of the population by age (five age cohorts) and race of the head of the household, the two most important factors contributing to growth in sole-person households. Then, assuming the future household share by age and race remains the same, we multiply the shares with the population projection to arrive at the household projection for each age cohort. To come up with the sole-person households, we multiply the 2020 share of sole-person households by age and race with new projected households. Our calculation suggests that there will be an additional 5 million sole-person households in the United States by the next decade (Exhibit 5).5 This means 42% of the household growth will be contributed by sole-person households, indicating a growing demand for smaller, more affordable homes—which are currently being constructed at near a 50 year low rate.6
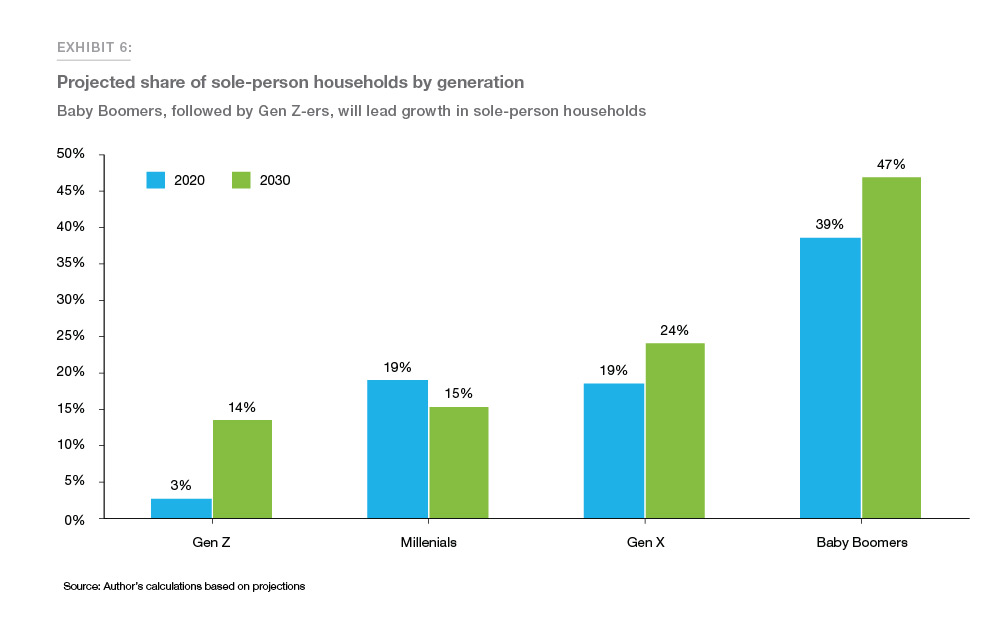
In terms of the generational mix of future sole-person households, by 2030, the current generation's age will increase by 10 years. Adding up all the households formed by the current generations in the next ten years, we find that Gen Z will represent 14% of all sole-person households in 2030—a shift from 3% of sole-person households in 2020. Millennial's share of sole-person households will decrease to 15% from 19% while Gen Xer's and Baby Boomer's shares of sole-person households will increase the most (Exhibit 6).
Conclusion
Our analysis suggests that there will be an additional 5 million sole-person households by 2030, mostly made up of Baby Boomers, followed by Gen Xers. More than 50% of all sole-person households are homeowners today. Sole-person households, in general tend to live in smaller and more affordable homes than a typical homeowner with two or more persons in the household. According to 2019 American Community Survey, around 60% of sole-person households lived in houses with two bedroom or less. The average home value of a sole-person household is 3.8% lower than the home value of a typical homeowner. The rise in sole-person households will certainly have implications for the housing market by increasing the demand for smaller and more affordable homes. Unfortunately, however, housing remains a troubling issue in the United States. Freddie Mac will continue to shine a light on this problem and explore ways to address it.
Appendix
References
1 Characteristics of New Housing
2 Average household size decreased from 3.33 per household in 1960 to 2.53 per household in 2020.
https://www.census.gov/data/tables/time-series/demo/families/households.html
3 Sole-person households are those occupied by one person in the year of the survey.
4 According to the U.S. Census Bureau, in 1980, the median age at first marriage was 23, and in 2020, it was 29.
https://www.census.gov/data/tables/time-series/demo/families/marital.html
5 The Joint Center for Housing Studies projects there will be 4.6 million sole-person households by 2028:
https://www.jchs.harvard.edu/sites/default/files/Harvard_JCHS_McCue_Household_Projections_Rev010319.pdf
6 http://www.freddiemac.com/research/insight/20210507_housing_supply.page
PREPARED BY THE ECONOMIC & HOUSING RESEARCH GROUP
Sam Khater, Chief Economist
Len Kiefer, Deputy Chief Economist
Ajita Atreya, Senior Macroeconomic Housing Economist