


Refinance Trends in the First Half of 2021
Refinance volume continues to be strong in the first half of 2021
Low mortgage rates along with high house price appreciation during the first half of 2021 contributed to a strong mortgage originations market. According to Freddie Mac’s Primary Market Mortgage Survey®, the 30-year fixed-rate mortgage rate averaged 2.9% in the first half of 2021. House prices have risen 19.2% for the first half of 2021 compared to the first half of 2020. In inflation adjusted 2020 dollars, there were about $1.6 trillion in first-lien refinance originations in the first half of 2021. This was a 33% increase in refinance activity compared to the first half of 2020. However, the pace so far this year is still below the pace registered during the refi boom in 2003, when refinance volumes reached $3.9 trillion in inflation adjusted 2020 dollars.
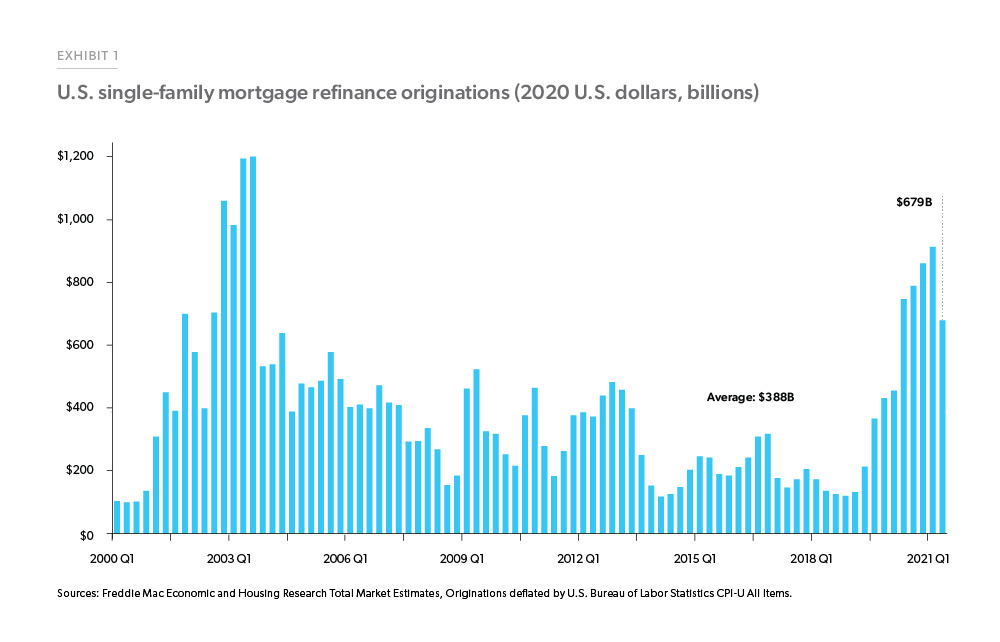
In the first half of 2021, homeowners continued to take advantage of the low mortgage rates and increased home equity to refinance their properties, reducing their monthly payments and extracting equity through cash-out refinances.
Borrowers saved over $2,800 annually in mortgage payments by refinancing
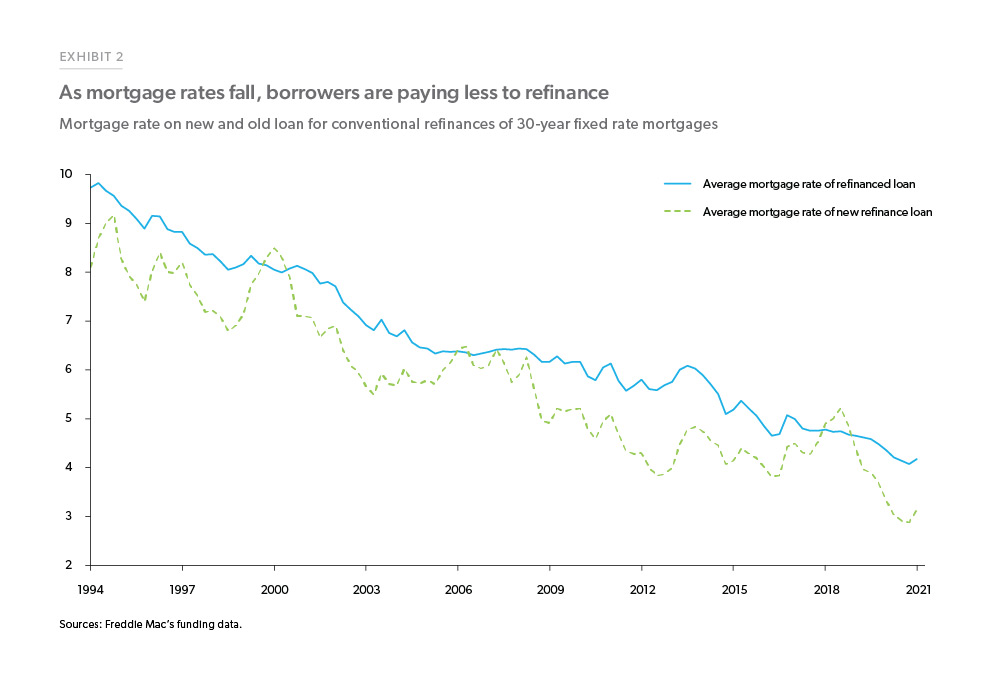
Borrowers who refinanced their first lien mortgages in the first half of 2021 lowered their mortgage rate on average by more than 1.20 percentage points, while for the whole of 2020 borrowers lowered their rate by about 1.15 percentage points. For example, Exhibit 2 compares the average mortgage rate of the loans that were refinanced against the average mortgage rate of the new refinance loans starting from the first quarter of 1994 though the second quarter of 2021.
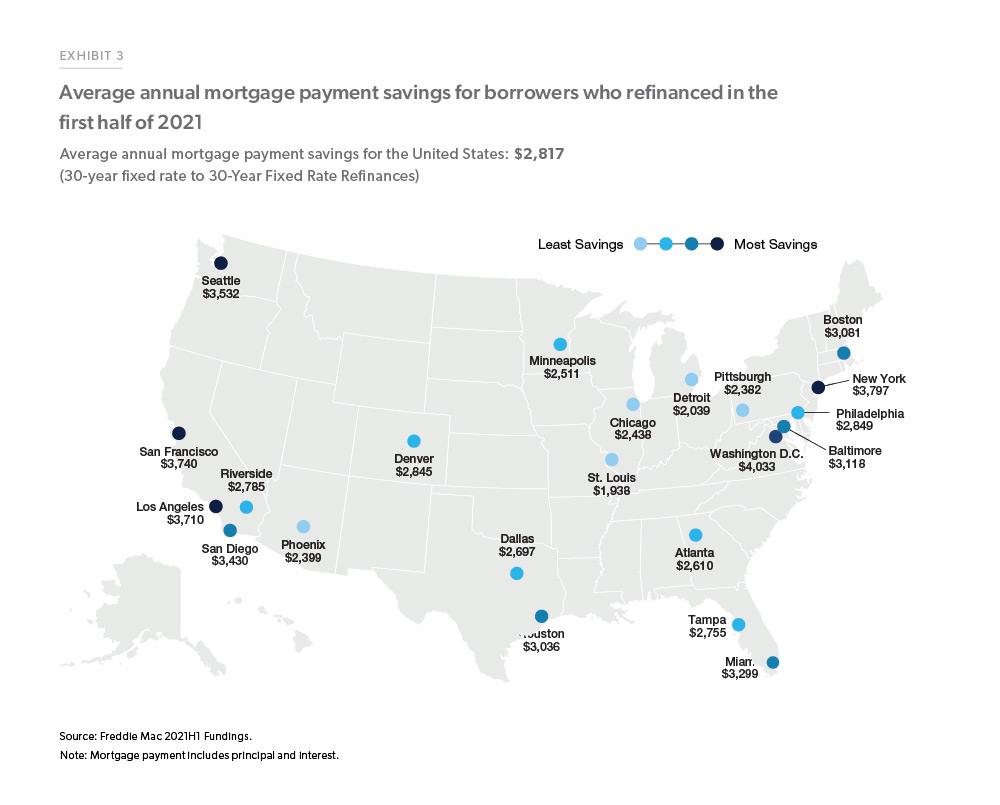
Borrowers who refinanced their 30-year fixed rate mortgage into another 30-year fixed rate mortgage during the first half of 2021 to lower their mortgage rate (non cash-out refinances) saved over $2,800 in mortgage payments (principal and interest) annually. See Exhibit 3 for the average annual savings by major metro area.
Thirty percent of refinance borrowers shortened their loan term when refinancing
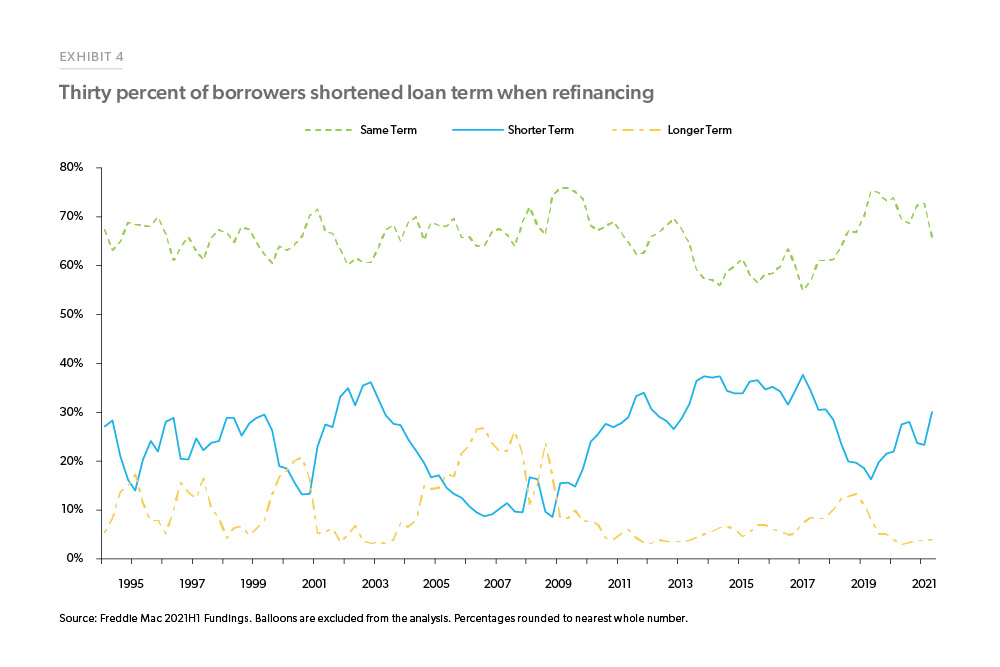
As reflected in Exhibit 4, the share of borrowers shortening their term when refinancing increased in the first half of 2021. For example, of borrowers who refinanced in the second quarter of 2021, 30% shortened their term when refinancing. The difference between the 30-year fixed-rate and 15-year fixed- rate has been increasing during 2021 from about 50 basis point in the beginning of the year to about 70 basis point in June. Borrowers tend to refinance into shorter term products when the mortgage rate difference between the longer- and shorter-term products is larger. In the first quarter of 2014, the share of borrowers shortening their term reached 37% as the difference between the 30-year and 15-year fixed-rate mortgage rate products was 0.96 percentage points. In terms of product distribution, almost 100% of borrowers chose a fixed-rate product regardless of what their original product was.
Refinance borrowers' unpaid principal balance (UPB) and income trends; refinance borrowers' loan amounts and income declined between 2020 and 2021
For loans originated in 2021 and funded by Freddie Mac by August 31, 2021, the average origination loan amount for rate-refinances was $273,520; this was a decrease from an average loan amount of $290,330 in 2020. The average loan amount for cash-out refinances, originated in 2021 and funded by Freddie Mac by August 31, 2021, was slightly over $265,000, up from about $259,400 last year. Exhibit 5 shows the average loan amount of a refinance loan by purpose of the refinance from 2018 through 2021.
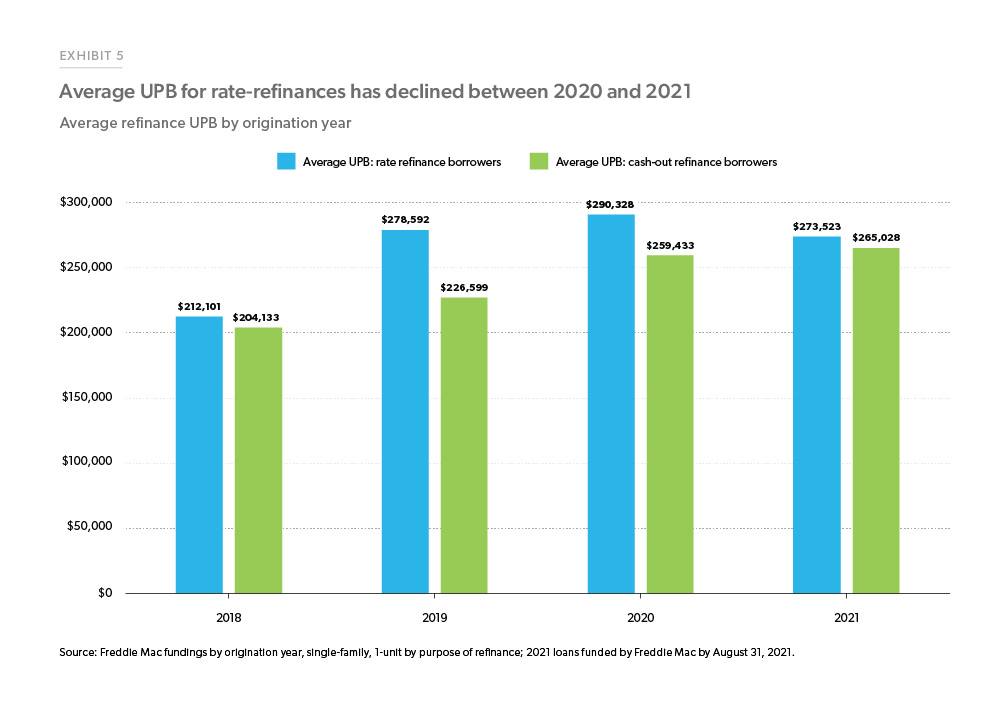
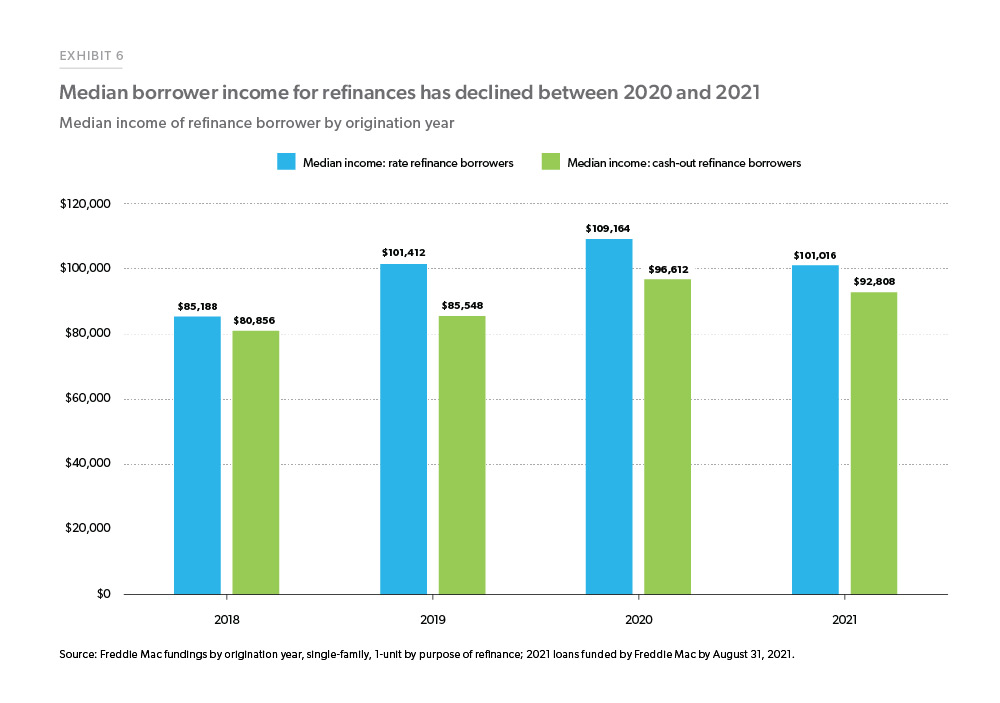
Exhibit 6 shows the borrower’s qualifying income for refinance loans originated from 2018 through 2021. In 2021, the median borrower income declined for both rate-refinances and cash-out refinances. For rate-refinances, the median income decreased about 7% in first half of 2021 as compared to the first half of 2020. The median income of cash-out refinances has declined about 4% during the same period. The decline in borrower income from 2020 to 2021 shows that low-income borrowers, who had been slow to refinance at the start of the pandemic, have begun to take advantage of lower mortgage interest rates and refinance their loans in 2021.
Based on Freddie Mac’s data, the “cash-out” borrowers, those that increased their loan balance by at least 5%, represented 51% of refinance borrowers in the second quarter of 2021—up from 38% during the first quarter of 2021, but still lower than the 89% during the third quarter of 2006. Adjusted for inflation in 2020 dollars, we estimate that $54 billion in net home equity was cashed out during the refinance of conventional prime-credit home mortgages during the second quarter of 2021—down from about $60 billion in the previous quarter, and substantially less than the peak cash-out refinance volume of $108 billion during the second quarter of 2006. The next section provides additional detail on cash- out refinance trends.
Historical trends in refinances, cash-out activity, and payment savings
According to the Financial Accounts of the United States, published by the Federal Reserve Board, aggregate homeowner equity topped $23 trillion as of the second quarter of 2021. That equity has been accumulated without a comparable increase in mortgage debt. Thus, the aggregate ratio of homeowners’ equity to the value of the housing stock has increased to over 67% in the second quarter of 2021, the highest ratio since the late 1980s.
With mortgage interest rates low and homeowners' equity high, it would be natural to expect to see homeowners increase their rate of equity extraction through cash-out refinances or home equity lending. Given the low level of mortgage rates and the option to lock in a fixed rate for 15, 20, or 30 years, cash-out refinances are more attractive for many homeowners today. Indeed, in our data, we see an increase in both the share of refinance mortgages that are for cash-out and the aggregate dollars of equity that borrowers extract conditional on cashing out.
We analyze data of matched refinance transactions funded by Freddie Mac from 1998 through the second quarter of 2021. These data give us insight into refinance trends over a variety of economic conditions and allow us to compare activity today to earlier years. Our dataset links a refinance transaction back to an earlier mortgage (both purchase and refinance) and lets us see how the borrower's income, debt, equity, and house value have changed between transactions. By comparing the outstanding UPB of the refinanced loan to the loan amount on the new mortgage, we can track the amount of equity that was extracted, either through cash or used to consolidate other debt such as second lien mortgages.
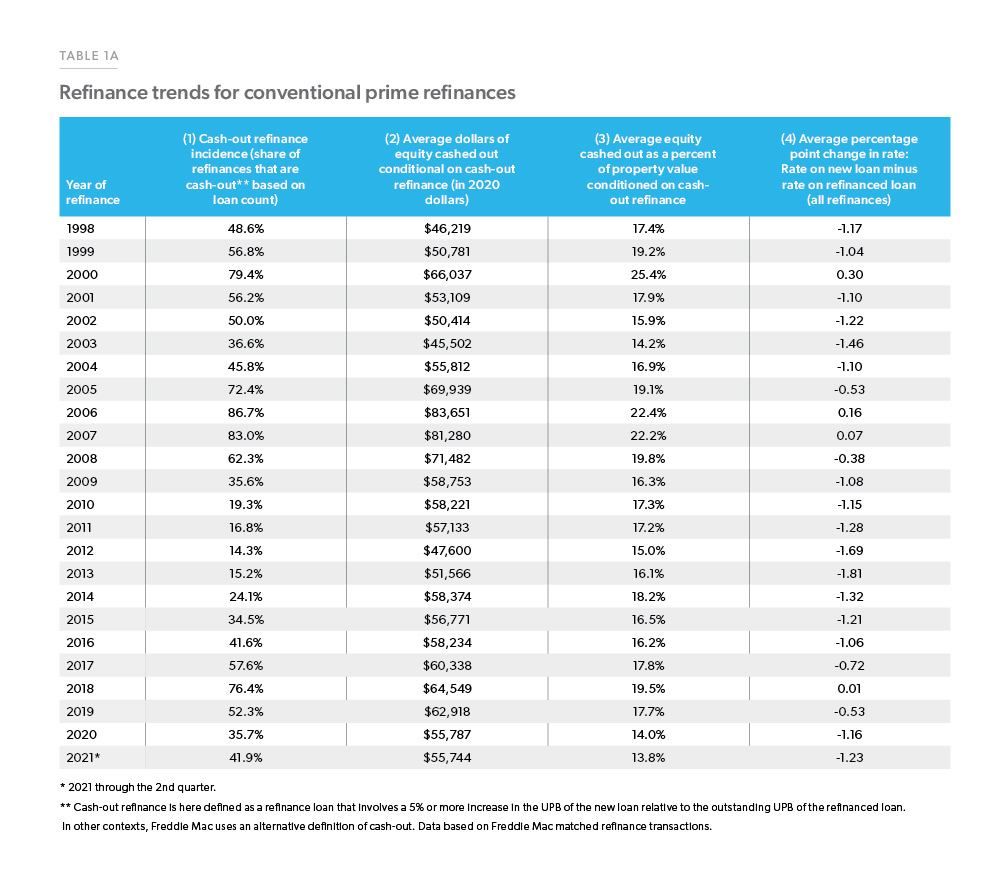
First, we compute summary statistics over time presented in Table 1A. For each quarter of origination, we compute incidence of cash-out; the share of mortgages that involve a cash-out (defined here as a 5% or more increase in the UPB of the new loan relative to the outstanding UPB of the refinanced loan). We also compute the extent of cash-out; conditional on a cash-out refinance how much equity was extracted both as nominal dollars and as a percent of the property value.
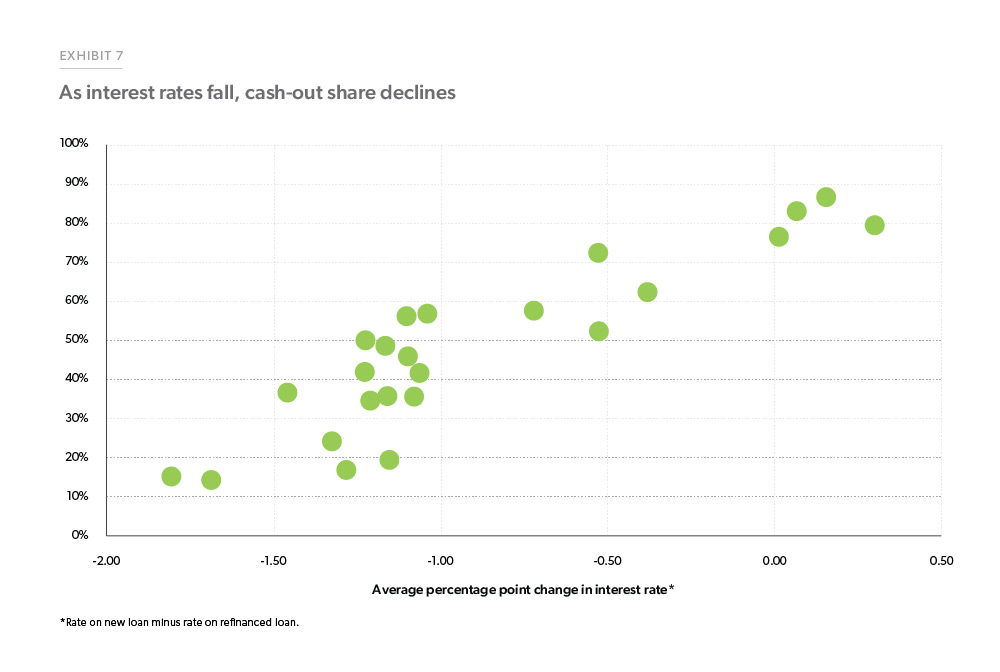
The incidence of cash-out (column 1 of Table 1A) is highly sensitive to mortgage interest rates. In periods where mortgage interest rates are flat or rising (column 4 of Table 1A), relatively few homeowners will engage in a rate term refinance, so the share of cash-out refinances will be high. In periods of declining rates, as more homeowners respond to lower interest rates with a rate term refinance, the share of cash-out refinances will decline. Exhibit 7 shows this relationship by plotting columns (4) and (1) of Table 1A as a scatterplot.
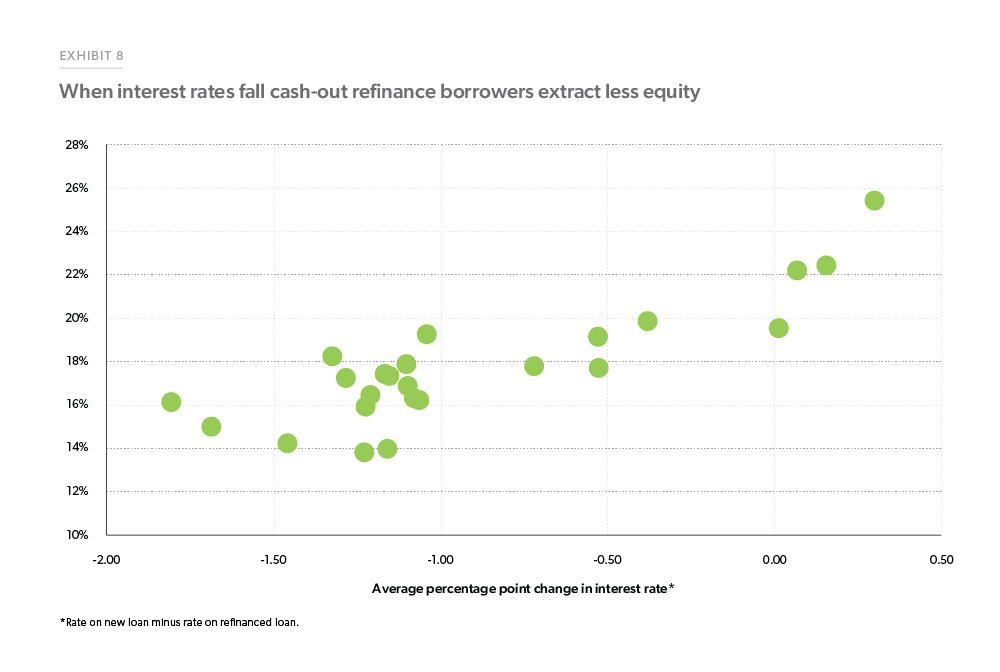
The extent of cash-out is also interest rate sensitive. We can see that most clearly by comparing the average equity cashed out as percent of property value conditional on cash-out refinance column (column 3 in Table 1A) to the average percentage point change in interest rate column (column 4 in Table 1A). These columns are plotted as a scatterplot in Exhibit 8. Like in Exhibit 7 there is a linear relationship between the interest rate reductions refinance borrowers receive and the proportion of their home equity they cash out.
This suggests that as interest rates decline and property values increase, we should expect to see a dramatic increase in both the incidence and extent of cash out. To refine the summary analysis presented in Table 1 and Exhibits 7 and 8, we extend our analysis.
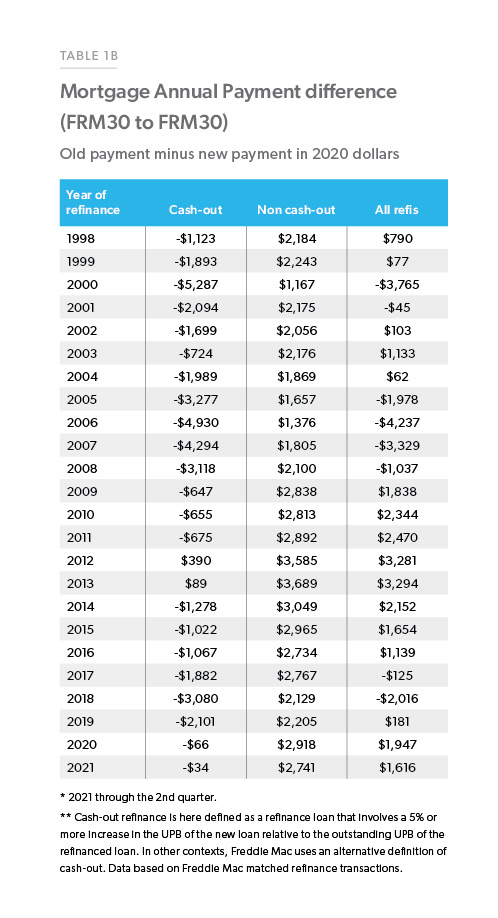
Earlier, we discussed borrowers' annual mortgage payment savings in the first half of 2021 when refinancing a 30-year fixed-rate mortgage into another 30-year fixed-rate product. Table 1B shows the historical annual payment savings, adjusted for inflation in 2020 dollars, when refinancing a 30-year fixed-rate mortgage into another 30-year fixed-rate product. Low mortgage rates in the last decade have enabled many borrowers to refinance and lower their mortgage payments or to extract equity through cash-out refinancing to pay off other higher interest debt.
Conclusion
This report highlights trends in refinancing activity through the first half of 2021. Many borrowers took advantage of low interest rates, saving over $2,800 in mortgage payments annually. Borrowers also took advantage of high house price growth to cash-out equity, but the level of equity extraction remains modest, and as a percent of the property values, equity extraction has trended down. The median income of refinance borrowers in 2021 has declined relative to 2020, indicating that lower-income households are increasingly taking advantage of low interest rates and reducing their payments by refinancing their mortgages.
Prepared by the Economic & Housing Research group