


Grappling with Uncertainty
The U.S. economy is now in its eighth year of expansion and the housing market is coming off its best year in a decade. Prospects remain good for future growth. However, uncertainty weighs on our Outlook for 2017 and 2018. We must grapple with uncertainty about fiscal policy, foreign investments in U.S. real estate, and the size of the mortgage market.
Uncertainty about fiscal policy
After the U.S. presidential election, expectations about economic policy have shifted, particularly expectations about fiscal policy. We still do not know all the parameters of fiscal policy changes, but we assume an expansionary policy will boost both growth and inflation over the next two years and corporate tax reform will increase long-run potential economic growth by about two-tenths of a percentage point.
President Trump’s tax proposals include increasing standard deductions and flattening marginal personal income tax rates. Increasing the standard deduction will reduce the number of households who find it advantageous to itemize deductions. This will reduce the homeownership incentives that comes from the mortgage interest deduction. Changing marginal tax rates shifts the attractiveness for homeownership among those who itemize. The Tax Policy Center estimates the increase in the standard deduction will reduce the number of filers who itemize by 60 percent from 45 million to 27 million.
As an illustrative example, the average monthly cost of owning a $250,000 house financed by a 4.25 percent 30-year fixed-rate mortgage increases by approximately $200/month for a borrower who no longer itemizes deductions.1 Reducing marginal tax rates will also increase the cost of homeownership, but by a smaller amount ($75/month or less, varying by tax bracket).
The extent to which tax policy changes will impact housing is hard to determine. Reducing taxes may boost income and general economic efficiency. But as we illustrated above, shifting tax policy may increase the cost of homeownership. The net impact on housing markets is uncertain.
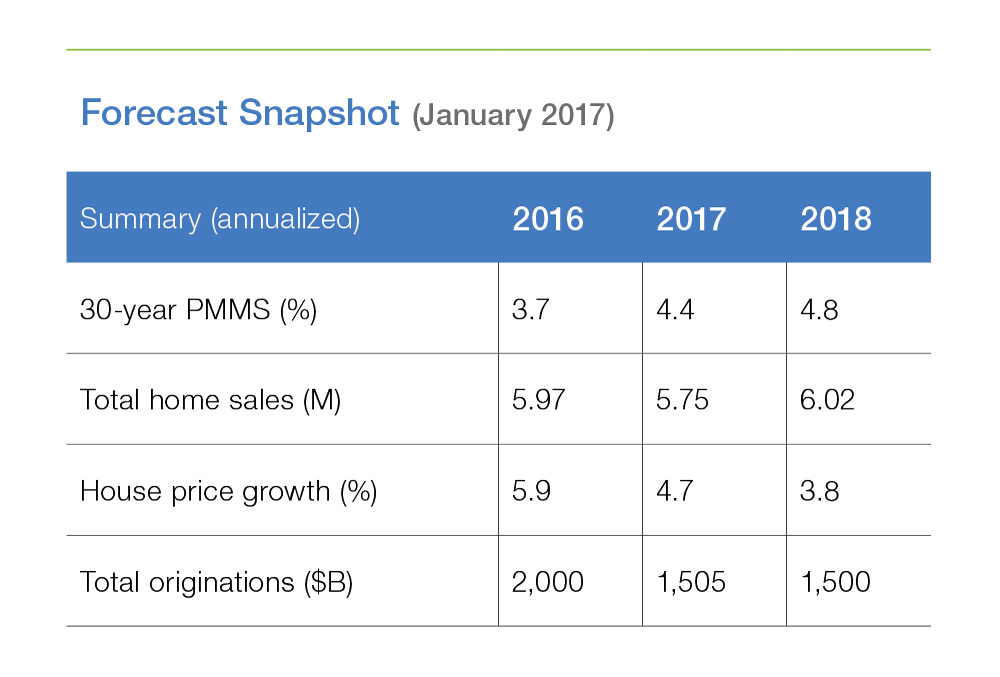
Uncertainty about foreign investments in the U.S. real estate market
Foreign investment accounts for a significant share of business in the U.S. real estate market. According to the National Association of Realtors, foreign buyers purchased over 200,000 residential properties worth about $100 billion in the U.S. from April 2015 to March 2016, a three percent increase over the previous 12-month period (Exhibit 1).
Decisions to invest in U.S. real estate are affected by economic, political, and social factors. For example, foreign exchange rates have helped make U.S. homes more affordable for international buyers in the past, but recent appreciation of the dollar has made U.S. real estate more expensive in many local currencies. It remains to be seen if foreign buyers will still seek to invest in U.S. real estate if the dollar trend continues in the future.
A contraction in foreign demand would have a small impact on many U.S. housing markets, but it would have a significant impact on particular markets that are more reliant on foreign investors. And while foreign buyers purchased property nationwide, 55 percent of the total residential property purchased was concentrated in Florida (22 percent), California (15 percent), Texas (10 percent), Arizona (4 percent), and New York (4 percent). Should foreign demand contract significantly, housing markets in these states would be disproportionately affected.
Uncertainty about the size of the mortgage market
Though mortgage interest rates have fallen throughout the first three weeks of 2017, they are still up from a year ago. Our forecast is for rates to rise throughout 2017, dampening housing and mortgage market activity. See our November 2016 Outlook for an extended discussion of how higher rates are likely to impact housing.
With rising interest rates, we expect mortgage origination volumes to decline in 2017 relative to 2016 and origination volume to stabilize at a lower level in 2018. The decline in overall mortgage activity will be driven by a sharp reduction in refinance activity, which we forecast to fall more than 50 percent from about $1 trillion in 2016 to about $425 billion in 2017.
However, both the size of the contraction and its character are uncertain. We have seen repeatedly in recent years, most recently in 2014, that long-term interest rate increases have been short lived. Tremendous liquidity around the globe, combined with low or even negative long-term interest rates in much of the developed world, has helped to contain U.S. Treasury yields and, with them, mortgage rates.
Upheaval associated with the Brexit vote last June helped to keep rates low throughout the summer. Could we see a repeat in 2017? There are key elections in France, Germany, and the Netherlands this spring that could potentially shock markets like the Brexit vote last year. We don’t know how these elections will go and how bond markets will react, but they have the potential to drive long-term interest rates here in the U.S.
Yet even if rates head higher, we cannot be sure about how much refinance volumes will decline. Certainly rate refinances — refinances undertaken to lower the interest rate — will fall off significantly. According to data from Bloomberg (Exhibit 2), there are $286 billion in outstanding conventional 30-year mortgage-backed securities (MBS) with a coupon greater than 4.5 percent as of December 2016. This figure provides a rough upper bound on the potential rate refinance volume in 2016 from conventional conforming 30-year loans in agency MBS. This $286 billion is far less than the $655 billion we identified last January that were potentially in the money for a rate refinance.

But not all refinance borrowers do so to lower their current rate. Some borrowers opt to extend their loan terms, and many borrowers seek to tap home equity through a cash-out refinance.
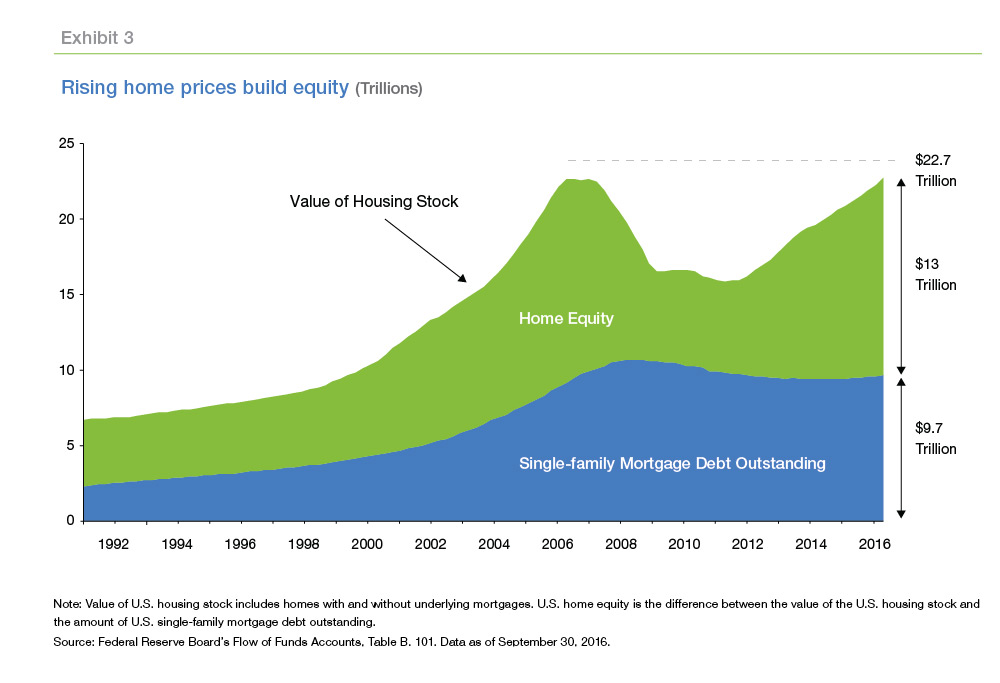
U.S. home prices have risen nationally. As of September 2016, home prices have reached their pre-crisis levels according to Freddie Mac’s House Price Index (FMHPI). Rising home prices helped homeowners build equity; recent data from the Federal Reserve reveals home equity in the U.S. has increased to about $13.0 trillion through the third quarter of 2016, or about $7.0 trillion increase since the second quarter of 2011 (See Exhibit 3).
Homeowners could opt to tap that equity through cash-out refinances in 2017. However, we may not see the same surge in cash-out activity we saw last decade. In recent remarks, New York Federal Reserve Bank President William Dudley commented on evolving consumer behavior. He pointed out how the relationship of home equity and retail spending had shifted in recent years. According to Dudley, unlike in prior periods when house prices rose, much of the home equity of households remained “locked in” their homes. Will some of this “locked in” equity start to free itself in 2017? If it does in the form of cash out refinances, we could see higher origination activity.
However, it is unlikely that cash-out refinance activity will by itself be able to offset the more than $500 billion decline in rate refinance activity we forecast. In 2015, we estimate there were only $65 billion in total combined cash-out and second mortgage consolidations. That figure is up from a low of $42 billion in 2014, but far below the $348 billion we estimate for 2006. Even if cash-out refinance activity was to double from 2015 levels, it would only replace 11 percent of the reduction in rate refinance activity.
We might also see an increase in borrowers opting to refinance out of a fixed-rate product and into adjustable-rate products. Recently, with near historic low interest rates, many borrowers have locked in a fixed-rate mortgage. For example, according to Freddie Mac’s Refinance Statistics, of borrowers who refinanced in the third quarter of 2016, less than 1 percent refinanced their fixed-rate mortgage into an adjustable rate mortgage. But in periods of rising rates, that share has tended to rise. In 1994, interest rates experienced a sharp and sustained increase. In the last quarter of 1994, about 25 percent of borrowers refinanced their fixed-rate mortgage into an adjustable one.
If long-term interest rates rise as we forecast, we may begin to see borrowers choose adjustable-rate mortgage (ARM) products. Some borrowers may find they can save on payments despite higher rates by refinancing a fixed-rate loan into an ARM. 2Additionally, many borrowers with ARMs choose to refinance when their ARM resets. However, after years of low rates and many borrowers refinancing into fixed products, the number of ARM resets are the lowest in well over 10 years according to Black Knight’s November 2016 Mortgage Monitor.
While cash-outs and ARMs will provide some offsetting originations, overall mortgage refinance activity is set to decline significantly in 2017. Our forecast of $425 billion in refinance originations would be the lowest annual total since 2000, not adjusting for inflation. We could be surprised with lower than expected rates in 2017, or “locked in” home equity could drive a surge in additional refinance activity. However, among the many uncertainties we highlighted, a smaller mortgage market in 2017 than 2016 seems most certain.
1 These calculations are based on estimated owner costs under the following assumptions: a period of 7 years (home is sold at the end of 7 years for owners); rent of $1,200 per month with 1.3 percent annual renter’s insurance and annual rent growth of 2.2 percent; a house price of $250,000 financed with a 30-year fixed mortgage at 4.25 percent; annual property taxes of 1.1 percent of the home’s value; annual homeowners’ insurance of 0.5 percent of the home’s value; utilities of $100 per month, growing at a rate of 2 percent per year; house prices growing at 2.2 percent per year; 4 percent ($10,000) in transactions costs upon purchase; and 8 percent in transaction costs upon sale. Future cash flows are discounted at an annual rate of 3.5 percent. Owners can deduct the interest portion of monthly payments at the rate indicated in the table, and we assume that the homeowner pays only their scheduled monthly payment (no curtailment). We assume that there are no capital gains taxes due on sale (there’s an exemption for up to $500,000, and under our scenario capital gains are less).
2 As of January 19, 2017, average 5/1 Treasury-indexed ARM rates were 0.88 percentage points lower than 30-year fixed rate mortgages. Refinancing a $200,000 30-year fixed rate mortgage at 4.09 percent into a 5/1 ARM at 3.21 percent would save about $100 per month in initial monthly payments. Extending the term at refinance, for example re-amortizing a loan with 27 years remaining into a 30-year loan, would grant additional monthly payment savings. Borrowers who are payment sensitive may still find refinancing attractive with higher overall rates and may choose an ARM for additional initial payment savings.