


Will the New Tax Bill Dampen the Industry?
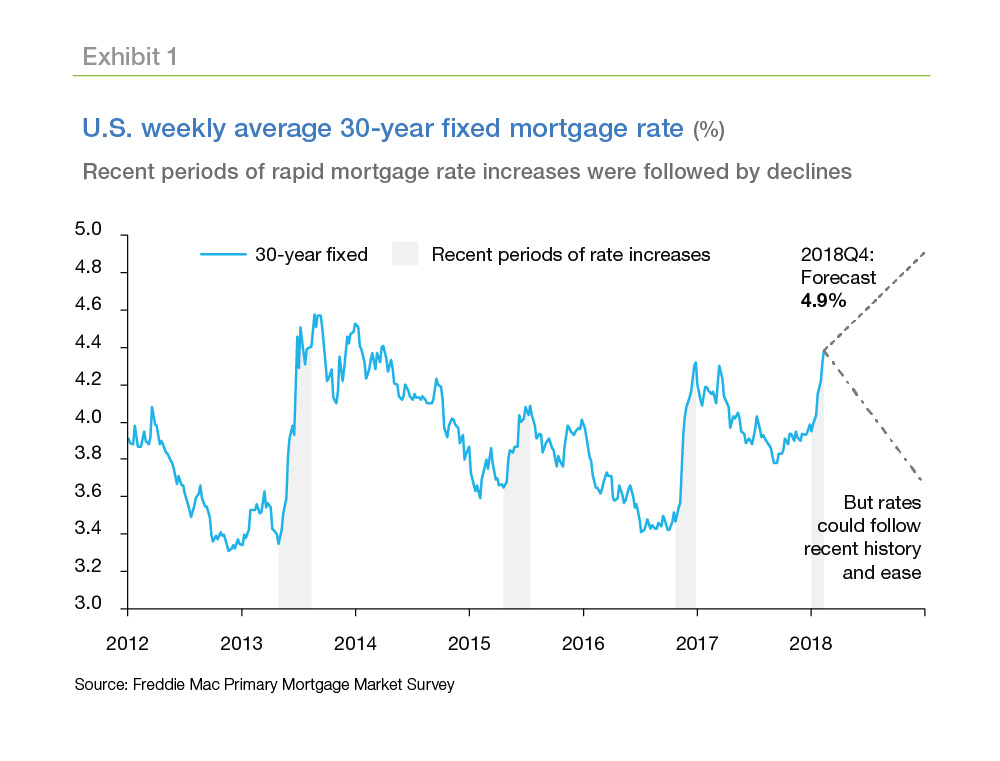
Mortgage rates entered 2018 below four percent for the 30-year fixed rate mortgage, but have been surging through the first two months of this year, following the 10-year U.S. Treasury yields higher. The 10-year Treasury reached its highest level since January 2014 in recent weeks. As of February 22, the rate on the latest U.S. weekly average 30-year fixed mortgage rate was 4.40 percent, up 0.45 percentage points since the start of the year. Over the past few years, we’ve had episodes (the Taper Tantrum in the spring of 2013, the summer of 2015, and following the U.S. election in the fall of 2016) where mortgage rates surged over four percent, only to fade off their local peaks back below 4 percent (Exhibit 1). But perhaps things will be different this time and rates might sustain their upward trend.
Refinancing Activity
According to Freddie Mac’s Quarterly Refinance Statistics, in the fourth quarter of 2017, “Cash–out” borrowers – those that increased their loan balance by at least five percent – represented 63 percent of all refinance loans. This was up from 44 percent a year earlier, but still lower than the 89 percent registered in the third quarter of 2006. Adjusted for inflation in 2017 dollars, in the fourth quarter, an estimated $14.8 billion in net home equity was cashed out during the refinance of conventional prime-credit home mortgages, down from $19.0 billion a year earlier and substantially less than the peak cash-out refinance volume of $102.3 billion during the second quarter of 2006.
Borrowers who refinanced their first lien mortgage in the last quarter of 2017 reduced their interest rates about 65 basis points on average, down from about 105 basis points at the end of 2016 and much lower than the almost 190 basis points reduction during the second quarter of 2013.
Many of the refinances during the last quarter of 2017 were not for rate reduction, but rather for cashing out equity in order to consolidate other higher interest debt or pay other bills or for home improvements. The average dollar volume cashed out in the last few quarters is about $55,000 on average, 10 percent smaller compared to the 2006 and 2007 peak cash-out periods (not adjusted for inflation).
Two factors related to domestic U.S. economic policy have contributed to the recent rate increases and increase the likelihood that recent rate increases stick. On the monetary policy front, the Federal Reserve Open Market Committee has begun raising its benchmark federal funds rate while also working to unwind its large portfolio of long-term assets. On the Fiscal Policy side, the Tax Cuts and Jobs Act of 2017 lowered taxes, while recent budget proposals laid the groundwork for a surge in deficit-financed government spending. Monetary and fiscal policy are working together to drive interest rates higher.
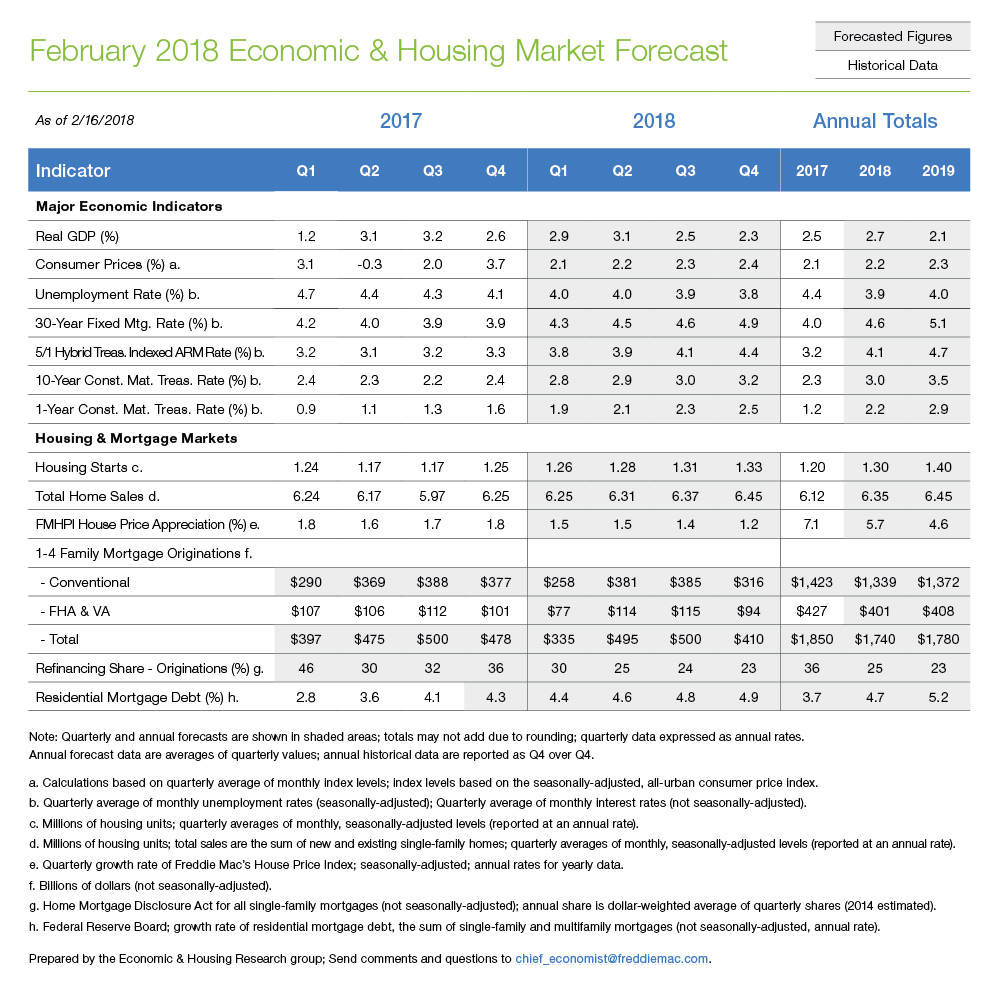
If rising rates are accompanied by a strong labor market and rising incomes, U.S. housing markets should show modest growth in 2018 and 2019. This expectation is reflected in our latest forecast. While existing home sales may struggle to top their best-in-over-a- decade 2017 performance, new home sales should provide enough growth to push total home sales in the U.S. modestly higher in 2018. Housing construction continues to lag demand by a wide margin, so we expect to see housing starts grind higher in 2018. House prices have also been accelerating. The most recent release of the Freddie Mac House Price Index shows U.S. house prices increased 7.1% from December 2016 to December 2017. With construction ramping up slowly to meet demand, house prices should continue to increase, though the pace of growth may moderate as higher interest rates pinch affordability and the tax bill shifts the balance between buy and rent.
How will the Tax Cuts and Jobs Act of 2017 affect home prices?
Last month we gave you a high–level overview of the effect of the Tax Cuts and Jobs Act of 2017. Let’s explore the implications of the tax bill on housing markets in more detail.
Consider two families, the Smiths and the Johnsons, who are in the market to buy a house. The Smiths are a median-income family of three from Mississippi while the Johnsons are a high–income family of three from New Jersey. Exhibit 2 provides a summary of the various payments and taxes they would face if they buy a home which is valued at four times their income.1
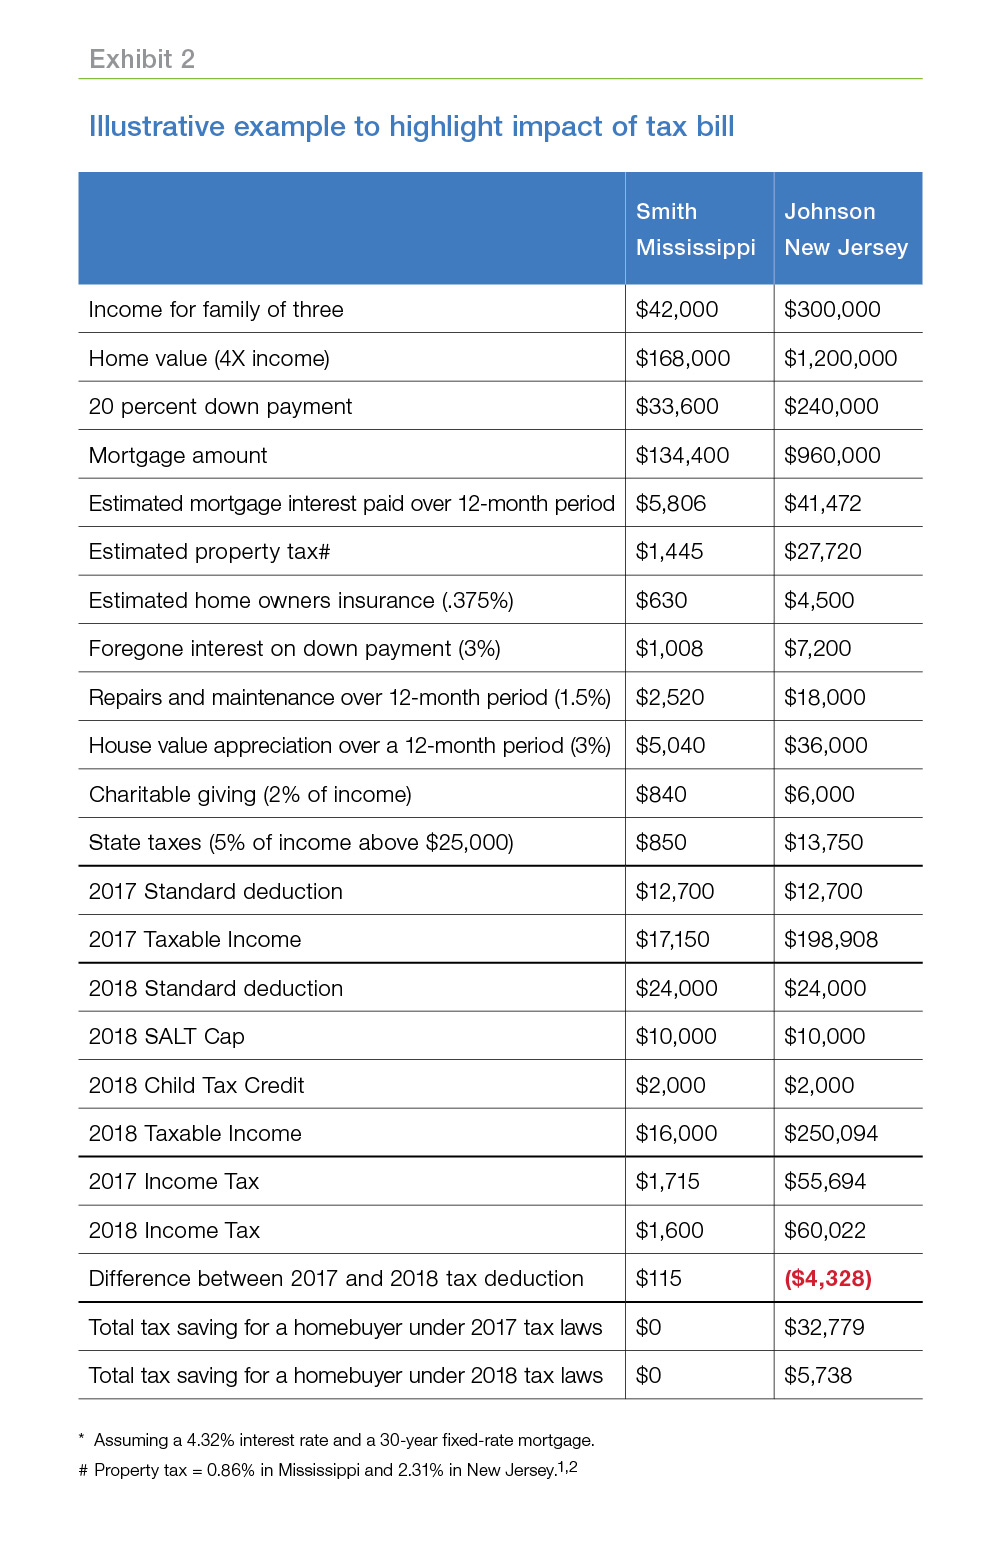
Exhibit 2 shows that the change in the tax laws would have little impact on the Smith's taxable income and thereby does not stand in the way of their homeownership decision. On the other hand, for the Johnsons, who were itemizing their deductions, the impact of the tax reform would be much higher.4 Their taxable income would go up by around $50,000, due to the cap on the deductibility of state and local taxes. The new reduced tax rates and child tax credit will not offset the increase in taxable income. The tax saving for the Johnsons for owning a home in New Jersey would go down from $33,000 to $5,000 under the new tax bill as compared to the earlier one. They might put off buying a home for longer than they would have if tax reform had not been undertaken.
Let's suppose that the entire amount of tax savings lost under the change in tax law directly lowered home prices by the same amount of tax savings lost. In that case, the reduction in house prices would be less than a one percentage point decline for the Johnsons' market. And most parts of the country would have a much lower impact. This is a specific example to show how tax reform would impact house prices. We can generalize the Smith and Johnson cases using a simplified version of the user cost equation, expressed as follows:
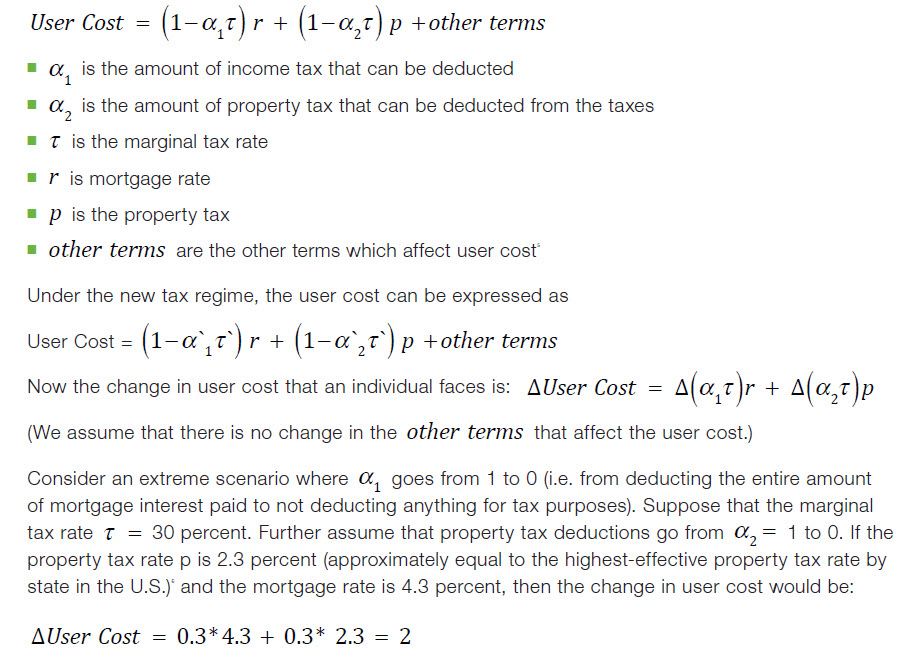
This means that there is a two-percentage point increase in the user cost in this hypothetical scenario. In economic models, households compare the user cost of housing with a rental alternative. If rents remain unchanged, then house prices may fall to reflect the decline in user cost. This implies that the maximum direct impact of the tax reform on house prices would be around two percentage points.
Of course, this is a simplified version. In the real world, the deduction taken and the marginal tax rate components of the user cost are complicated functions which depend on many factors. But even for those who do not deduct their property taxes from their income, there is a direct impact on user cost if mortgage interest rates increase. Any increase in the mortgage rates would affect all sections of the population and not only those who benefit from the deductions. Our analysis confirms that the direct impact of the tax bill will be limited in terms of national house prices. Certain markets with higher average incomes (and thus more households likely to itemize deductions) and property tax rates may see larger direct impacts on house prices ranging as high as around two percentage points. But the largest effect will come through higher mortgage rates, which impacts all households.
The recent increases in the mortgage rate would increase user costs of homeownership and offset gains in after-tax income due to reduced income taxes. The rate increases along with house price increases are sure to weigh on affordability, particularly of first-time homebuyers. However, amidst robust economic growth and pent-up demand for housing, we remain optimistic about the U.S. housing market in 2018 as reflected in our latest forecast.
PREPARED BY THE ECONOMIC & HOUSING RESEARCH GROUP
http://www.freddiemac.com/research
1 The methodology for this exercise has been adopted from Edward Golding, Urban Institute study. https://www.urban.org/urban-wire/many-tax-reform-will-make-renting-more-attractive-owning-home
2 http://realtormag.realtor.org/ daily-news/2017/04/06/10-states- highest-property-tax-rates
4 According to a study by Zillow, only around 14 percent of homes in the U.S. are worthy enough for a new homebuyer to benefit from itemizing deductions; down from 44 percent under the previous tax regime.