


U.S. Economic, Housing and Mortgage Market Outlook – March 2024
In this Issue
- While the U.S. economy remains robust, inflation pressure continues, which could keep mortgage rates higher for longer.
- Home sales ticked up slightly because of lower mortgage rates in January. However, inventory remains tight and the rate lock effect has been a key barrier to home sale volumes.
- Homeowners’ insurance costs are growing but are a small fraction compared to the mortgage principal and interest payments. MORE
Recent developments
U.S. economy: U.S. economic growth remained solid at 3.2% in Q4 2023 as per Bureau of Economic Analysis’ second estimate of GDP. While this is slightly lower than the Q3 growth of 4.9%, it remains above estimates of long-term potential growth. The slowdown in growth reflects a downturn in private inventory investment and federal government spending. However, consumption spending remained a key component in growth, contributing two percentage points to the overall growth. Government spending increased 4.2% over Q4 compared to the 5.8% increase in Q3 and private investment increased 0.9% over Q4 compared to the 10.0% increase in Q3. Residential investment remained positive but slowed down from the 6.7% quarter-over-quarter increase in Q3 to 2.9% in Q4 2023. As of writing, the latest nowcasts for Q1 2024 GDP growth from the New York Federal Reserve Bank1 and the Atlanta Federal Reserve Bank2 are tracking 2.1% and 2.5% respectively. In total these estimates point to an economy that continues to expand, but at a moderating pace.
The labor market remains resilient with nonfarm payroll employment increasing by 275,000 in February 2024. Total nonfarm payroll for December 2023 and January 2024 were revised down by a combined 167,000 jobs. But, even with the downward revisions, the economy still added an average of 252,000 jobs in the last two months.3 The unemployment rate ticked up to 3.9% in February, up 0.2 percentage points from January. While this is the highest level of unemployment rate since January 2022, it remains below 4% for the twenty-fifth consecutive month, the longest streak since the 1960s.
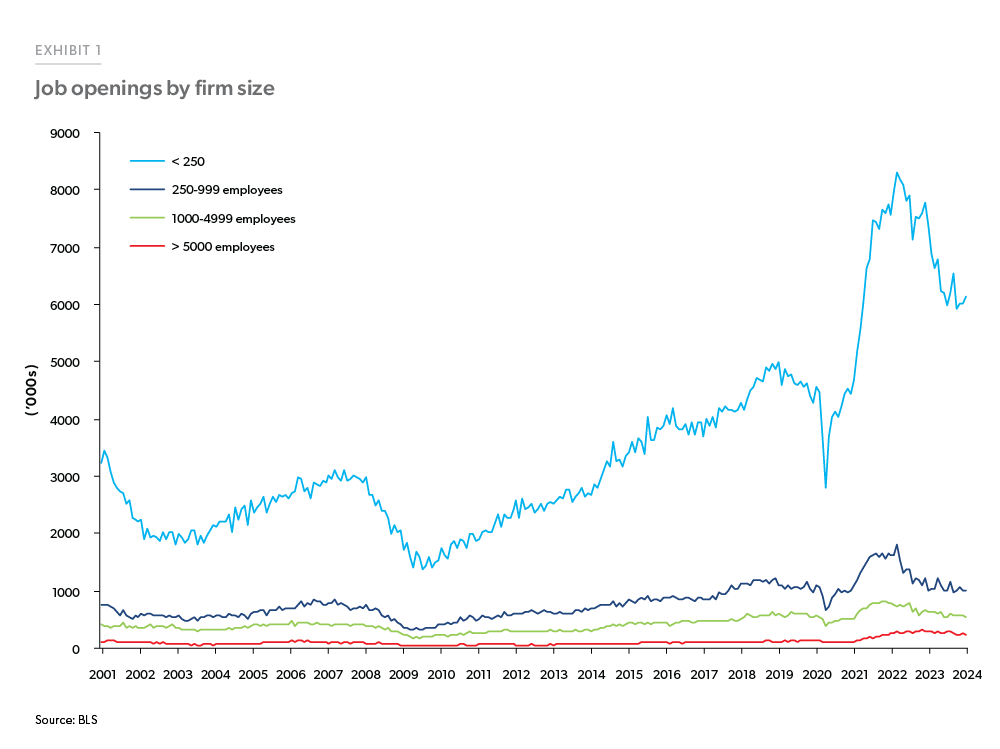
Job openings remained steady at around 8.9 million in January 2024, according to the Bureau of Labor Statistics (BLS) Job Openings and Labor Turnover Survey (JOLTS). The ratio of job openings to unemployed, a metric that the Federal Reserve has been tracking to gauge the strength of the labor market, changed little at 1.45 in January, up from 1.42 in December 2023 indicating more job openings than unemployed. Historically, smaller firms (<250 employees) have generated more jobs (Exhibit 1). Post the pandemic, with technological advancements and increase in remote work, there has been tremendous growth in small businesses adding more labor demand by smaller firms.4 However, small businesses have been struggling to fill open positions as per the National Federation of Independent Business (NFIB). As of January 2024, 39% of all owners reported job openings they could not fill.5
Enlarge Image
Inflation as measured by the price index for Personal Consumption Expenditures (PCE) excluding food and energy rose 2.8% year-over-year in January 2024 and remains at its lowest level since early 2021. So called “supercore” inflation—measured with the PCE price index excluding food, energy and housing—another metric that the Federal Reserve started tracking to gauge progress on inflation, picked up again in January 2024 with 3.5% year-over-year growth after cooling in December. While inflation has been moderating, the overall level of inflation remains above the Federal Reserve target and there is a risk that progress could halt or reverse, which may increase the amount of time before the Federal Reserve’s next rate cut.
Overall, the U.S. economy continues to follow the path it has been on in recent months. Economic growth remains robust, job growth is also strong, and inflation, while moderating, remains elevated relative to the Federal Reserve’s long-run target.
U.S. housing and mortgage market: The drop in mortgage rates from an average of 7.4% in November 2023 to an average of 6.8% and 6.6% in December 2023 and January 2024, respectively helped home sales recover from the lows of 2023. Total (existing + new) home sales for January 2024 were at 4.66 million, up 2.9% from December 2023 but were down 1.2% from January 2023. Existing home sales grew 3.1% from December 2023 to 4.0 million in January, the largest monthly gain in a year. While month-over-month existing sales increased, they are still 1.7% below the levels of January 2023. The existing housing inventory in January 2024 increased slightly by 2% from December 2023 and was at 1.01 million units representing 3.0 months of supply at the current monthly sales pace. The median price was $379,100, up 5.1% from last year. This increase contributes to the ongoing affordability struggle in the housing market. Affordability is at a nearly 30-year low which is keeping many potential homebuyers on the sidelines.
New home sales for January 2024 were at 661,000, 1.5% above December 2023 sales. With affordability becoming increasingly challenging, 62% of builders reported providing sales incentives in January while 25% reported price cutting according to National Association of Home Builders (NAHB).6 Housing starts were down 14.8% from December 2023.7 The decline was largely due to a 35.8% decline in the multifamily unit construction.
Home prices continue to exhibit strength. The FHFA Purchase-Only Home Price Index for December 2023 rose 0.1% month-over-month compared to 0.4% in November 2023 and was up 6.6% year-over-year. Despite the deceleration in December, house prices continue to outpace overall consumer prices.
Mortgage rates resumed their upward trajectory in February and averaged 6.8% for the month, as measured by Freddie Mac’s Primary Mortgage Market Survey®. This increase was mainly due to the stronger than expected inflation measures with the markets pushing out the expectation of the Fed pivot to the second half of the year. Mortgage activity declined over the month on these higher rates. Overall activity was down 8.8% year-overyear on average in February. Refinance activity was up 2.9% as compared to last year and purchase applications were down 13.7% year-over-year.8
Banks, on balance, reported tightening lending standards for most loan categories during Q4 2023, according to the Federal Reserve Board’s Senior Loan Officer Opinion Survey on Bank Lending Practices (SLOOS).9 For commercial and industrial (C&I) loans as well as for all commercial real estate (CRE) loans, banks reported tighter standards and weaker demand during Q4 2023. Banks also reported tighter lending standards and weaker demand for all categories of residential real estate (RRE) loan categories, with the exception of government residential mortgages and government-sponsored enterprise (GSE) eligible residential mortgages. Regarding banks’ future expectations, they are expecting the lending standards to tighten for CRE, credit card and auto loans but for C&I and RRE loans, they expect lending standards to remain unchanged. Banks also reported that they are expecting a deterioration in credit quality—as measured by delinquencies and chargeoffs- across most loan types over 2024.
To summarize, the stability in rates brought back some activity into the housing market in January, with increases in existing and new home sales. However, tight inventory is still a key barrier to home sale volumes.
Outlook
The U.S. economic outlook remains broadly positive. We continue to expect modest economic growth, albeit at a slower pace than the previous year, resulting in moderating payroll employment growth and a modest uptick in the unemployment rate. While we expect inflation to eventually moderate, in the short run, a growing economy will keep inflation above the 2% target level. Therefore, we expect the Federal Reserve to not cut rates until the summer at the earliest and potential upside surprises on inflation could push rate cuts out even further. As a result, treasury yields will remain elevated in the near term, keeping mortgage rates elevated. We forecast mortgage rates to stay above 6.5% through this quarter and next.
The housing market remains challenged due to high mortgage rates and a lack of inventory for sale. However, we expect a modest recovery in home sales as mortgage rates drift down in the latter half of the year which is under a scenario where inflation moves closer to the target, prompting the Federal Reserve to cut the federal funds rate. The recovery, however, will be limited as the rate lock effect will prevent homes from coming on the market. We expect upward pressure on home prices to remain as more first-time homebuyers continue to flood the housing market that is plagued by a lack of supply. As a result, we forecast home prices to increase 2.5% in 2024 and 2.1% 2025.
Under our baseline scenario, we expect the dollar volume of purchase origination to improve modestly in 2024 and 2025. Despite firm price growth, our view on originations is subdued since a modest recovery in home sales coupled with a rising share of cash purchases will restrict purchase origination volumes from growing significantly. Although we expect mortgage rates to drift down, there will be limited refinance activity as many homeowners have locked in historically low mortgage rates and the incentive to refinance is close to non-existent for a large share of homeowners. Together, we expect total mortgage origination to remain low through most of 2024 but start to increase at the end of the year and see modest increases in 2025.
While our outlook remains optimistic, caution is warranted considering the fight against stubborn inflation may drag on longer. And if the expectation of deteriorating credit quality is realized, it could be detrimental to housing demand, however we do not expect any major negative credit event under our baseline scenario.
MARCH 2024 SPOTLIGHT:
The cost of homeowners’ insurance
The cost of homeownership has risen significantly in recent years. This is largely driven by high mortgage payments fueled by elevated mortgage rates, but homeowners’ (HO) insurance costs also have a part to play – although at a smaller scale compared to mortgage principal and interest payments. HO insurance provides financial protection against physical damage to a property.10 As such, it helps safeguard home values, especially in the event of large, unexpected losses resulting from natural disasters such as tornadoes, hurricanes and wildfires. However, as a recurring cost of owning a home, albeit a relatively smaller component, surging insurance premiums could add extra cost burdens on many households in this high borrowing cost environment. Using data from Uniform Closing Database (UCD)11 we estimate the cost of HO insurance over time and across the U.S.
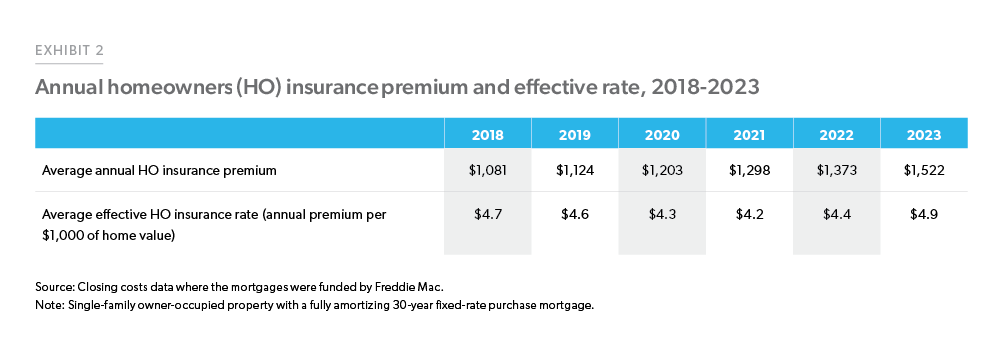
Based on our estimates, the average annual HO insurance premium (without adjustment) was $1,081 in 2018 among Freddie Mac borrowers for a single-family owner-occupied home with a conventional 30-year fixed-rate mortgage. By 2023, the average borrower had to pay an annual premium of $1,522, which was 10.8% higher than in 2022, and 40.8% higher than in 2018 (Exhibit 2).
Over the last five years, the value of homes owned by Freddie Mac borrowers, and therefore the value insured by HO insurance policies, has also changed. To facilitate comparison, we calculated the effective rate paid by each borrower by scaling the annual HO insurance premium over the home value. Note that the value of a home also includes the value of the land it sits on. Therefore, the actual effective HO insurance rates paid by policyholders are likely to be higher than our estimates, considering that HO insurance premiums are set based on the cost of rebuilding the home.
On average, the effective HO insurance rates have remained fairly stable. In 2023, the average borrower paid $4.90 in HO insurance premium for every $1,000 of their home’s value, compared to the 2018 rate of $4.70 per $1,000,12 showing a slight increase of $0.20.
Enlarge Image
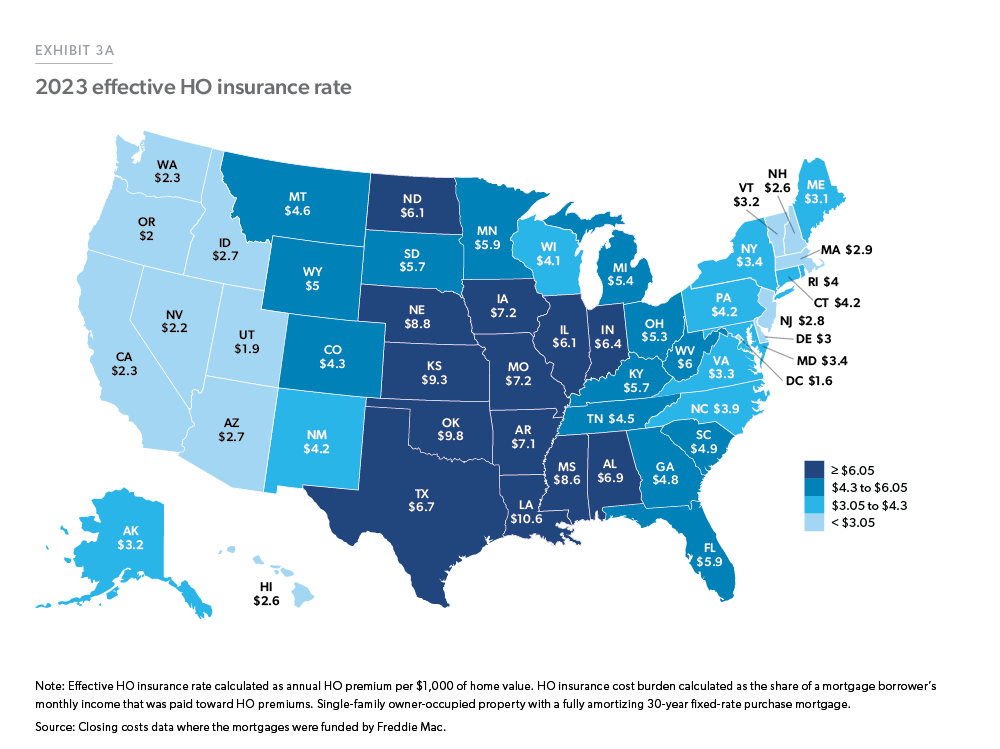
There is a large difference in the effective HO insurance rates paid by mortgage borrowers across the U.S. (Exhibit 3A). In 2023, mortgage borrowers from LA, OK, KS, NE, and MS paid an average HO insurance premium of over $8 for every $1,000 home value, whereas borrowers from CA, WA, NV, OR, UT, and DC paid less than $2.5 for every $1,000 home value. The higher rates observed in the central U.S. are consistent with aggregated statistics collected by the National Association of Insurance Commissioners (NAIC).13 While exposure to natural hazards is one of many factors that affect HO insurance rates across different states, varying regulatory environments may also play a role.14 In CA, for instance, insurance companies offering HO insurance are subject to strict regulation, which limits the rates they can charge. This may in part explain why we observe a relatively lower HO insurance rate in CA, compared to other similarly disaster-prone states such as LA and MS.
Enlarge Image
Enlarge Image
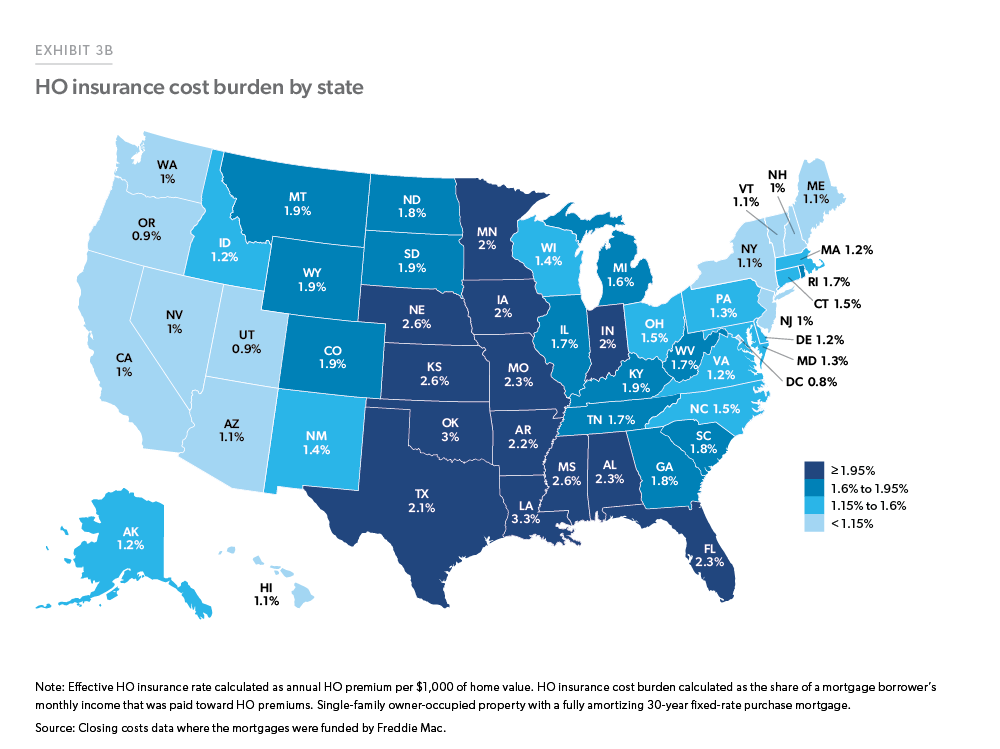
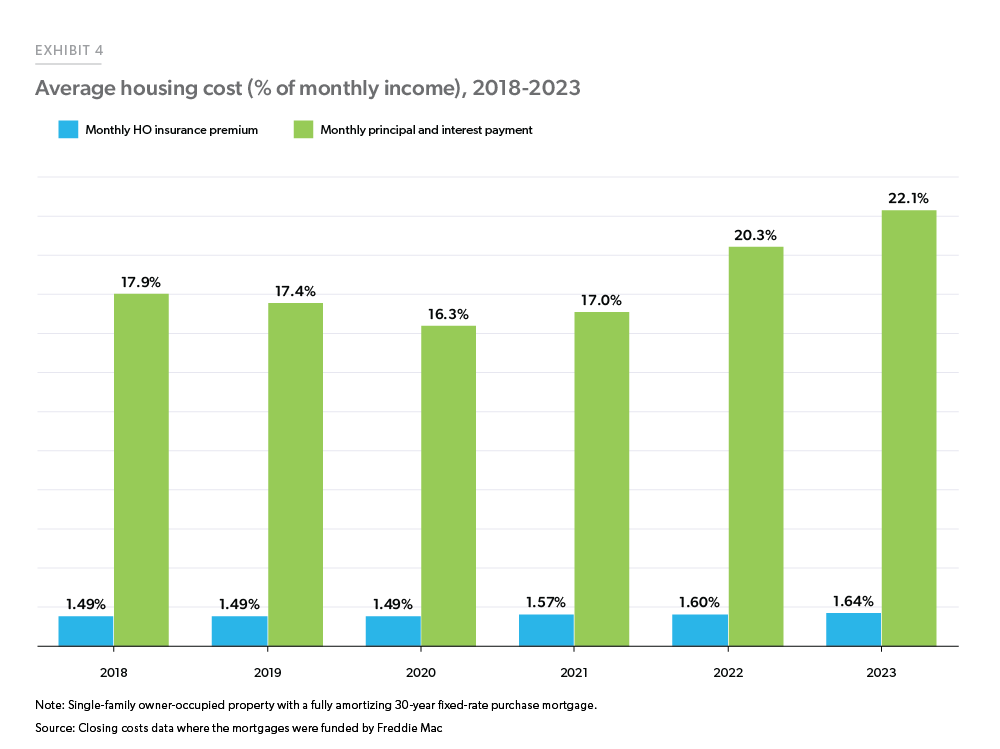
As HO insurance premiums continue to rise, one question of interest is how much of a financial burden these costs place on borrowers. To quantify the extent of associated cost burdens, we calculated the share of a borrower’s monthly income that was paid toward HO insurance premiums. Our analysis in Exhibit 4 shows that, in 2018, HO insurance premiums accounted for an average of 1.49% of a borrower’s monthly income. In 2023 the share had moved up by 10% to 1.64% of an average borrower’s income. The impacts were particularly significant in certain states such as LA, OK, KS, NE, and MS, where borrowers paid over 2.5% of their monthly income towards HO insurance premiums (Exhibit 3B). During the same period, borrowers also had to allocate a greater share of their income towards mortgage principal and interest payments, resulting in high housing cost burdens. Note that while we control for the type of property and occupancy status over time the average Freddie Mac borrower profile has changed between 2018 and 2023 and therefore the variation in insurance cost and P&I may arise from the changing borrower mix. Nevertheless, Exhibit 4 demonstrates that while insurance costs have added to cost burdens, the net impact is much smaller than the impact of higher mortgage principal and interest payments.
Enlarge Image
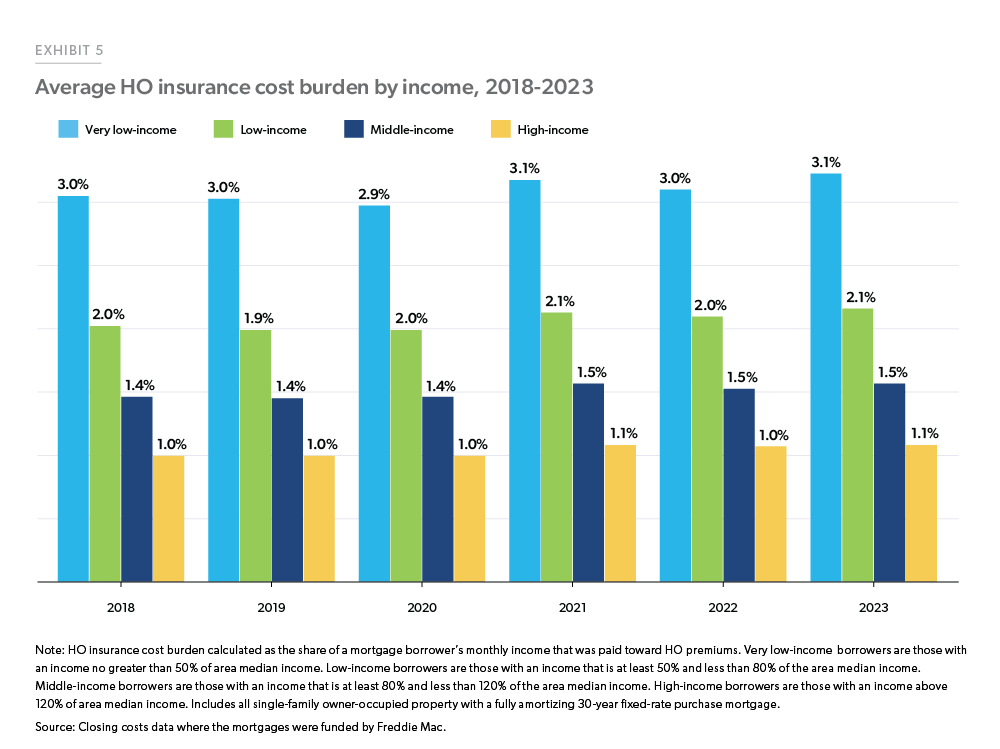
Despite widespread cost burdens across geographies, some homeowners, especially those with lower income, are affected more by increased costs of HO insurance. We find that between 2018 and 2023, very low-income borrowers (those with an income no greater than 50% of area median income) were consistently most burdened by such costs. As shown in Exhibit 5, in 2023, the HO insurance premiums took up 3.1% of their monthly income, which was significantly higher than low-income (2.1%), middle-income (1.5%), and high-income groups (1.1%).15
Enlarge Image
To conclude, as a component of ongoing housing expenses, HO insurance costs are growing but are a small fraction compared to the mortgage principal and interest payment. However, even a small incremental increase in HO insurance cost will impact those at the margin. Our findings highlight substantial heterogeneity in such costs and the cost burdens experienced by borrowers. We find that the effective HO insurance rates were the highest in the central U.S., leading to notable cost burdens in several states within this region. Among all income groups, lower-income borrowers were more challenged. While the costs of HO insurance remain a small fraction of housing expenses, it’s a trend that we will continue to track going forward.
-
Footnotes
1 https://www.newyorkfed.org/research/policy/nowcast#/nowcast
2 https://www.atlantafed.org/cqer/research/gdpnow
3 Nonfarm Employment, Bureau of Labor Statistics (BLS)
4 https://www.wsj.com/economy/jobs/small-business-jobs-hiring-c0b17cf0
6 Builder Sentiment Surges on Falling Interest Rates | NAHB. https://www.nahb.org/news-and-economics/press-releases/2024/01/builder-sentiment-surges-on-falling-interest-rates
7 U.S. Census Bureau and U.S. Department of Housing and Urban Development
8 Mortgage Bankers Association
9 https://www.federalreserve.gov/data/sloos/sloos-202401.htm
10 A standard homeowners insurance policy provides coverage for the structure of your home, your personal belongings, liability protection, and additional living expenses (e.g., if you cannot live in the insured home due to damage from a disaster). It does not cover damage to your land, or damage caused by floods or earthquakes.
11 The UCD is a dataset jointly created by Fannie Mae and Freddie Mac to support the Consumer Financial Protection Bureau’s (CFPB) Borrower Closing Disclosure. It contains detailed records of the closing documents for all single-family loans purchased by the GSEs (Fannie Mae and Freddie Mac). The earliest UCD data goes back to September 2017. We combine UCD data with Freddie data to create our sample population of a single-family owner-occupied home with a conventional 30-year fixed-rate mortgage.
12 For comparison, the average effective property tax rate among those with a mortgage was $11.5 per $1,000 home value nationwide
13 NAIC (2023). Dwelling Fire, Homeowners Owner-Occupied, and Homeowners Tenant and Condominium/ Cooperative Unit Owner’s Insurance Report. https://content.naic.org/sites/default/files/publication-hmr-zu-homeowners-report.pdf.
14 Oh, S., Sen, I., & Tenekedjieva, A. M. (2022). Pricing of climate risk insurance: Regulation and cross-subsidies. Available at SSRN 3762235.
15 Low-income borrowers are those with an income that is at least 50% and less than 80% of the area median income. Middle-income borrowers are those with an income that is at least 80% and less than 120% of the area median income. High-income borrowers are those with an income above 120% of area median income.
Prepared by the Economic & Housing Research group
Sam Khater, Chief Economist
Len Kiefer, Deputy Chief Economist
Ajita Atreya, Macro & Housing Economics Manager
Rama Yanamandra, Macro & Housing Economics Manager
Penka Trentcheva, Macro & Housing Economics Senior
Genaro Villa, Macro & Housing Economics Senior
Song You, Macro & Housing Economics Senior
Jessica Donadio, Finance Analyst