


About Apartment Investment Market Index® (AIMI®)
AIMI estimates how the multifamily investment environment changes over time nationally and in select metros. Updated quarterly, the index combines three market factors to present a value that can be compared with prior time periods. AIMI offers investors a unique insight into understanding the investment conditions for multifamily properties.
There are three variables used to determine AIMI:
- Growth rates in multifamily rental income
- Growth rates in multifamily property prices
- Multifamily mortgage rates
Understanding AIMI
AIMI portrays how the relative value of investing in multifamily properties has changed over time. The relative value of investing is estimated by comparing the growth in net operating income (NOI) with the growth in mortgage debt service for investors. Mortgage rates and changes in property prices are used to determine changes in the debt service, while rental income, which includes changes in rent growth and vacancy rates, is used to determine changes in NOI.
Each variable affects the index differently. If mortgage rates or property prices increase, with all else equal, AIMI will decrease due to the increasing cost of investing, as captured by higher debt service payments investors pay for the property. Conversely, if NOI increases, with all else equal, AIMI will increase due to the higher rental income investors are receiving on the property. The combination of these conditions provides a simple measure of the changes in the relative value of investments in multifamily properties over time.
When comparing AIMI values over two quarters for a specific metro, an increase means the cost of investing is lower implying a more favorable investment opportunity compared with the prior quarter. A decrease means the cost of investing is higher implying a less favorable investment opportunity. For example, if AIMI’s value for Atlanta increased to 115 in the current quarter, up from 110 in the previous quarter, this suggests that the relative value of an investment is lower in the current quarter compared with the prior, indicating a more favorable investment environment in the current quarter compared with the prior.
AIMI views the multifamily investment market like investors would gauge the equity market: Strong cash flows that are undervalued are most favorable. The index does not capture all factors and does not forecast future conditions. Certain factors are not captured in this measure, including property-level characteristics, so individual investment performance may or may not move with the index.
Reading AIMI
AIMI is updated quarterly. Each update includes commentary for each of the select metros and the nation. We provide insight into the three variables that make up the index, including how they influence the index value.
AIMI’s Components Chart
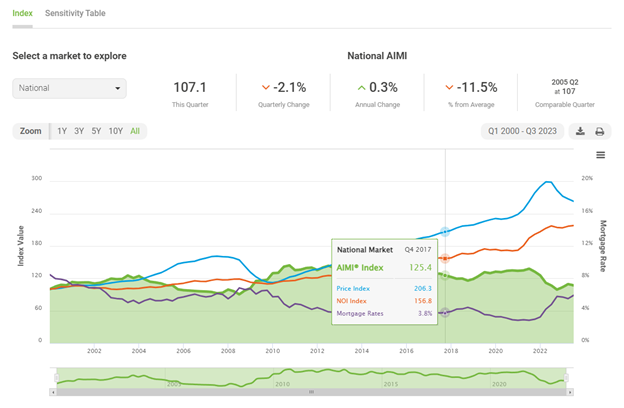
This chart shows the AIMI value and the three variables that make up the AIMI going back to 2000. The value of AIMI is represented by the green line and shaded region in the chart. Hovering over the index shows the value for each quarter. The blue line represents changes in property price and the orange line displays NOI changes. These two variables are indexed to the first quarter of 2000 and are represented on the left-hand side axis. The mortgage rate in purple is not indexed and is represented on the right-hand side.
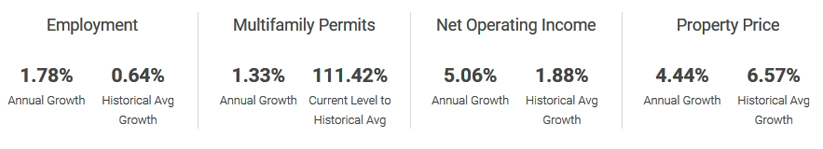
Details about the variables used in the index, along with relevant macroeconomic data are provided in the commentary. The annual growth is computed for each metro from the current quarter to the same quarter in the prior year. The historical average growth for Employment, Net Operating Income and Property Price is the average annual growth for each metro computed starting in 2000 and going through the prior year. For Multifamily Permits, we show the year-over-year change in permits along with the ratio of the current permits to the average number of permits from 2000 through the prior year. This ratio provides insight as to how much new development a market is currently experiencing relative to the historical norm.