


Migration to Environmentally Risky Areas: A Consequence of the Pandemic
People move for different reasons, both housing and non-housing-related. Housing-related reasons may include a need or desire for a larger home. Non-housing reasons could be employment- or family-related, such as seeking neighborhoods with shorter commutes or better schools, or looking to be closer to nature, such as the coast or mountains. In the 2010’s, the rate of mobility in the U.S. decelerated due to changes in demographics and labor dynamics as well as a dramatic increase in home prices.1 But, with the onset of the COVID-19 pandemic, mobility has increased and the current trend has only grown stronger.
In a previous Research Note, we showed that the COVID-19 pandemic amplified the exodus from large, expensive metro areas to smaller, more affordable destinations. Many such desirable destinations that are farther from the cities are not only less costly but are also closer to natural amenities. Natural amenities however are often associated with environmental risks such as flooding and wildfires. Therefore, moving closer to natural amenities can also mean increased exposure to various natural hazards. People may be unaware of these hazards when they move to an area, but they become obvious after disaster strikes.2
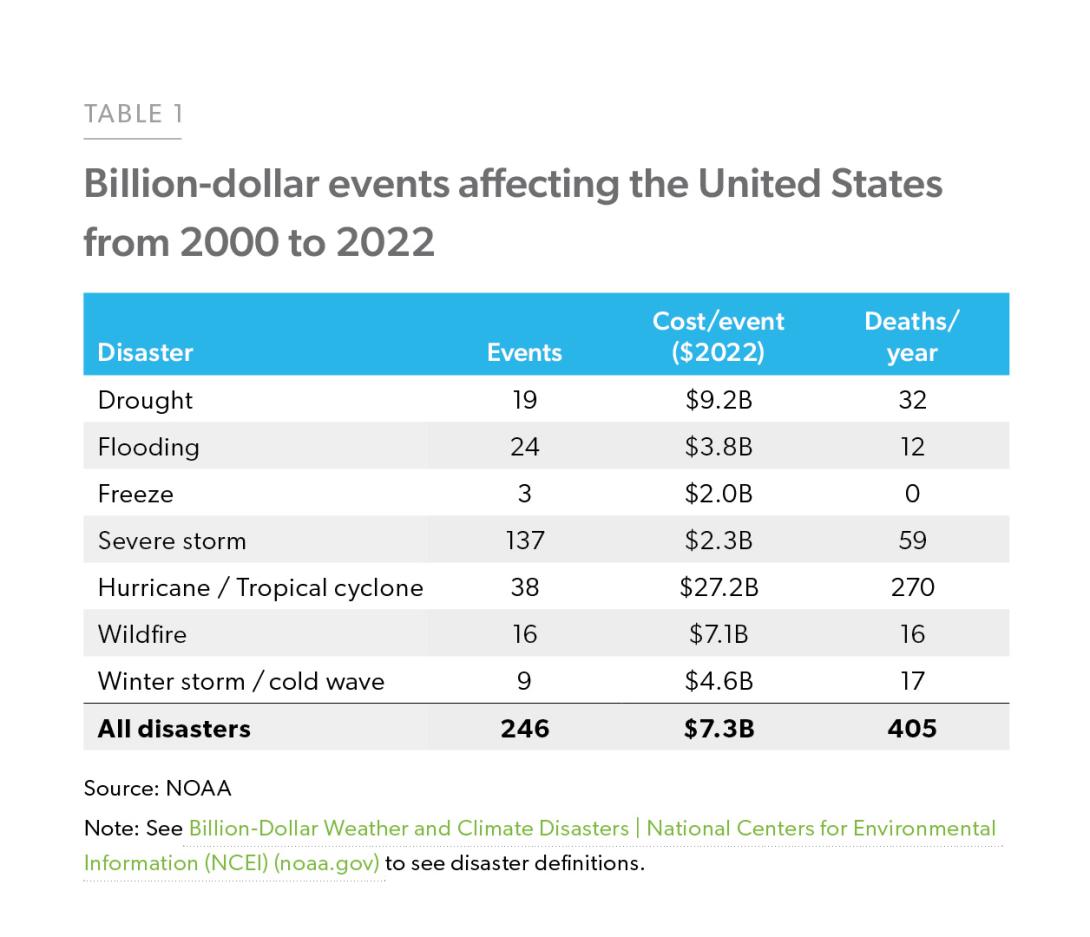
In the U.S. the frequency and severity of natural disasters have been growing and are likely to grow further with rising temperatures.3 According to the National Oceanic and Atmospheric Administration (NOAA), the U.S. has sustained 246 weather and climate disasters since 2000 with a total cost of these events exceeding $1.8 trillion ($7.3B cost per event). Table 1 shows the frequency and cost associated with billion-dollar natural disaster events since 2000.
Enlarge Image
In the past, when a natural disaster strikes, the U.S. cities at issue experienced a massive out-migration from the impacted areas. In this Research Note, we aim to better understand the migration patterns in environmentally risky areas and their implications for the housing market.
We analyzed almost 30 million Freddie Mac loan applications for purchases of owner-occupied homes between 2000 to March 2022 and combined them with FEMA’s National Risk Index (NRI).4 We caution that loan application data provides a portfolio view of Freddie Mac’s conventional loans and captures the intent to move— not whether the applicant did move. However, the data is timely, and the geographic coverage is broad. Most research on migration topics is restricted to the evaluation of annual and county- level census bureau data, whereas we are able to improve the timeliness and granularity of our analysis by focusing on the exact location of loan applications. Specifically, in this study, we use the loan application data to discover if the pandemic coincided with any significant shifts in the level of migration or in patterns of movement as it relates to natural hazard risks, and we approximate the net migration in high-risk areas. Net migration in this Note is defined as in-flows/in-migration minus out-flows/out-migration of mortgage applicants. To the best of our knowledge, this is the first study on migration patterns using the NRI and focuses on 1) wildfires and drought; 2) hurricanes and coastal floods; and 3) earthquakes. Three key findings of the study are as follows:
- Migration to high-risk areas from low- and moderate-risk areas has doubled since the onset of the pandemic.
- During the pandemic, more people moved to areas with a high risk of wildfire, drought, and hurricanes.
- The pandemic amplified out-migration from high earthquake risk areas that are mostly concentrated in the West.
More people are migrating to environmentally risky areas
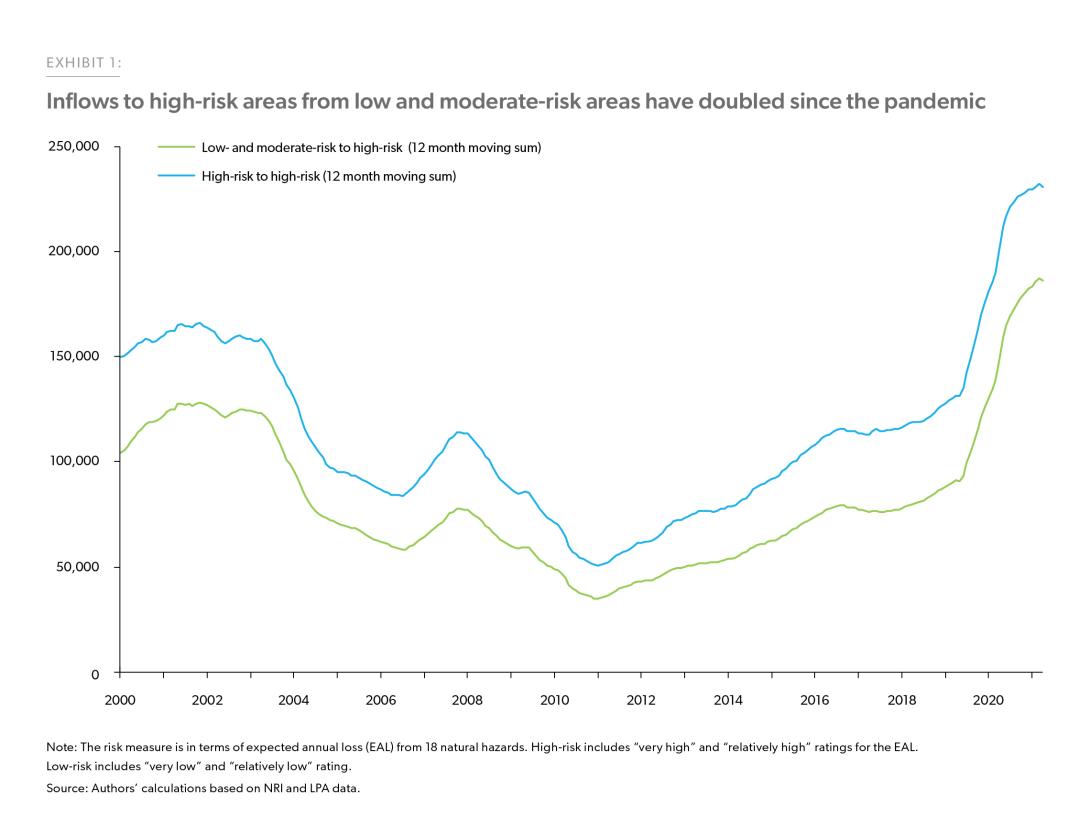
Natural hazards span the United States, but certain neighborhoods are at higher risk than others.5 Our analysis of the NRI shows that, out of over 72,000 tracts in the U.S., 13% of the tracts are “high-risk” in terms of their exposure to one or some combination of 18 different natural hazards. 24% of the tracts are “moderate-risk” and the rest are “low-risk.”6 With increased migration during the pandemic, the question then is whether more people are moving to these high-risk neighborhoods, as identified by FEMA, that exhibit high expected annual loss from various natural hazards.
Exhibit 1 shows the rolling sum of applications to move to high-risk tracts from low- or moderate-risk tracts over time.7 We find that, over time, high-risk tracts are gaining more traction with an increase in the share of applications to move to high-risk areas by 2 percentage points (7% to 9%) in the last two decades. The COVID-19 pandemic accelerated the move to high-risk areas with over 97,000 applicants applying to move to high-risk areas compared to pre-pandemic February 2020 levels (from 90,462 applicants in February 2020 to 187,669 applicants in February 2022). This coincides with the pandemic period when, due to remote work flexibility, many urbanites from major expensive cities like New York, Los Angeles, and San Francisco moved to small towns and cities near national parks, scenic public lands, and other natural amenities and were famously referred to by NPR as “Zoom towns.”8 While these places attract migrants seeking amenities and have become increasingly popular places to live, they also exhibit high environmental risks. For example, Bend, a popular Zoom town in Deschutes County in Oregon is highly exposed to the risk of wildfires—it falls in the top 20% in terms of expected annual loss from wildfires by county. Out of 24 tracts in Deschutes County, 8 tracts are high-risk, and 11 are moderate-risk with a combined expected annual loss from wildfires expected to be approximately $3.0M, according to our analysis of the NRI. Zoom towns such as Bend are experiencing massive in-migration and consequently are now presented with affordability challenges atypical for small towns.9 With a growing demand for houses, home prices in Bend grew by a cumulative 62% since the pandemic’s onset (February 2020 to April 2022), making it unaffordable for many prospective buyers.
Enlarge Image
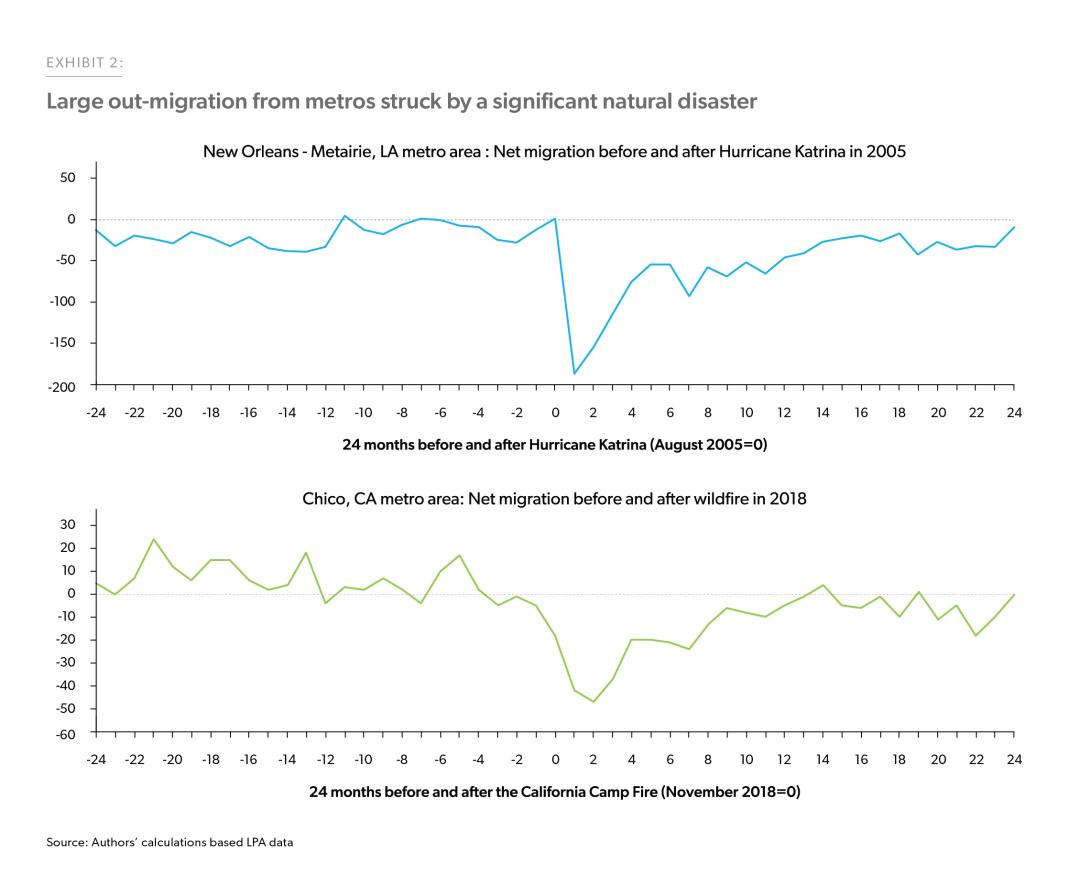
The migration pattern shown in Exhibit 1 is a one-way flow to high-risk areas from low- and moderate- risk areas. Natural disasters routinely hit many parts of the United States. For example, the West coast has wildfires and Florida has coastal flooding. In the past, especially when a significant natural hazard has struck, we have witnessed migration out of these areas. Exhibit 2 shows that the metros severely impacted by natural disasters have seen a large out-migration. For example, after Hurricane Katrina in 2005, and the California Camp Fire in 2018, there were pronounced out-migrations observed in New Orleans, LA, and Chico, CA. But a variety of biases exist when it comes to dealing with natural hazards, and among them is the failure to learn from past disasters.10 Previous studies, including our Research Note, show that people tend to discount past catastrophic events as the memory fades11 and thus may tend to put themselves in harm’s way again. Migration patterns in Exhibit 2 reflect such bias where the net migration post-disaster returned to the pre-disaster trends.
Enlarge Image
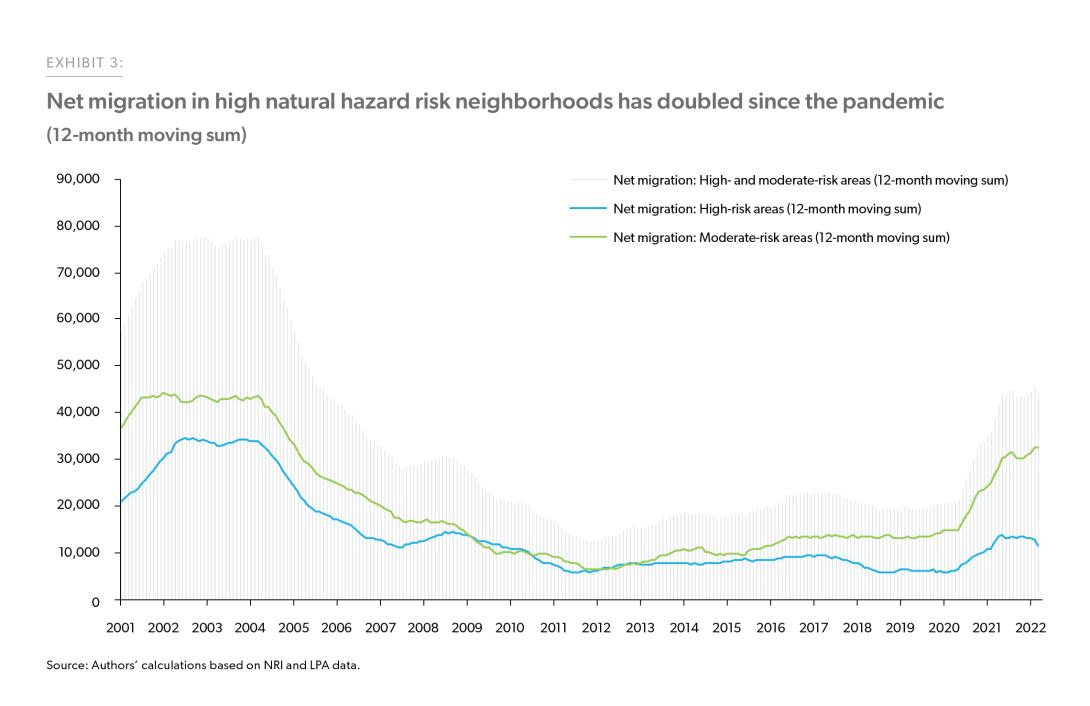
To account for such out-migration at different phases, we focus on estimating net migration in the rest of this analysis. In Exhibit 3, we show that overall, the net migration in the high- and moderate-risk areas has increased particularly in the wake of the COVID-19 pandemic.12 In the high-risk neighborhoods, net migration has tripled since the onset of the pandemic.
Enlarge Image
Migration patterns by natural hazard type
Wildfire and drought risk
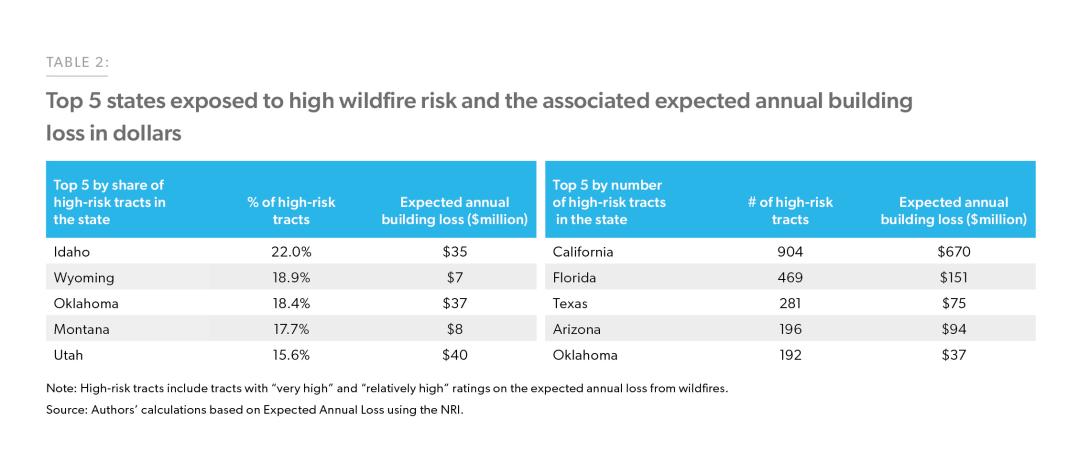
The U.S. has been grappling with a dramatic increase in wildfires. According to the National Interagency Fire Center, over the past four decades, the burned area from wildfires has roughly quadrupled, and thousands of housing structures have been destroyed.13Our analysis of the National Risk Index shows that in 4% of the census tracts in the country (i.e., 3,017 census tracts) there is a high risk of wildfires. While the count of tracts that are high in wildfire risk is the highest in California based upon its sheer size, as a share of total tracts in the state, Idaho tops the chart overall with 22% of its census tract rated as high- risk, followed by Wyoming (18.9%), Oklahoma (18.4%), Montana (17.7%), and Utah (15.6%). In Arizona, California, Florida, Nevada, New Mexico, and South Dakota, more than 10% of their tracts are high wildfire risk tracts. In Table 2, we present the top states with exposure to high wildfire risk including the expected annual loss as measured by the NRI.
Over the past four decades, the burned area from wildfires has roughly quadrupled, and thousands of housing structures have been destroyed.
Enlarge Image
We analyzed the migration patterns in neighborhoods with high wildfire risk and find that net migration in high wildfire risk areas has increased by 146% since the pandemic (Exhibit 4).
In our earlier Research Note, we show that net migration was highest in affordable interior markets. Bakersfield, California for example saw more than a tenfold change in homebuyer net migration in the two years occurring before and after the start of the pandemic. Bakersfield is a city in Kern County and our analysis shows that it is exposed to high risk of wildfires with an expected annual loss of around $11.8M placing it in the top 10th percentile in terms of per capita expected annual loss by county. This once-affordable metro faced home price growth of 38% since Feb 2020, driven by massive in-migration.

Enlarge Image
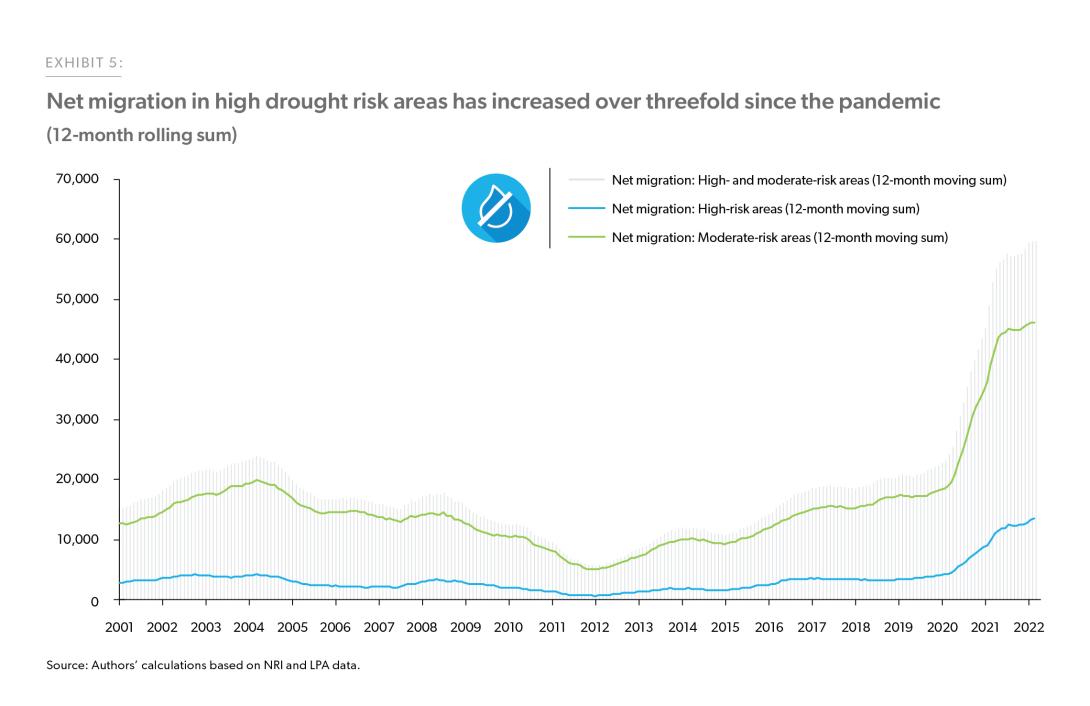
Wildfire risk is exacerbated by drought, which takes many years to be recognized but is sustained for long periods. In 2022, the most extensive and intense drought was recorded in the West in the 22-year history of the U.S. Drought Monitor.14 The severe drought conditions are particularly detrimental to rural economies reliant on agriculture but many cities in intense drought regions are also facing restriction on household water usage. Despite such situations in drought-prone areas, our analysis shows that net migration is elevated in tracts vulnerable to the impacts of droughts, particularly with the onset of the pandemic. In Exhibit 5 we show that the net migration in tracts with high drought risk remained flat from 2000 until 2020. However, since the pandemic, it increased more than threefold. According to our analysis of the NRI, some of the highest drought risk areas are unsurprisingly in California—particularly in smaller counties such as Yuba and Tehama with a population of less than 100,000 where more than half of their tracts are exposed to high drought risk.15 In terms of the share of tracts exposed to high drought risk, Iowa is at the top with 24% of the tracts rated as high drought risk, followed by 14% of tracts in Nebraska and 12% of tracts in Arkansas.
Enlarge Image
Hurricanes and coastal floods
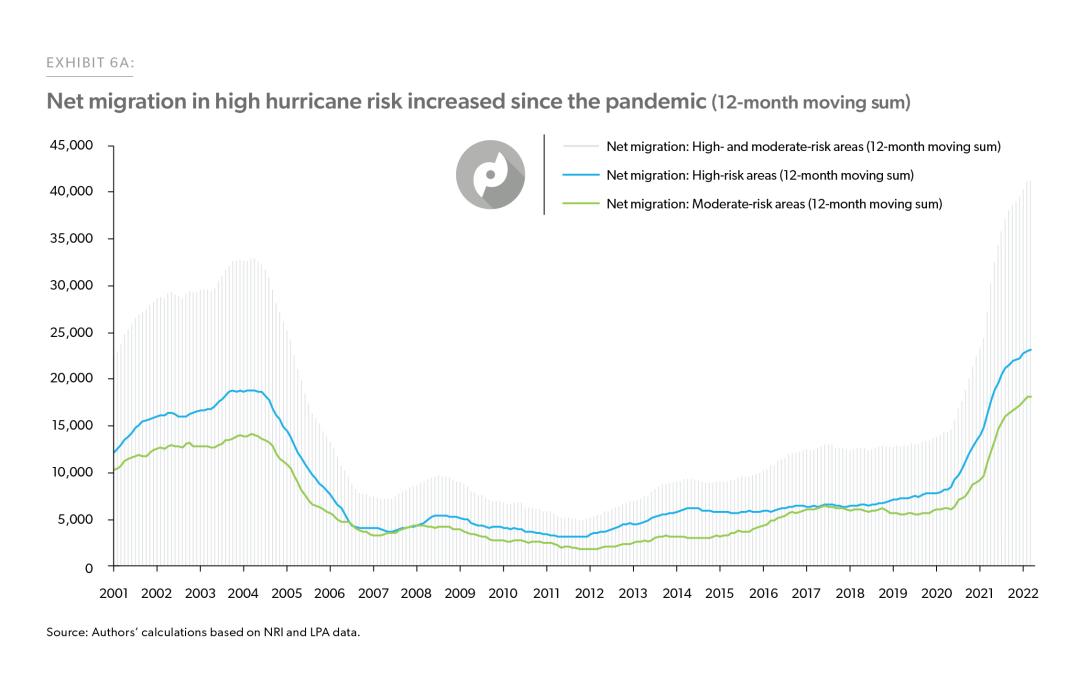
40% of the population in the U.S. lives in coastal counties that are prone to the risks of hurricanes and coastal flooding. Hurricanes are mostly concentrated in the Southern and Atlantic states. Louisiana has the largest number of tracts that are prone to high hurricane risk followed by Mississippi, Texas, Florida, North Carolina, Alabama, South Carolina, Georgia, and Virginia. In the high-risk tracts of these nine states, 9.3 million housing units are exposed to the risk of hurricanes.16 In Exhibit 6 we show that the net migration in high hurricane risk areas increased slowly since 2012 and has more than tripled since the pandemic. So, which metros in these hurricane-prone states attracted the most in-migrants during the pandemic? When we look at the top metro destinations for homebuyers as shown in our previous Research Note, Houston, Texas stands out even though it was severely impacted by Hurricane Harvey in 2017 (see additional research on this event here). In Harris County, where Houston is located, there are 748 tracts that are at high risk from hurricane losses and the annual building loss is expected to be almost $506 million. Lee County in southwest Florida, where the largest city is Cape Coral, was another top destination for in-migrants during the pandemic. According to our analysis of the NRI, the annual building loss in Lee County is expected to be almost $50 million. This is the second highest expected loss after Palm Beach County which is one of the three counties that make up the Miami metropolitan area.
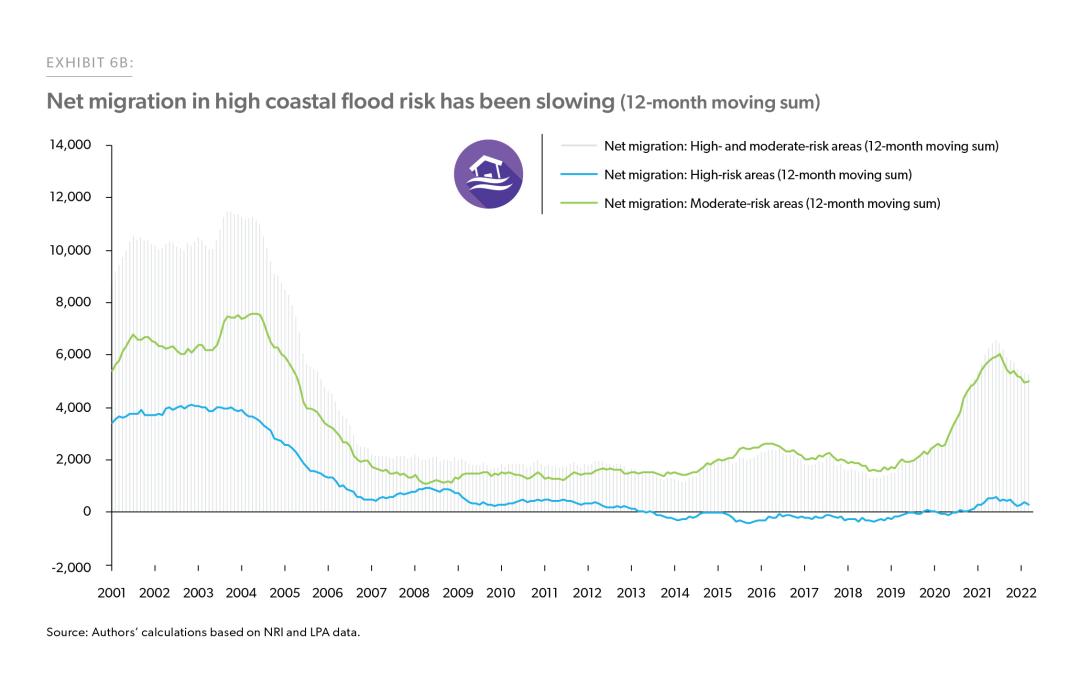
Net migration in high hurricane risk areas has more than tripled since the pandemic. However, in areas that are prone to a high risk of coastal flooding, migration is slowing down.
While high hurricane risk areas and high coastal flood risk areas overlap to some extent there are some differences. Contrary to hurricanes, which are tropical cyclones or localized low-pressure weather systems with maximum sustained winds of at least 74 mph, coastal flooding is when water inundates or covers normally dry coastal land because of high or rising tides or storm surges. Our analysis of coastal flooding’s expected annual loss rating shows that ten states—namely New Jersey, Washington, Delaware, Louisiana, Florida, Maryland, Oregon, North Carolina, South Carolina, and Virginia have a high share of their tracts exposed to high risk of coastal flooding. 9% of tracts in New Jersey, 9% of tracts in Washington, and 7% of tracts in Delaware are exposed to a high risk of coastal flooding. In these ten states, 1.6 million housing units are exposed to a high risk of coastal flooding.17 In areas that are prone to a high risk of coastal flooding, after a spike in net migration since 2018 through the pandemic, we find the net migration is slowing down.
Enlarge Image
Enlarge Image
Earthquakes
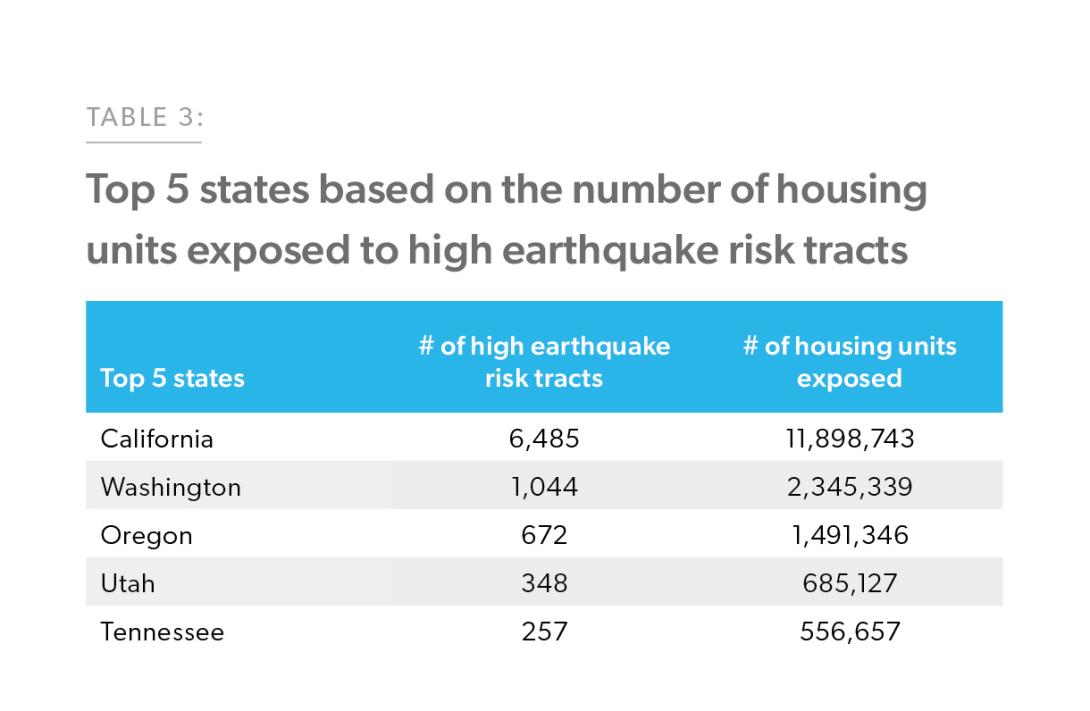
In the U.S., earthquake risk is mostly concentrated in the West. Out of 8,036 tracts in California, over 6,000 tracts (81%) are at a high risk of expected annual loss from earthquakes each year. Oregon also has over 80% of its tracts exposed to a high risk of earthquakes. The other states with areas facing the highest risk of earthquakes are Alaska, Washington, Utah, and Hawaii, where more than 40% of their tracts are exposed to high earthquake risk. In Nevada, Tennessee, South Carolina, and Montana more than 10% of their census tracts are exposed to high earthquake risk. Table 3 shows the top five states in terms of the number of housing units in high earthquake risk tracts. In California, over 11 million homes are exposed to high earthquake risks followed by Washington, where 2.3 million homes are at the risk of earthquakes.
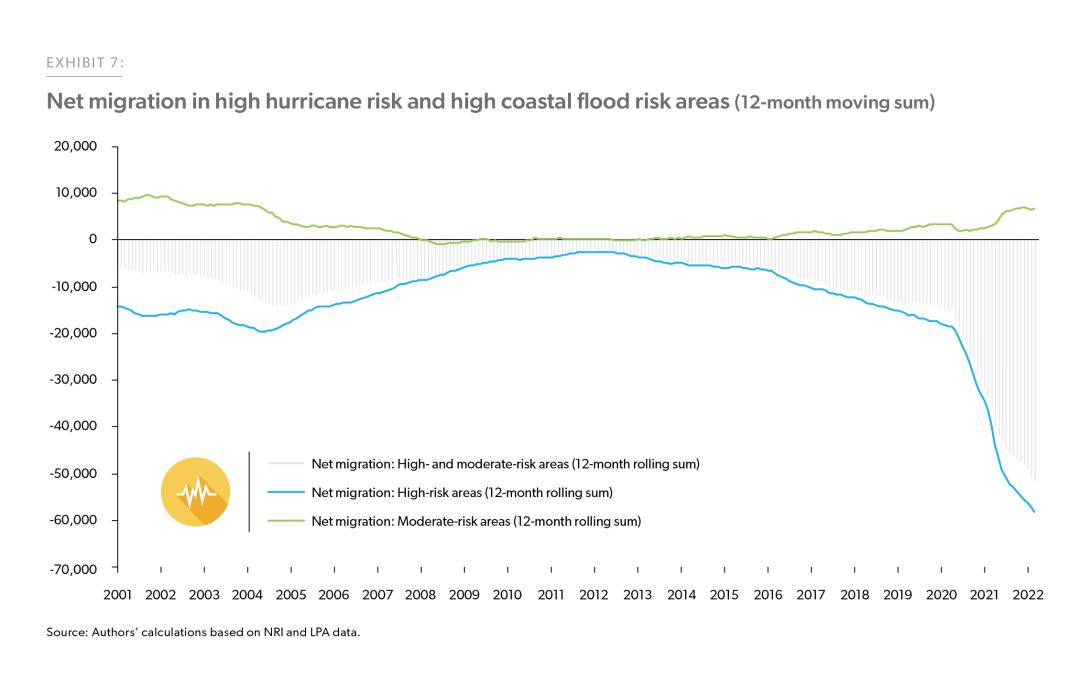
Analyzing migration patterns in high earthquake risk areas, we find the net migration in these areas has been negative since 2000 and since the pandemic, there has been a pronounced out-migration from high earthquake risk areas (Exhibit 7).
Enlarge Image
Enlarge Image
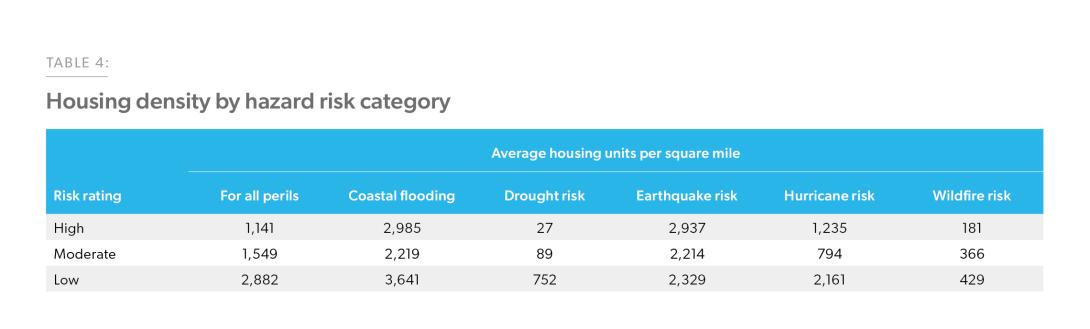
This is not a surprise given our findings in a previous Research Note that people are moving out of the high-cost California market where earthquake risk is high. Looking at the density of housing by hazard type we find that the housing density in high earthquake risk areas is higher, which is associated with high home prices due to restricted space to build homes. On the contrary, where housing density in areas exposed to a high risk of other natural hazards is low is where we find more people in-migrating.
Enlarge Image
Conclusion
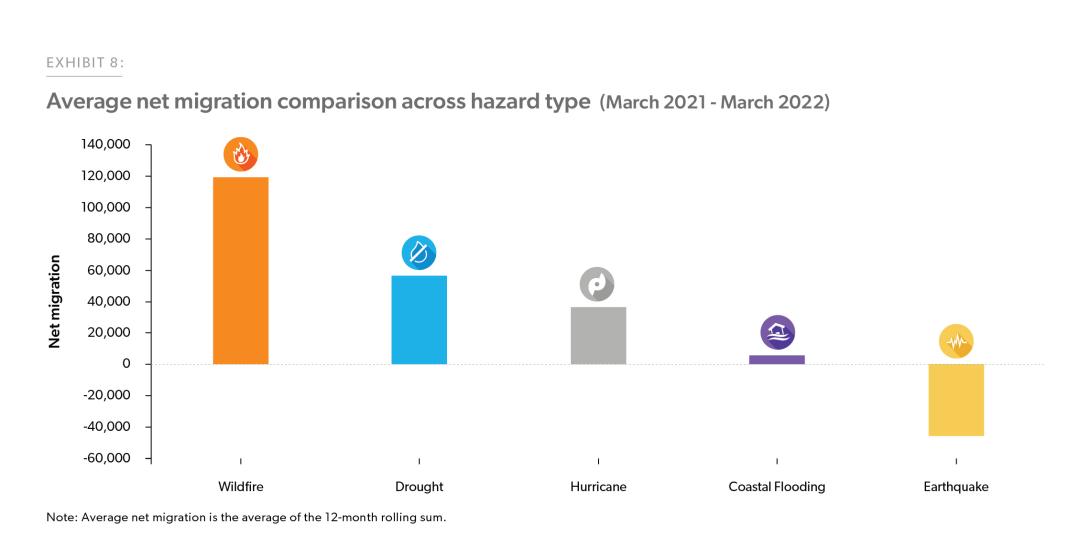
The COVID-19 pandemic exacerbated a shift in demographic migration as many Americans sought out amenities such as access to the outdoors and bigger spaces—a need that evolved with increasing remote work and homeschooling. In addition to these desirable amenities, the search for affordable housing pushed many Americans away from expensive coastal markets to parts of the country more exposed to various natural hazards. In our analysis, we find that net migration to high natural hazard risk areas has doubled since the pandemic began. We also find that more and more people are moving to areas with a high risk of wildfire, drought, and hurricanes as shown in Exhibit 8.
Enlarge Image
Another interesting finding in our analysis is that while many people moving out of high-cost areas may have avoided one natural hazard risk, they may have moved to areas that are exposed to another risk. For example, people moving out of California may have avoided earthquake risk, but those moving to Boise are now exposed to wildfire risk. Overall, while the migration to high-risk areas does not increase the collateral risk unless the migration is resulting in new housing stock being constructed, the increase in prices due to demand resulting from high in-migration exposes more collateral to higher risk.
So, why are people exposing themselves to high natural hazard risks? Looking at the places where people have migrated to— particularly with the onset of the pandemic—three top factors seem to be at play. These top factors are 1) desire for bigger space; 2) desire for natural amenities; and 3) affordability. While these are speculations and require further research, it’s clear that many have put themselves in harm’s way since the pandemic began by moving to a location that is exposed to a high risk of natural hazards. Regarding people’s decision to out-migrate, there is little evidence that, on average, natural hazards are a strong driver of out-migration. Instead, it is the affordability of the area as suggested by out-migration from places like California and New York that pushes people out unless there is a major natural disaster that provides information about the riskiness of the area they are residing in. However, with more and more people moving to smaller metros, these recipient communities are facing entirely new problems, such as housing and transportation issues, limited resources to accommodate the growing population, and now higher home prices. Additional analysis must be done to continue addressing this dynamic and we hope to continue our research.
Freddie Mac’s Approach
For homes located in designated Special Flood Hazard Areas (SFHAs), Freddie Mac requires flood insurance coverage. Additionally, a mortgage is ineligible for sale to Freddie Mac if the mortgage is secured by property that is subject to coastal tideland, wetland, or setback laws and/or regulations that prevent the rebuilding or maintenance, or improvements of the property if they are damaged or destroyed. Other perils, such as fire, are covered by homeowner insurance. Freddie Mac requires all homes underlying single-family mortgages in our portfolio to have property insurance coverage throughout the life of the loan.
In addition to flood insurance, Freddie Mac has a number of additional layers that protect the company in the event of a disaster. These include: borrower equity, which is at or near an all-time high; our disaster relief options for affected borrowers which help prevent losses from foreclosure; and our numerous credit-risk transfer products, which transfer credit risk away from Freddie Mac and to private investors.
-
References
Beltrán, Allan, David Maddison, and Robert Elliott. “The impact of flooding on property prices: A repeat-sales approach.” Journal of Environmental Economics and Management 95 (2019): 62-86.
Dai, Aiguo. “Drought under global warming: a review.” Wiley Interdisciplinary Reviews: Climate Change 2, no. 1 (2011): 45-65.
Hirabayashi, Yukiko, Roobavannan Mahendran, Sujan Koirala, Lisako Konoshima, Dai Yamazaki, Satoshi Watanabe, Hyungjun Kim, and Shinjiro Kanae. “Global flood risk under climate change.” Nature climate change 3, no. 9 (2013): 816-821.
Liu, Yongqiang, John Stanturf, and Scott Goodrick. “Trends in global wildfire potential in a changing climate.” Forest ecology and management 259, no. 4 (2010): 685-697.
Marandi, Anna, and Kelly Leilani Main. “Vulnerable City, recipient city, or climate destination? Towards a typology of domestic climate migration impacts in US cities.” Journal of Environmental Studies and Sciences 11, no. 3 (2021): 465-480.
McGuire, Bill. Waking the Giant: How a changing climate triggers earthquakes, tsunamis, and volcanoes. Oxford University Press, 2013.
NCEI, NOAA. “US billion-dollar weather and climate disasters.” (2022). https://www.ncei.noaa.gov/access/billions/
Rummukainen, Markku. “Changes in climate and weather extremes in the 21st century.” Wiley Interdisciplinary Reviews: Climate Change 3, no. 2 (2012): 115-129.
-
Appendix
Loan Product Advisor (LPA) Data
Freddie Mac’s automated underwriting system, Loan Product Advisor® (LPA)—created to streamline the loan application process and serve as a database management system for hundreds of millions of transactions—offers a real-time view into the residential mobility of American homebuyers. For our analysis, we use all accepted purchase loan applications for owner-occupied homes that came through the LPA system. The final LPA sample removed loan submissions in the prequalification stage and where the mortgage was unlikely to comply with Freddie Mac’s eligibility and underwriting requirements.
FEMA National Risk Index
The National Risk Index is a dataset and online tool to help illustrate the United States Communities most at risk for 18 natural hazards. In the NRI, the risk is defined as the potential negative impact because of a natural hazard. The risk equation behind the risk index includes three components namely Expected Annual Loss, Social Vulnerability, and Community Resilience. Expected Annual Loss is the natural hazard component and the remaining two are consequence enhancing and consequence reducing components respectively. In our analysis, we focus on the Expected annual Loss component for 5 major natural disasters: wildfires, drought, hurricanes, coastal flooding, and earthquakes. One caveat of NRI is that it’s a static measure of natural hazard risk and we assume that the risk has remained the same over our study period.
-
Footnotes
2 See our previous Research Note: https://www.freddiemac.com/research/insight/20220316-sea-level-rise-and-impact-home-prices-coastal-florida
3 Dai 2011; Hirabayashi, et al. 2013; Liu et al. 2009; Mcguire 2013; Rummukainen 2012
4 See the appendix for details on the application data and National Risk Index data. Applicants include both renters and existing homeowners.
5 FEMA defines natural hazards as environmental phenomena that have the potential to impact societies and the human environment, and a natural disaster is a negative impact following an actual occurrence of a natural hazard in the event that it significantly harms a community
https://hazards.fema.gov/nri/natural-hazards6 Five-scale rating system is used in NRI to determine the “riskiness” of the tracts to various natural hazards. We consider “very high” and “relatively high” ratings as “high-risk” and “very low” and “relatively low” ratings as “low risk” and the rest is “moderate risk” unless noted otherwise.
7 One caveat of the NRI is that it is measured at one point in time therefore how the risk evolved over time is not known. We are assuming that the risk ratings remained the same over time.
9 Marandi A, Main KL 2021 https://pubmed.ncbi.nlm.nih.gov/34367871/
10 https://riskcenter.wharton.upenn.edu/wp-content/uploads/2019/07/J2010Milken_OvercomingMyopia.pdf
11 Beltran Hernandez, A, Maddison, D & Elliott, R, 2019 https://doi.org/10.1016/j.jeem.2019.02.006
12 Net Migration in high-risk areas equals counts of applications from (Low to High+ Moderate to High+ High to High) minus (High to Low +High to Moderate + High to High)
13 National Interagency Fire Center, Wildland Fire Statistics, National Interagency Fire Center, Wildland Fire Statistics: https://www.nifc.gov/fireInfo/fireInfo_statistics.html
15 A drought expected annual loss rating represents a community’s relative level of expected agriculture loss each year due to droughts—a deficiency of precipitation over an extended period resulting in a water shortage. Drought risk is defined by FEMA as a deficiency of precipitation over an extended period of time resulting in a water shortage.
16 Housing unit counts are based on the U.S Census Bureau, American Community Survey (2015-2019) 5-year data.
17 Housing unit counts are based on the U.S Census Bureau, American Community Survey (2015-2019) 5-year data.
Prepared by the Economic & Housing Research group
Sam Khater, Chief Economist
Len Kiefer, Deputy Chief Economist
Ajita Atreya, Senior Macro & Housing Economist