


Maintaining Momentum: 2018 and Beyond
Starting off the year, things are looking pretty good for the U.S. economy and housing markets. Mortgage rates are low, economic growth has accelerated in recent quarters, and housing is coming off its best year in a decade. Although housing markets have been improving year-after-year for nearly a decade, there’s still room for improvement. Will U.S. housing markets maintain momentum in 2018 and 2019?
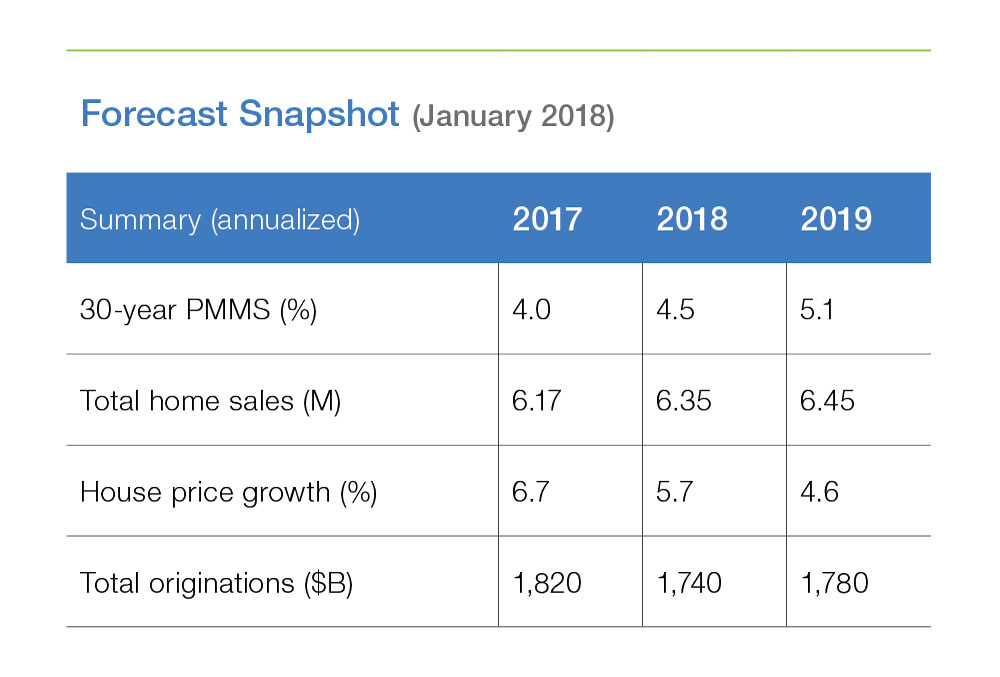
We forecast moderating growth in U.S. housing market activity through the next two years. The Tax Cuts and Jobs Act bill signed into law in December lowered the corporate income tax rate and should boost GDP growth by about a quarter percentage point in 2018. Together with a strong labor market, firming up of growth will lead to an uptick in consumer price inflation. The increase in inflation should be modest, allowing the Federal Reserve to increase rates gradually.
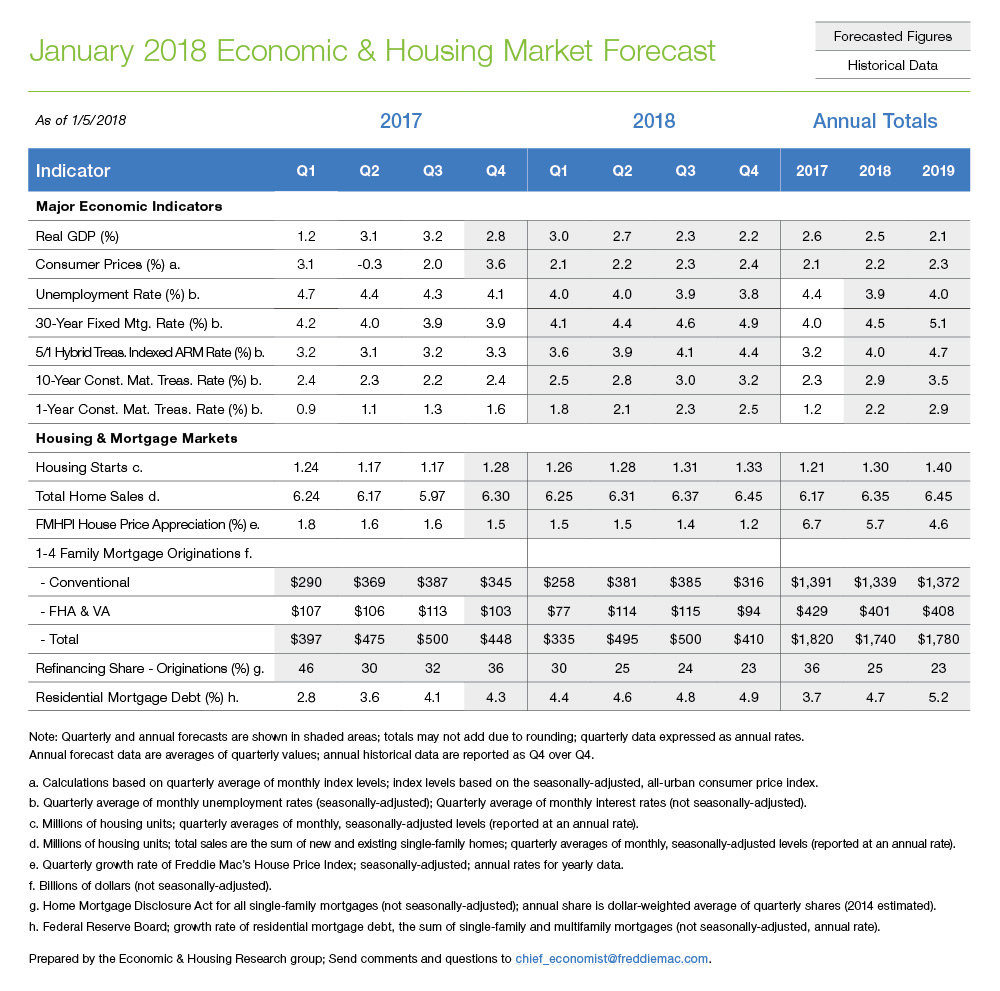
In 2017, long-term interest rates, as measured by the 10-year Constant Maturity Treasury (CMT), barely moved, while short-term interest rates increased. The Federal Open Market Committee (FOMC) raised its policy target three times in 2017. Other short-term rates followed; the 1-year CMT increased about 0.75 percentage points over the same period. This led to a flattening of the yield curve.
As we discuss below, a flatter yield curve, particularly one that becomes “inverted,” is a bad sign for future economic growth. We anticipate that short-term rates will follow FOMC policy actions in 2018 and head higher. If our economic growth and inflation forecast holds, then the FOMC will likely raise rates three to four times in 2018. Unlike in 2017, long-term interest rates will not hold steady, but will also head higher.
Will higher interest rates derail U.S. housing markets? Certainly, a spike like we saw in the spring of 2013 would significantly slow housing market activity. However, we anticipate rate increases will be gradual, allowing housing market activity to maintain momentum. Home sales, housing construction, and house prices will all be modestly higher in 2018 relative to 2017. See below for more on why.
The tax reform bill has the potential to impact U.S. housing markets. By increasing the standard deduction and reducing the mortgage interest deduction, the tax reform bill reduces some of the tax advantages of homeownership. On its own, this would reduce the incentives to own versus rent and on the margin lead to fewer homebuyers. However, you also must consider the impact of higher after-tax incomes and general macroeconomic effects. Our preliminary analysis—we’ll have more to say about this in a future article—indicates that the direct impact of the tax bill on housing markets will be relatively modest.
One way to think about the tax impact on housing markets is to consider the user cost of housing. The user cost of housing reflects the true economic cost of homeownership. A rational economic agent would balance the economic costs of ownership against the cost of renting. If the cost of owning exceeds the cost of renting, the rational economic agent would opt to rent rather than buy. The user cost calculations can be complex and depend upon the details of a household’s tax situation (itemization of deductions, income tax rate, etc.), but when we consider an aggregate user cost equation averaging across households, the direct impact from tax reform is rather small—something on the order of a one-time one percentage point reduction in housing values1.
Even if a one-time reduction of one percentage point hit all at once—and it’s not clear that house prices would react in that way—it would be difficult to measure. Consider that nationally U.S. house prices are currently increasing at a rate of about seven percentage points year-over-year. And in many markets house prices are accelerating rather than slowing. As we have written, housing markets remain severely out of balance; new housing supply is coming online at a rate well below housing demand. In much of the country, the direct impact of the tax reform bill on housing markets will be difficult to see as it phases in amidst rapidly rising home prices.
However, if the tax reform bill results in higher than expected growth and/or inflation picked up more than expected, mortgage interest rates may spike. That would have a significant, measurable, and almost immediate negative impact on housing markets.
What are some of the biggest risks to the Outlook?
Our baseline forecast is sanguine about the path of the U.S. economy and housing markets. But things could go wrong. If they did, how? Let us list three questions here and discuss further below.
- Is another recession on the horizon?
- How will housing markets respond to declining housing affordability?
- How will young adults move the housing market?
Is another recession on the horizon?
It doesn’t appear that another recession is imminent, but signs are accumulating. The economic expansion is getting long in the tooth, and while economic expansions don’t die of old age, as the cycle extends there are more opportunities to sow the seeds of the next recession.
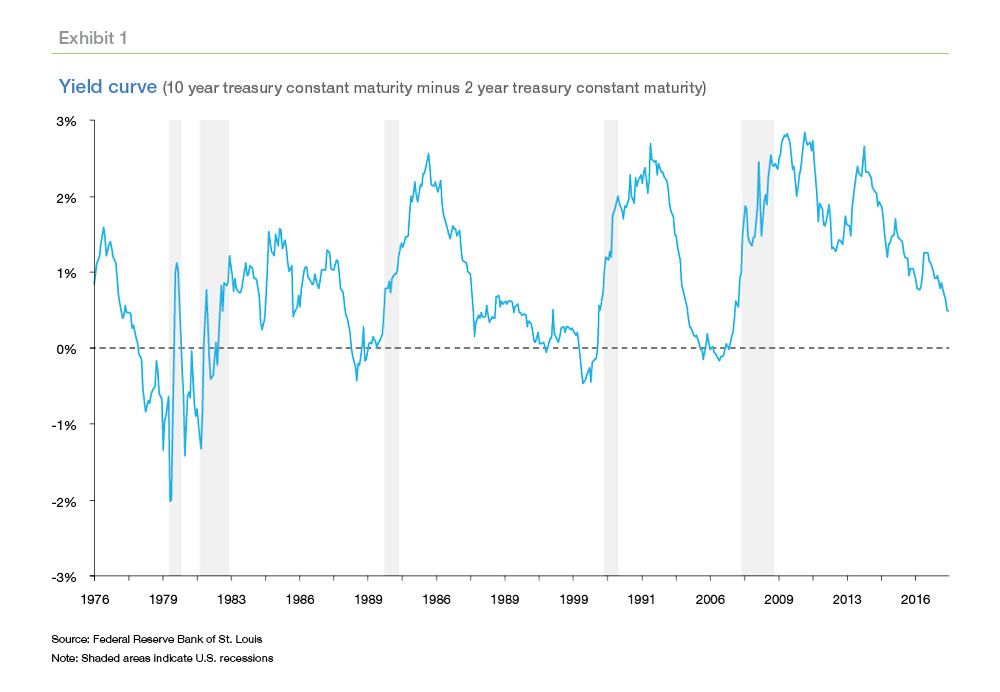
One sign that is often pointed to, that garnered increasing attention late last year, is the slope of the U.S. Treasury yield curve. Generally, the yield on U.S. Treasury securities rises with maturity. For example, a two-year note will yield less than a 10-year note. However, sometimes that relationship inverts, and the 10-year note may yield less than a two-year note. In this situation, banks have difficulty earning profits and generally constrict credit. A recession typically follows. An inverted yield curve is one of the few recession indicators that do a reasonable job of forecasting recession.
Despite the recent flattening of the yield curve, it is not inverted (Exhibit 1). However, financial markets can move swiftly. If the FOMC were to tighten aggressively, but long-term yields remained low (for example, if U.S. and world economic growth prospects did not improve) then the yield curve might invert.
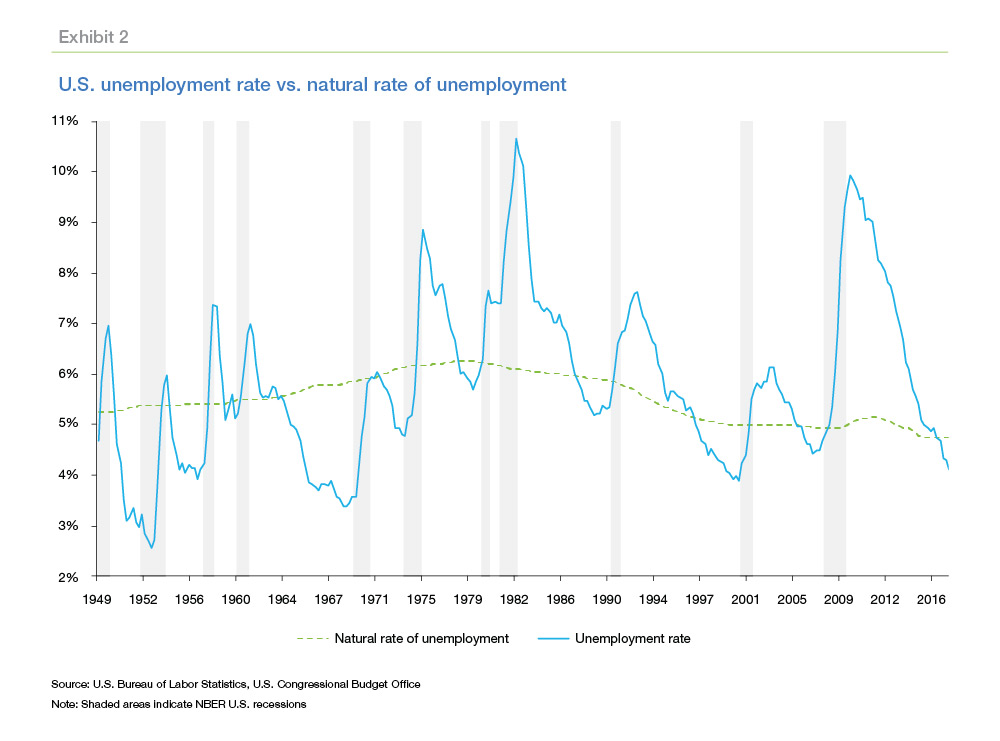
Another sign of a potential recession is an overheated labor market. The current rate of unemployment, 4.1 percent in December 2017, is well below what the U.S. Congressional Budget Office (CBO) estimates to be its natural rate (Exhibit 2). The lack of wage inflation and the slow recovery of the employment-to-population ratio indicate that there is potentially some slack left in the labor market, so signals are mixed. However, history has shown that when the unemployment rate falls below the natural rate for an extended period, a recession typically follows in two to three years.
Although a recession does not appear imminent, we should watch, and not discard, potential recession indicators. For example, if the FOMC goes forward with rate hikes in 2018, do long-term rates increase, or does the yield curve flatten further? If the yield curve flattens further, then our outlook may sour.
How will housing markets respond to declining housing affordability?
Our forecast calls for continued house price growth and a gradual increase in interest rates. While economic growth will remain positive, it will not be strong enough to generate income gains that keep pace with house prices. That means, on balance, housing affordability will decline. How will housing markets respond?
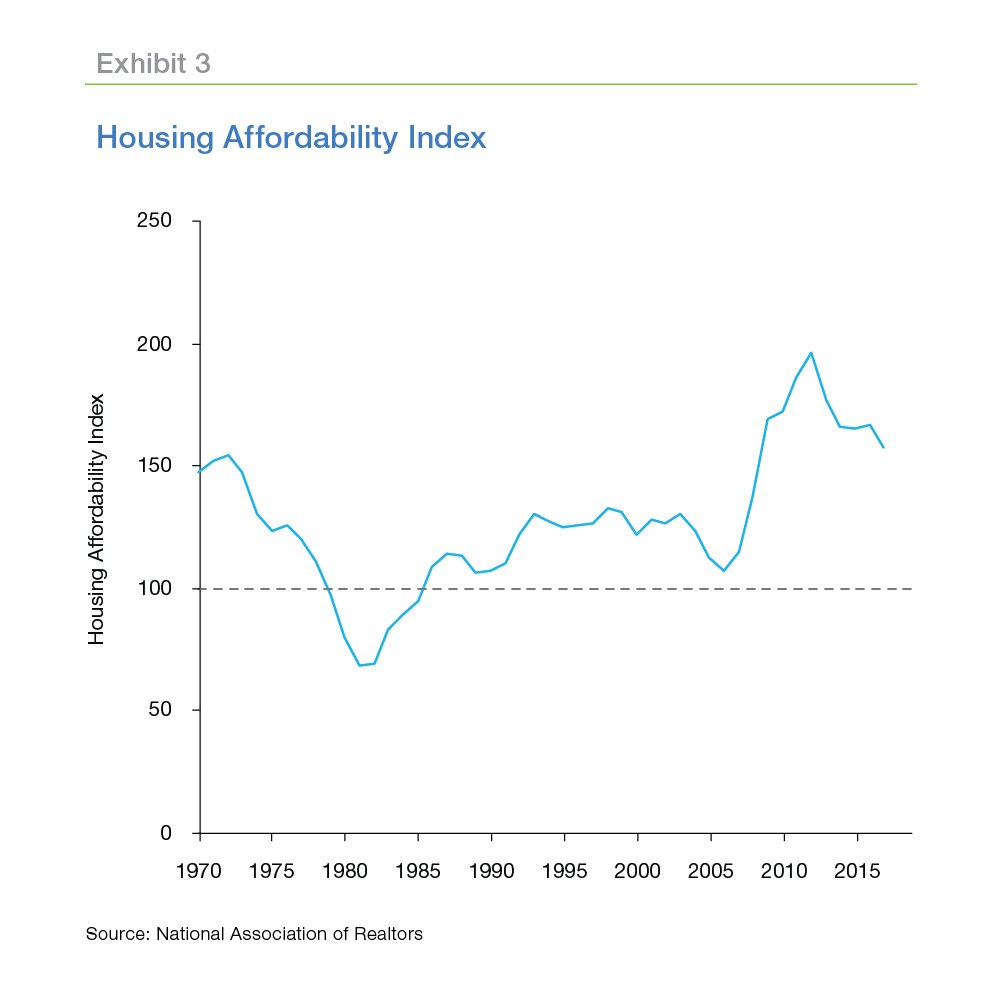
For several years now, primarily due to low mortgage interest rates, the U.S. has enjoyed historically high levels of homebuyer affordability. With home prices increasing nearly seven percent on an annual basis (while incomes are up two-to-three percent at that time), affordability has begun to decline. However, affordability remains quite high.
The National Association of Realtors’ Housing Affordability Index (HAI) reports the ratio of median family income required to qualify for a conventional mortgage on the median-priced home. A value of 100 indicates the median family income is just enough to qualify for the mortgage. Higher values mean the median-income family has more than enough to qualify. Exhibit 2 shows the annual HAI from 1970 through 2017, where the 2017 index is the average through September. The HAI peaked in 2012 and has been generally declining since then, but remains well above its historical average.
With so much pent-up demand, housing markets can absorb higher mortgage rates and higher house prices and still grow the number of home sales. Eventually declining affordability will slow housing market activity. When?
We have already examined this question in some detail. In our July 2017 Insight, "If Housing Is So Affordable, Why Doesn't It Feel That Way?," we discussed housing affordability at the national and local levels. And in November we discussed house price bubbles in "The ‘B’ Word: Can We Spot the Next House Price Bubble?" In 2018, we are going to expand our research on housing affordability, looking at regional trends, the effects of affordability and housing costs on mobility, and how the housing and mortgage market may respond to higher interest rates.
How will young adults move the housing market?
Housing markets can handle higher interest rates and higher house prices (and higher rents) because demographic forces provide a significant tailwind. This assumes that young adults will form households and eventually purchase homes at rates somewhat close to historical averages. Is that a misguided hope? Will young adults move the housing market?
The Great Recession forced a significant number of young adults to move into their parent’s homes. As of 2016, 15% of young adults aged 25-35 were living in their parents’ home, which is five percentage points higher than the rate for similarly-aged Generation Xers in 2000. Eight years into the expansion, young adults are slowly and steadily forming their own households and moving towards homeownership. Per a report by GenWorth, the total number of first-time homebuyers (mostly young adults) was 1.6 million through the first three quarters of 2017—up 8 percent from the same period last year. Thus, the homeownership rate for households under 35 years of age increased 1.4 percentage points from the third quarter of 2016 to the third quarter of 2017.
A variety of factors influence a young adult’s decision to form a household and become a homeowner. As they age, people are more likely to get married, have children and form their own household. In recent years, marriage and fertility rates have declined, contributing to many young adults delaying household formation. Similarly, education, income, and choice of residence are also some key factors that determine a young adult’s likelihood to form a household. Young adults today are more educated; they earn more; and they live in central cities. While education seems to favor young adults, as higher education generally leads to higher income2, central city living can be a drag to household formation as both home prices and rents in central cities are higher and getting pricier.
In our upcoming Insight, we compare characteristics of young adults in the year 2000 to young adults in 2016 and dig deeper into the factors affecting a young adult’s decision to form a household. We present our findings on factors that contribute the most towards forming a young adult household. We also discuss where young adults are headed in terms of forming households under different scenarios.
At a high level, we find that the difference in housing costs explain a large portion of the gap in household formation between 2000 and 2016. Nationally, house prices are higher today than they were at the pre-crisis peak in 2006, and they show no sign of slowing down. Incomes, however, have not kept up and have grown thriftily. In addition with higher education, young adults are accumulating more student debt. With modest income growth, high cost of living and high student debt, young adults are struggling to move out of their parent’s homes and form their own households. If this situation continues, we might have to wait some more years to see solid growth in young adults’ household formation.
Together, household formation and homeownership rates will dictate how much additional demand young adults will provide for the single-family housing market. The hope of many in the industry is that young adults will drive the market forward, and recent data seems to support that notion. But will recent promising trends continue? Check back for our forthcoming research to find out more.
PREPARED BY THE ECONOMIC & HOUSING RESEARCH GROUP
1 Note that this is a national average; areas with higher state and local tax rates could see a larger impact.
2 Higher education can also translate to high student debts, which is often cited as a major reason why young adults are forming their own households later.