


Economic, Housing and Mortgage Market Outlook – January 2024
In this issue
- While the economy continues to expand and added 2.7 million jobs in 2023, signs point to a normalization in the labor market as job growth is expected to moderate in 2024. MORE
- While mortgage rates have moved sideways since mid-December, housing continues to be impacted by higher mortgage rates with total home sales on track to be the lowest since 2012. MORE
- Facing higher borrowing costs, borrowers are paying more discount points to buy down their mortgage rate, but they may not be getting the benefit. MORE
Recent developments
U.S. economy: According to the latest estimate of U.S. economic growth for Q3 2023, the economy grew at a seasonally adjusted annualized rate (SAAR) of 4.9%, slightly slower than the second estimate but still the fastest since Q4 2021— and among the fastest growth in the last 20 years. Consumption spending growth was revised down from a SAAR of 3.6% in the second estimate to 3.1% in the final estimate. This was mainly led by a decline in spending on services but remained the largest contributor to growth at 2.1 percentage points. After nine consecutive quarters of negative growth, residential investment growth came in much stronger than the initial estimates at a SAAR of 6.7%.
The labor market remained much stronger than expected in 2023 and defied expectations of a slowdown. The economy added 216,000 jobs in December, bringing the total jobs added in 2023 to 2.7 million.1 While total jobs added in 2023 was lower than the historical highs of 2021 and 2022, job growth was still remarkable given the high interest rate environment the economy faced. The unemployment rate remained unchanged in December at 3.7% compared to November 2023, but moved up 0.3 percentage points over the year.
While job growth remained significant over the year, some indications of a softer labor market are starting to creep in. The labor force participation rate as well as employment to population ratio decreased 0.3 percentage points over the month to 62.5% and 60.1% respectively. Downward revisions to October and November job growth meant the 3-month average job gain in the fourth quarter of 2023 was the lowest since the third quarter of 2019, if we exclude the 2020 recession. However, the torrid pace of job growth was unlikely to be sustained and employment growth is approaching levels consistent with a balanced labor market. Heading into 2024, we might see a moderation in job growth, which would be more consistent with long-run growth in the U.S. labor force. Job openings edged down slightly to 8.8 million in November 2023, according to the Bureau of Labor Statistics (BLS) Job Openings and Labor Turnover Survey. The ratio of job openings to unemployed, a metric that the Federal Reserve has been tracking to gauge the strength of the labor market, declined from a high of around 1.8 in January 2023 to 1.4 in November.
Inflation continues to trend towards the Federal Reserve’s target rate of 2%. The preferred measure of inflation of the Federal Reserve, the Core Personal Consumption Expenditure (PCE) measure increased at a rate of 3.2% year over year, the smallest annual increase since May 2021.2 While inflation has been moderating as the labor market normalizes, a reacceleration of home prices along with still high average hourly earnings growth at 4.1% year over year, could mean that getting to the 2% target might take longer than expected.
U.S. housing market: The housing market felt the impact of higher rates in 2023 with total annual home sales on track to be the lowest since 2012. Total (existing and new) home sales reached 4.4 million units in November 2023, down 1.2% as compared to October 2023 and 6.2% below November 2022. Total home sales averaged around 4.8 million from January through November 2023. Existing home sales were at 3.8 million as of November 2023 and averaged 4.1 million through November 2023.3 The existing housing inventory grew 15.3% year to date in November but the level of inventory (1.1 million homes available for sale in November) remains extremely low by historical standards.4 The rate-lock effect, which was the main driver of the lack of existing inventory, continued to push buyers towards the new home market. The number of new homes available for sale increased 2.7% year-to-date and was up 2.5% from the previous month. Overall, the sales of new homes averaged 666,000 in 2023 as compared to 637,000 in 2022.5
Falling interest rates have spurred the confidence of both potential homebuyers as well as the homebuilders. The Housing Market Index, which had decreased since August increased in December 2023. While existing home sales increased in November, pending home sales for November were still weak and saw a 5.2% decrease from the previous year. The FHFA Purchase-Only Home Price Index indicated that as of October of 2023, home prices rose 6.1% year to date, and as more home buyers enter the market amidst the lack of inventory, the pressure on prices could increase further.
U.S. mortgage market: Mortgage rates were on an upward trajectory for most of 2023, reaching 23-year highs in October. However, since the last week of October, rates have been declining mainly on the expectation of rate cuts by the Federal Reserve along with easing inflationary pressures. The average 30-year fixed-rate mortgage, as measured by Freddie Mac’s Primary Mortgage Market Survey® (PMMS®), fell almost one percentage point from the last week in October through mid-December. Despite the decline in recent weeks, mortgage rates are 13 basis points higher than they were at the beginning of the year. Mortgage activity also declined with purchase applications down almost 12% in 2023 and total applications down 7% even as refinance applications increased 15% over the year.6
Tighter financial conditions and higher overall interest rates are starting to impact mortgage delinquency rates. Total mortgage delinquency rates were up 0.25 percentage points from 3.37% in Q2 2023 to 3.62% in Q3 2023 according to the MBA’s National Delinquency Survey. The delinquency rate on conventional mortgages increased from 2.29% to 2.5% in Q3 2023 while the delinquency rate of VA loans was up from 3.7% to 3.76% over the same period. The largest increase was in the delinquency rate of FHA loans which increased 0.55 percentage points from 8.95% in Q2 to 9.5% in Q3. Interestingly, serious delinquency rates (90+ DQs) went down across the board between Q2 and Q3. Foreclosure starts increased from 0.13% in Q2 to 0.19% in Q3 2023 but remain low compared to its historical average.
Outlook
The U.S. economy exhibited tremendous resilience last year on strong consumer spending. We expect economic growth to slow this year as consumer spending starts to fade. Under our baseline scenario, with a slowing economy, the unemployment rate will see a modest uptick, and inflation will continue to moderate.
With inflation remaining above the Federal Reserve’s target rate of 2%, we do not expect the Federal Reserve to start cutting the federal fund rates immediately. However, it will continue to pause on interest rate hikes. We expect rate cuts in the second half of the year if the job market cools off enough to keep inflation muted. Under this scenario, we expect mortgage rates to ease throughout the year while remaining in the 6% range.
Falling rates will breathe some life into the housing market with some recovery in home sales. However, home sales are expected to grow only modestly due to a lack of inventory in the market. The demand for housing, however, will remain high based on a large share of Millennial first-time homebuyers looking to buy homes, which will push home prices up. We forecast home prices to increase 2.8% in 2024 and 2.0% in 2025 nationally.
Under our baseline scenario, we expect increases in both purchase and refinance volumes this year and into 2025. On purchase originations, higher home sales and growth in home prices will drive the dollar volumes of purchase originations up. However, we do not expect purchase origination volumes to reach the levels seen in 2021 and 2022 as lack of inventory will limit home sales. The drop in mortgage rates will push refinance originations up, as buyers who obtained higher interest rates in 2023 will likely refinance into lower rates. However, rates remaining around the 6% range will not provide enough refinance incentives to millions of homeowners who currently have rates below 6%. And therefore, we expect refinance volume to grow only modestly this year. Overall, we forecast total origination volumes to improve this year and into the next.
January 2024 SPOTLIGHT:
Declining affordability led borrowers to pay more discount points to buy down rates, but our research suggests it may not be worth it
Mortgage rates, as measured by Freddie Mac’s PMMS®, increased significantly in 2023 compared to the record lows of the past few years. On October 26, 2023, the average 30-year fixed-rate mortgage stood at 7.79%, a 23-year high. Since then, mortgage rates have moderated, but remain high by recent historical standards. These higher mortgage rates led many borrowers to make the decision to pay points in order to lower the rate when purchasing a house or refinancing an existing mortgage. During the low interest rate environment, few borrowers opted to pay discount points when obtaining a mortgage, but as rates started creeping up in the early 2022, we saw more borrowers paying discount points to lower their rate.
Using Freddie Mac closing data, we examined how often borrowers pay discount points and how many points they pay. For this analysis, the points we are focusing on are for permanent interest rate reductions throughout the life of the loan.7 To that end, we looked at a borrower profile that roughly matches our PMMS® population: mortgage for a home purchase or refinance of a one-unit, single-family owner-occupied property with a fully amortizing 30-year fixed-rate mortgage. We further restricted our sample to borrowers with conforming loans, and with credit scores 740 or above and a loan-to-value (LTV) ratio between 75 and 80 (inclusive).
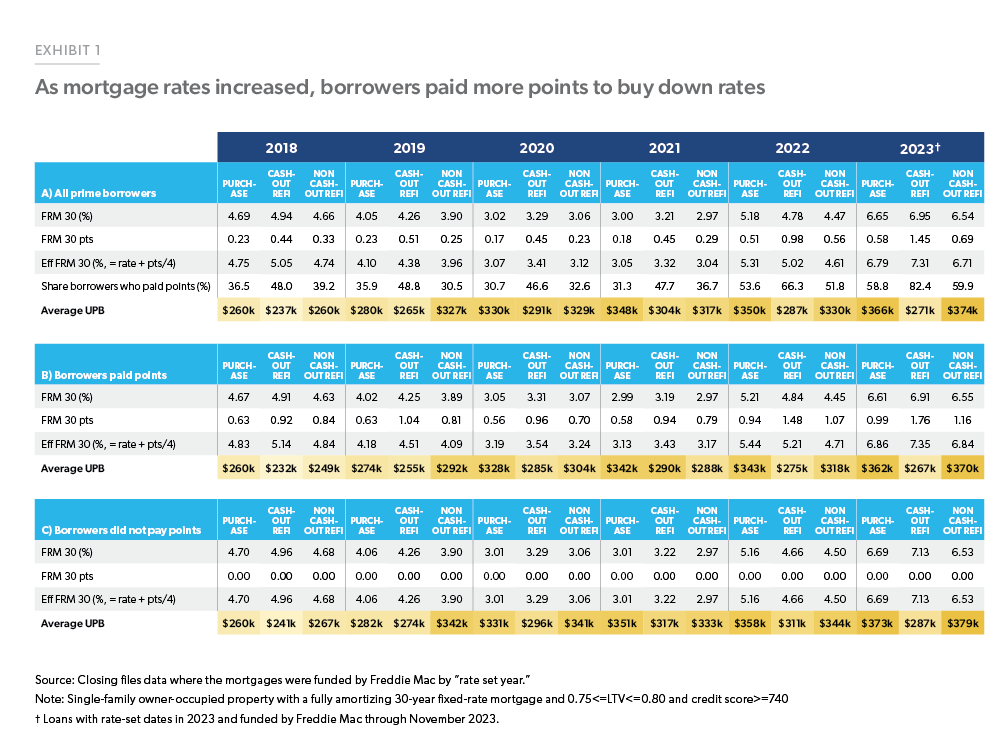
We found that the share of borrowers who paid discount points increased in 2023 (Exhibit 1). For example, about 58.8% of purchase mortgage borrowers paid discount points in 2023, compared to 31.3% and 53.6% of purchase borrowers in 2021 and 2022 respectively. The share paying discount points was higher for noncash- out and cash-out refinance borrowers, 59.9% and 82.4%, respectively. Also, conditional on paying points, refinance borrowers tended to pay much higher points: 0.99 points for purchase borrowers compared to 1.16 and 1.76 points for non-cash-out and cash-out refinance borrowers, respectively.
It is interesting to note, however, that the interest rate differential between borrowers who pay discount points and those who do not pay discount points is very small. Through November 2023, the average effective rate on purchase loans for borrowers who did not pay discount points was 6.69% versus 6.86% for those who did pay points. This result seems to suggest that paying discount points may not be worth it from the consumers’ point of view. Indeed, some academic research8 has shown that in many circumstances paying discount points can be a poor financial decision. However, while our tabulation shows that borrowers who do not pay points generally receive lower mortgage rates compared to similar borrowers who do pay points, we do not control completely for borrower observed and unobserved attributes. Therefore, we cannot say with certainty that for any particular borrower, the relationship between discount points paid and interest rate is negative.9
Enlarge Image
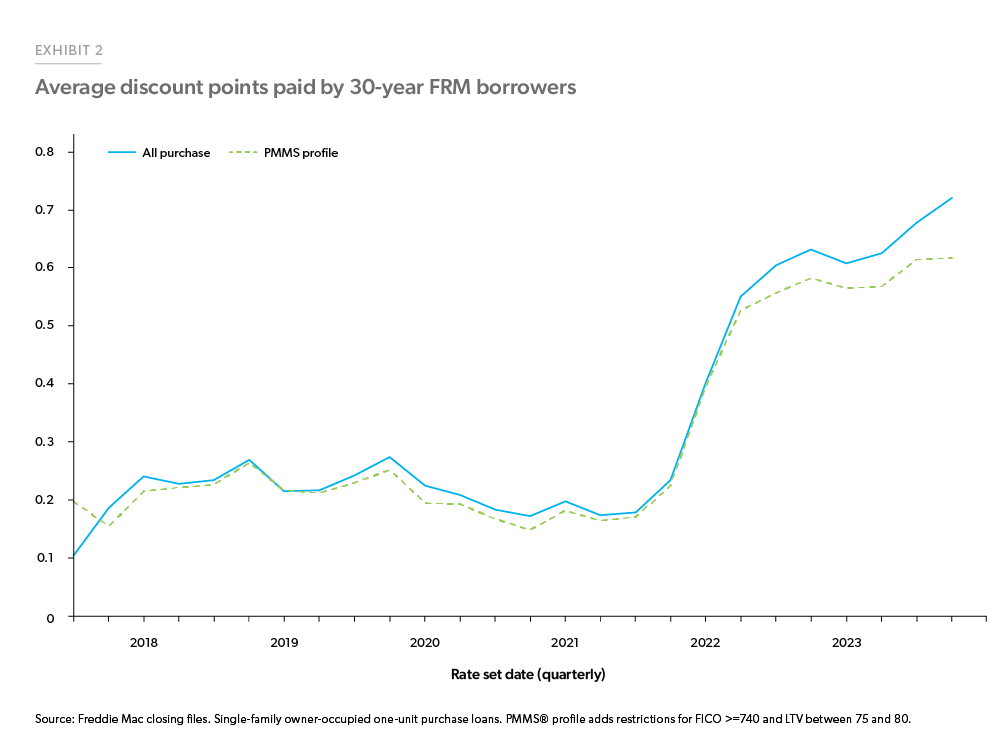
Exhibit 2 compares the quarterly average discount points paid by Freddie Mac borrowers (home purchase, owner occupied, one-unit properties). From 2018 through 2021, borrowers that matched the PMMS® profile, (borrowers with origination LTV between 75 and 80 and FICO score 740 or higher) paid about the same average amount of points compared to all purchase borrowers. Starting in 2022 and continuing through 2023, higher credit quality borrowers tended to pay fewer points compared to all borrowers. In 2023, borrowers that matched the PMMS® profile paid on average about 0.06 less points or about 10% less compared to all purchase borrowers.
Enlarge Image
Prime borrowers who do not pay discount points on average have higher incomes and are obtaining higher loan balances when purchasing a home compared to borrowers who pay points. For example, in 2023 the average loan amount for purchase loans with points paid at origination was $360,000, compared with an average loan amount of $370,000 for mortgages where the borrowers did not pay points. In 2023, the average annual income of a “no discount points” borrower was $148,000, higher than the $140,000 average annual income for borrowers who paid points.
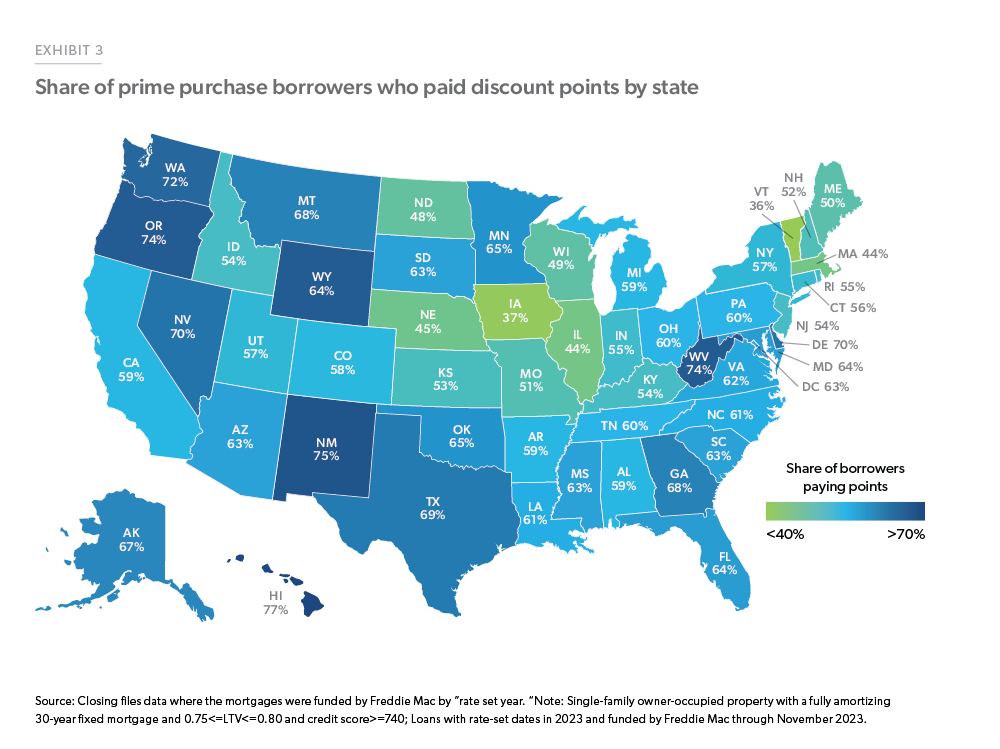
Our analysis on the closing files data shows that there is a difference in borrower behavior across the U.S. when it comes to paying discount points and origination fees. For example, in 2023 over 70% of prime purchase borrowers in HI, NM, WV, OR, WA, and DE paid discount points when closing on their mortgage while less than 50% of borrowers paid discount points in VT, IA, MA, IL, NE, ND, and WI. Exhibit 3 below shows the breakdown by state in 2023.
Enlarge Image
Our analysis shows that mortgage borrowers in 2023 were more willing to pay discount points than in previous years, and that the likelihood of paying points was greater for lower credit quality borrowers compared to the high-quality mortgage borrowers captured in our PMMS® profile population. We also saw that borrowers in the Midwest were less likely to pay points compared to borrowers in the Pacific and Mountain West. If interest rates stabilize in 2024, it will be interesting to observe whether borrowers opt to pay fewer points, or if the recent uptick in paying discount points is a more permanent shift in the mortgage market.
-
Footnotes
1 Non-Farm Employment, Bureau of Labor Statistics
2 BEA
3 National Association of Realtors (NAR)
4 From January 1999 through December 2019 the average number of existing homes available for sale averaged 2.2 million, about double the number of homes available for sale in November 2023.
5 U.S. Census Bureau and U.S. Department of Housing and Urban Development
6 Mortgage Bankers Association (MBA)
7 For an analysis of temporary buydowns see our previous Research Brief: https://www.freddiemac.com/research/insight/20230731-temporary-mortgage-rate-buydown-activity-spiked-in.
8 See for example: Agarwal, S., Ben-David, I. and Yao, V., 2017. Systematic mistakes in the mortgage market and lack of financial sophistication. Journal of Financial Economics, 123(1), pp. 42-58.
9 For a more detailed analysis see: Mota, N., Palim, M. and Woodward, S., 2022. Mortgages are still confusing… and it matters—How borrower attributes and mortgage shopping behavior impact costs. Fannie Mae Working Paper. https://www.fanniemae.com/media/45841/display
Prepared by the Economic & Housing Research group
Sam Khater, Chief Economist
Len Kiefer, Deputy Chief Economist
Ajita Atreya, Macro & Housing Economics Manager
Rama Yanamandra, Macro & Housing Economics Manager
Penka Trentcheva, Macro & Housing Economics Senior
Genaro Villa, Macro & Housing Economics Senior
Lalith Manukonda, Finance Analyst