


U.S. Economic, Housing and Mortgage Market Outlook – February 2024
In this Issue
- The U.S. economy defied expectations of a recession and grew 2.5% in 2023. The labor market remains strong while inflation is trending down, though upside risks remain.
- The housing market continues to feel the impact of higher mortgage rates with home sales at multi-decade lows and starts declining over 2023. Robust demand and a lack of supply have led to a reacceleration in house prices.
- The housing decisions Baby Boomers make over the next few years could have a major impact on the housing market— and on the homeownership aspirations of Millennials and Gen Z. MORE
Recent Developments in the U.S. economy
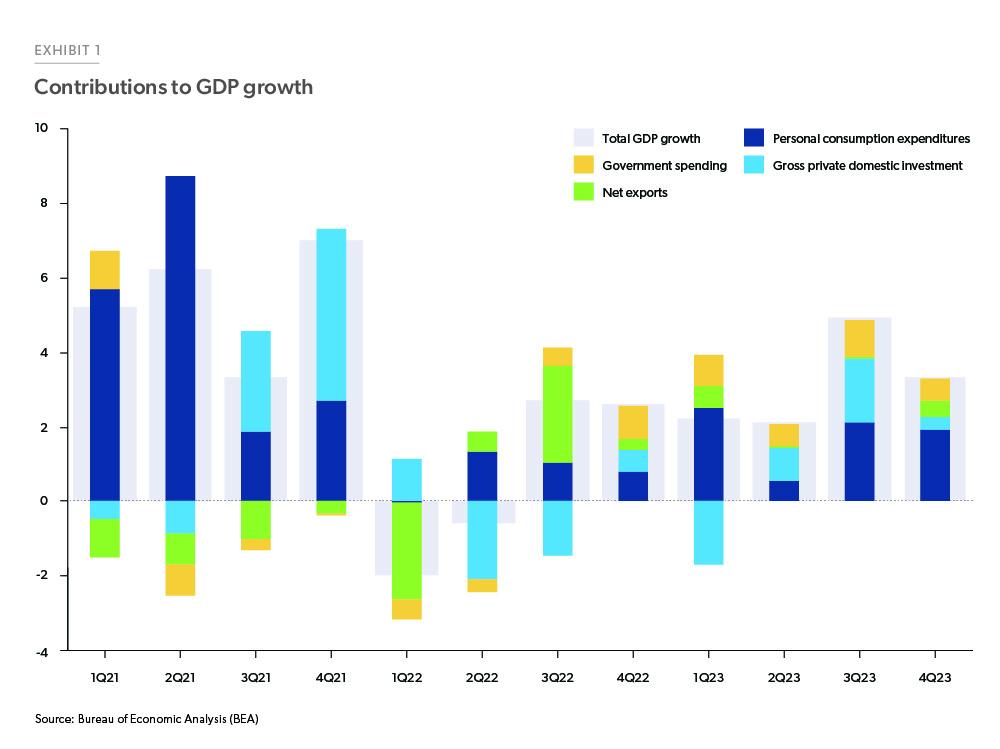
U.S. economy: The economy grew at a much stronger than expected pace during 2023, defying expectations of a recession. (According to economists surveyed by the Wall Street Journal in January 2023, the likelihood of recession in 2023 was around 65%). The year ended on a strong note, with Q4 Real GDP growing at 3.3%, well above the consensus forecast.1 This growth was mainly driven by strong consumption spending, which grew at a 2.8% annualized growth rate in Q4 and contributed 1.9% to the overall growth. Government spending increased 3.3% over the quarter and contributed 0.6% to overall Q4 growth and private investment increased 2.1% and contributed 0.4% to the Q4 growth (Exhibit 1). While residential investment grew at an annualized rate of 1.1% over the quarter, its contribution to the overall growth was negligible at 0.04%. Real GDP increased 2.5% for the full year 2023, up from a 1.9% increase in 2022.
Enlarge Image
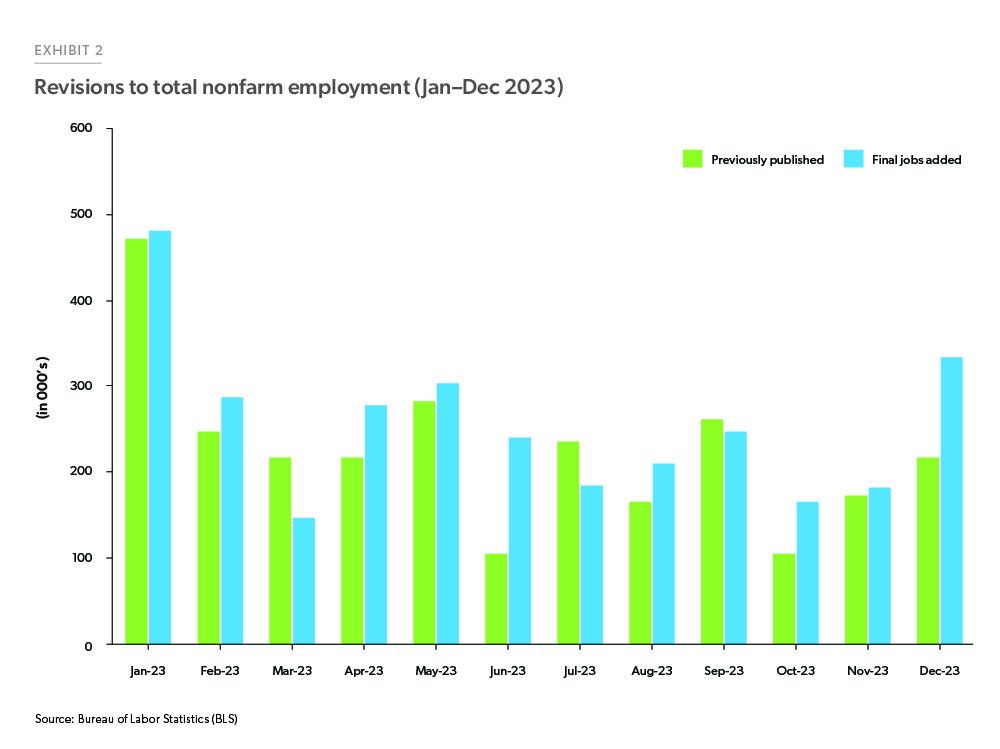
The labor market remains strong with nonfarm payroll employment increasing by 353,000 in January 2024. The numbers for November and December 2023 were revised up by a combined 126,000.2 The unemployment rate remained at 3.7% in January. January’s employment report also had the annual benchmark revisions as well as an update to the household survey based on the 2023 population estimates.3 With the benchmark revisions, total nonfarm payroll was revised up by around 359,000 jobs for the full year 2023.
Enlarge Image
Job openings remained unchanged at around nine million in December 2023, according to the BLS Job Openings and Labor Turnover Survey (JOLTS). The ratio of job openings to unemployed, a metric that the Federal Reserve has been tracking to gauge the strength of the labor market, remained at 1.44 in December. The quits rate remained at a three-year low of 2.2%, likely indicating an approaching slowdown in the labor market. The Employment Cost Index (ECI), a measure of wage pressures in the economy, slowed for the three-month period ending in December 2023 (BLS). This was the third quarter of declines in the index, and the annual increase at 4.2% was the smallest in two years. The easing of wage pressures, if the trend continues, should help with the expected moderation in inflation.
Inflation as measured by core Personal Consumption Expenditure (PCE) rose 2.9% year over year in December 2023 and was at its lowest level since March 2021 with the 3-month annualized rate at 1.5%.4 Core PCE excluding housing, another metric that the Federal Reserve started tracking to gauge progress on inflation, has also been slowing with the December 2023 year-over-year growth at 2.3%. While inflation has been moving in the right direction, there are still upside risks with ongoing wars, supply chain disruptions and banking sector uncertainties. These factors may lead to “higher for longer” rate environment.
Consumer serious delinquency rates (SDQ) went up for the fifth month in a row in December, per the Transunion Industry Snapshot. While Mortgage SDQ rates went up two basis points in December to 0.7%, they were up seven basis points over the year. To put this in context, the average mortgage SDQ from 2010 to 2018 was 3.8%. So, even though mortgage SDQ rates have gone up, they remain low compared to the historical averages.
In summary, the U.S. economy defied expectations of a recession and grew at 2.5% in 2023. The labor market remains strong while inflation is trending down, though upside risks remain.
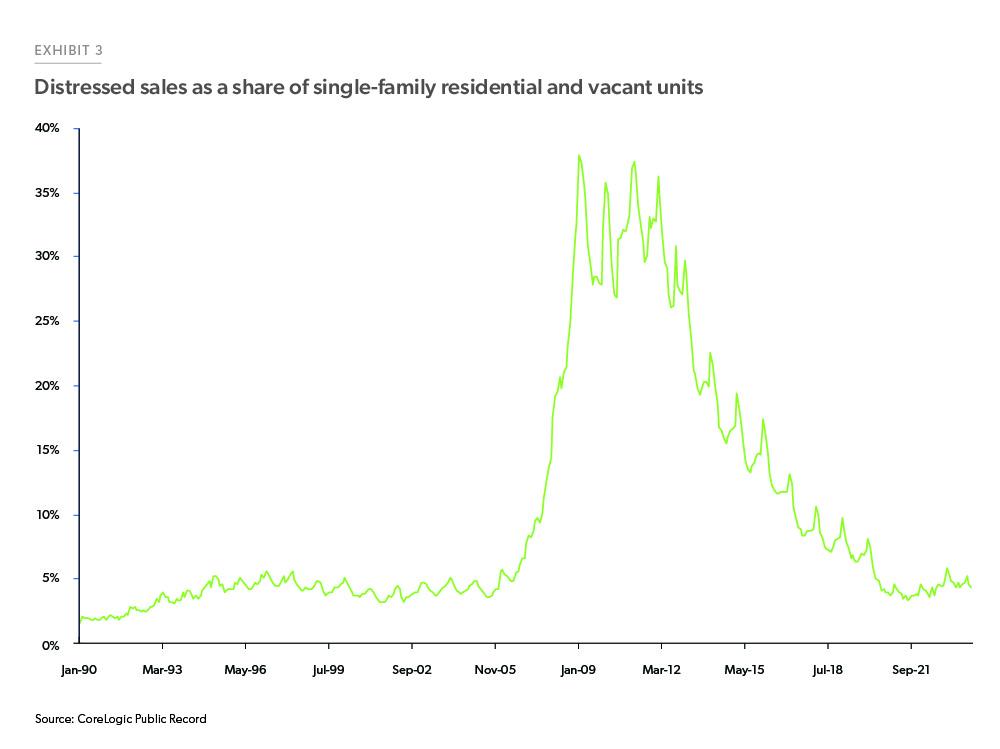
U.S. housing and mortgage market: Total (existing + new) home sales for full year 2023 were 4.8 million, the lowest level since 2011. This decline was led by existing home sales, which came in at 4.1 million, a 30-year low. Existing home sales for December 2023 declined 1% from the prior month to a 3.8 million annualized rate and were down 6% year-over-year.5 The existing housing inventory fell 11.5% from November 2023 and was at one million units at the end of December 2023, representing 3.2 months of supply at the current monthly sales pace. While sales were high during and after the financial crisis, they were led by a high share of distressed sales. Distressed sales’ share reached a high of 38% at the peak of the crisis in 2009. But economic and housing market conditions are much different today. In 2009, the unemployment rate was elevated, house prices were sinking and many homeowners owed much more than their house was worth, while today, the unemployment rate is below 4% and homeowners are sitting on trillions of dollars of equity. Exhibit 3 shows that the share of distressed sales decreased dramatically since the financial crisis and averaged around 5% in 2023.
Enlarge Image
The lack of existing inventory due in part to the rate lock-in effect, as well as incentives offered by builders, attracted buyers towards the new home market.6 New home sales for the full year 2023 were at 668,000, 4.2% above 2022 sales. New homes sales increased despite a reduction in housing construction. For the full year 2023, housing starts were down 9% from the previous year.7 Much of the decline was driven by apartment construction; starts in structures with five or more units was down 14%, while one-unit starts were only down 6%. Even with the slowdown in starts, there remains a substantial number of housing units in the construction pipeline, with the number of new units under construction hovering near a record high in a series that goes back more than 50 years. The pipeline of new single-family units under construction is not nearly as elevated as that for structures with 5+ units.
With extremely lean existing home sales inventory and the supply of new homes unable to fill in the gap, demand continues to outpace supply and the pressure on house prices is unabated. The FHFA Purchase-Only Home Price Index for November 2023 rose 0.3% month-over-month and was up 6.6% year-over-year. House prices continue to outpace overall consumer prices. Since December 2019, the FHFA Purchase-Only index has increased nearly 50%, while consumer prices as measured by the Consumer Price Index have increased by slightly less than 20% over that same period.
Mortgage rates have been volatile over the month of January, averaging 6.6% for the month, as measured by Freddie Mac’s Primary Mortgage Market Survey®. The expectation of rate cuts by the Federal Reserve brought about volatility in the financial markets, including in the 30-year fixed-rate mortgage. The volatility in rates, along with a lack of inventory of homes, led to a decrease in mortgage activity, which declined 13% year-over-year for the week ending January 26th. Refinance activity was up 3% as compared to last year but purchase applications were down 19% year-over-year.8
Overall, the housing market continues to feel the impact of higher mortgage rates with home sales at multi- decade lows and starts declining over 2023. Robust demand and a lack of supply has led to a reacceleration in house prices.
Outlook
Similar to last month, we expect the U.S. economy to remain generally favorable and continue to grow, but at a below-trend pace. Under our baseline scenario, we expect the labor market to cool with a modest uptick in the unemployment rate. While inflation has been moderating, we do not expect the Federal Reserve to start cutting rates until inflation is substantially moving towards the target rate of 2%.
We expect inflation to continue to moderate as the shelter component continues to decline, as indicated by declining rent growth. However, there are some upside inflation risks due to uncertainties surrounding the global macro environment which could result in future supply side disruptions, while the strong labor market may indicate that demand side pressures may abate more gradually than expected. With the current stance of monetary policy holding steady, we expect mortgage rates to move sideways, remaining above 6.5% through this quarter and drifting down to about 6% by year end.
Declining mortgage rates from the 23-year high in October has prompted many prospective home buyers to apply for mortgages resulting in a modest uptick in applications in recent weeks. However, due to limited housing inventory, we expect home sales to grow only modestly despite high buyer demand, especially from the Millennial generation eager to become homeowners. As a result of this elevated demand but limited supply, we expect home prices to increase. We forecast home prices to increase 2.6% 2024 and 2.1% in 2025.
Under our baseline scenario, we do not expect the small decline in mortgage rates to spur significant refinance activity. Similarly, the anemic inventory of homes for sale will limit purchase activity. Thus, it is unlikely that purchase volume will grow notably. However, thanks to growing home prices, we expect a modest recovery in dollar volume of purchase origination in 2024 and into 2025. Overall, our forecast points to a modest improvement in total origination volumes this year and into next. But the pickup in activity in 2024 will happen mostly in the second half of the year. The first half of 2024 should look like 2023 in terms of mortgage activity. If rates move modestly lower in the second half of the year as we expect, activity will rebound, and modest growth will continue into 2025.
Delinquency rates have been trending up from unusually low levels as people cope with higher prices and interest rates. Nevertheless, the trend appears to be just a normalization from unusually strong credit performance early in the pandemic. Because of the strength in the job market, the macroeconomy remains strong enough that we view worsening delinquencies as something to monitor but not indicating that we are heading into a credit event.
FEBRUARY 2024 SPOTLIGHT:
Aging boomers and the impact on the housing market over the next decade
The Baby Boomer generation comprises those born between 1946 and 1964, meaning this year, the youngest of the Boomers will turn 60. As older Boomers reach their golden years, the lifestyle choices they make will have a massive impact on the U.S. economy and the housing market, which is why Freddie Mac has been studying this cohort closely.
Given that the housing market is facing a shortage of available single-family homes, the housing decisions Boomers will make in the coming years will have an outsized impact. Some have warned of a “silver tsunami” as aging Boomers look to sell their homes, flooding the market with inventory. But as this analysis demonstrates, the tsunami is more like a tide, bringing a gradual exit that will mostly be offset by new entrants.
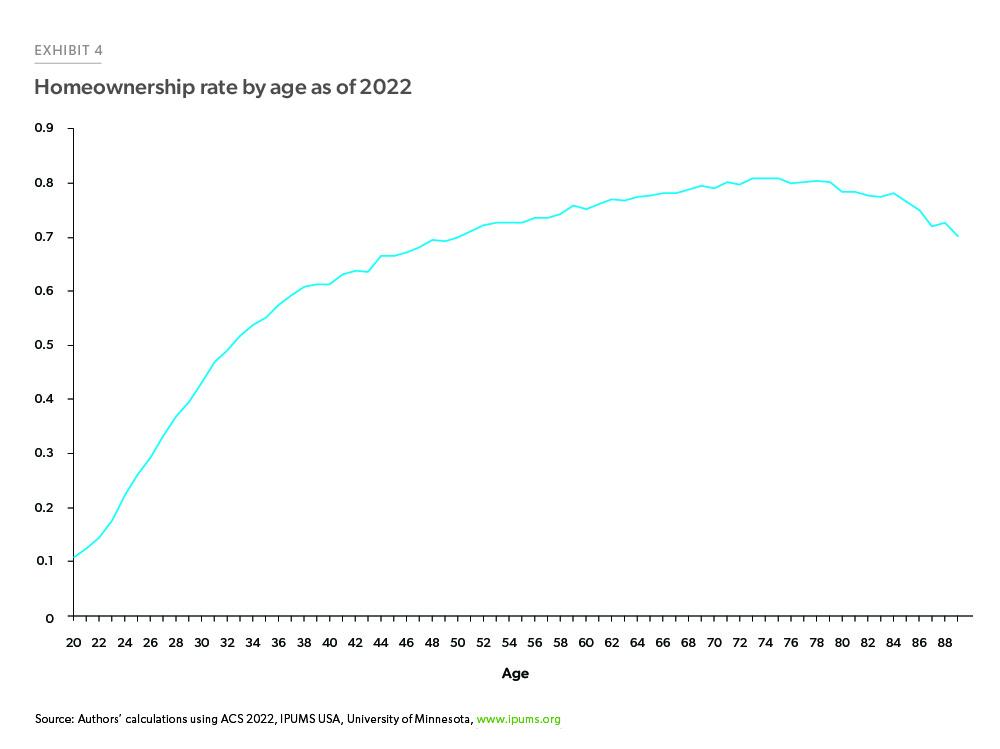
As of 2022 there were 69 million Boomers, accounting for 21% of the U.S. population, and 38% of total homeowner households. Boomers are overrepresented in the homeowner demographic because homeownership rates tend to increase as households age, gradually starting to decline as households age beyond age 75 (Exhibit 4).
Enlarge Image
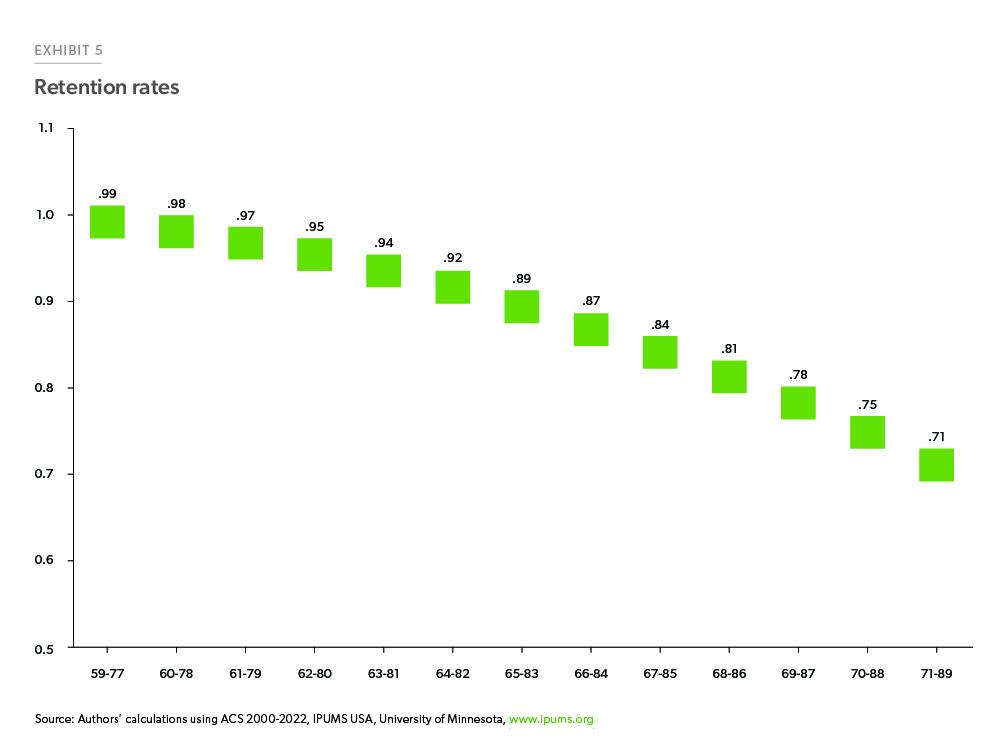
If Boomers follow the pattern of earlier generations and experience declining homeownership rates as they enter their late 70s, how many fewer Boomer homeowner households would that mean? We estimate the number of Boomer homeowner households over the next few years by using the homeowner retention rate concept.9 The retention rate is the share of the number of homeowners in a birth cohort at the end of a period to the number of homeowners in the same cohort at the beginning of the period. Using the American CommunitySurvey (ACS), we estimate the retention rates of the Boomers as they age, assuming that they behave like previous generations.10
As of 2022, Boomers were between 58-76 years of age. By 2035, these Boomers will be between the ages of 71 and 89. We estimate the retention rates of these age cohorts as they age over the period from 2000-202211 (Exhibit 5).
Enlarge Image
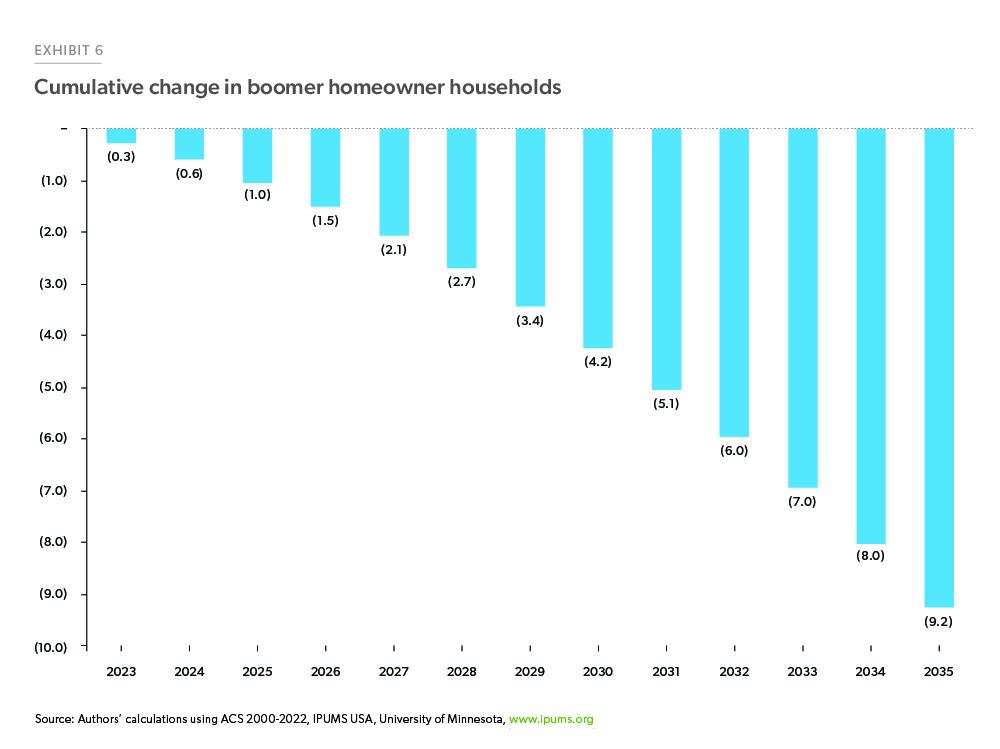
Applying these retention rates to the Boomer households as of 2022, we estimate the number of Boomer households each year through 2035. We find a gradual decline in the number of Boomer households over time from around 32 million in 2022 to 23 million by 2035 as the oldest Boomers reach ages close to 90. Per this estimate, there will be 9.2 million fewer Boomer homeowner households by 2035 (Exhibit 6). Using this method, the projected decline in homeowner households accelerates in the 2030s as the majority of Boomers will be in their 70s or 80s. Over the next five years, the decline is more modest, and we only see a reduction of 2.7 million households by 2028. In this sense, the silver tsunami is more like a tide, with a gradual reduction phasing in over several years. While the number of people aging out of homeownership will increase in the coming years, it is more of an upward sloping trend than a disruptive spike.12
Enlarge Image
However, it is possible that we may see a different outcome. The estimates based on historical retention rates may be too negative. Retention rates have been increasing over time as health outcomes for older Americans improved and life expectancy has increased. If instead of the historical average retention rate, we used the retention rates for the most recent cohorts as of 2022, the cumulative decline in Boomer households by 2035 would be closer to one million less than what we presented in Exhibit 6.
Relatedly, while age will inevitably catch up with us all individually, the population as a whole is renewed by younger generations. In addition to the natural growth from population, there is still a large latent demand for housing. In our October 2023 Outlook, we presented estimates showing that there were as many as two million potential additional households in the Millennial generation. Along with increases from Gen Z, total housing demand over the next few years is likely to continue to increase even as the Boomers continue to exit the market. Over at least the next five years, we expect the increase in the young adult homeowner households to more than offset the decline in Boomer homeowner households.13
Freddie Mac has been studying the Baby Boomer generation for years in an attempt to better understand how their decisions have and will impact the housing market. In addition to this data driven analysis, we’ve also published consumer survey results outlining this cohort’s perceptions and plan to release more research later this year.
-
Footnotes
1 BEA
2 Nonfarm Employment, Bureau of Labor Statistics
3 Every year in January, BLS updates the establishment survey to reflect the comprehensive counts of payroll jobs. These counts are primarily derived from the Quarterly Census of Employment and Wages (QCEW) and the seasonally adjusted data from Jan 2019 are subject to revision.
4 BEA
5 National Association of Realtors (NAR)
6 See our December Spotlight at https://www.freddiemac.com/research/forecast/20231220-us-economy-expanded-in-2023 for details on the size of the rate lock-in effect.
7 U.S. Census Bureau and U.S. Department of Housing and Urban Development
8 Mortgage Bankers Association
9 Dowell Myers and Patrick Simmons. “The Coming Exodus of Older Homeowners.”; Dowell Myers. 2011. “Attrition of Homeownership in California in the 2000s: Now Seeking Generational Replacements.” University of Southern California, Sol Price School of Public Policy.
10 Steven Ruggles, Sarah Flood, Matthew Sobek, Daniel Backman, Annie Chen, Grace Cooper, Stephanie Richards, Renae Rogers, and Megan Schouweiler. IPUMS USA: Version 14.0 [dataset]. Minneapolis, MN: IPUMS, 2023. https://doi.org/10.18128/D010.V14.0
11 For example, the 58–76-year-olds of 2000 were 59-77 in 2001, 60-78 in 2002, etc. So, to compute the retention rates, we take the ratio of the 59-77 homeowner households in 2001 to the 58-76 homeowner households in 2000.
12 For an more in-depth analysis, please see Research Institute For Housing America Special Report Who Will Buy the Baby Boomers’ Homes When They Leave Them?
13 To calculate whether increases in young adult homeownership will be sufficient to offset the projected declines in Boomer homeowners, we apply the retention rates of young adult (25–43-year-old) homeowner households following the same method as applied to Boomers. Using this method, we find that the increases from young adult households are more than the projected decreases from Boomer households through at least 2030.
Prepared by the Economic & Housing Research group
Sam Khater, Chief Economist
Len Kiefer, Deputy Chief Economist
Ajita Atreya, Macro & Housing Economics Manager
Rama Yanamandra, Macro & Housing Economics Manager
Penka Trentcheva, Macro & Housing Economics Senior
Genaro Villa, Macro & Housing Economics Senior