


While Seniors Age in Place, Millennials Wait Longer and May Pay More for their First Homes
Eighty-somethings Al and Rose have no desire to leave their home of decades. Meanwhile, thirty-somethings Alex and Rita can't wait to buy their first home. But they may have to wait longer–and pay more–than they'd like, as long-time homeowners stay in their homes and keep them off the market.
Much attention has focused on the fact that millennials are buying fewer homes than young people did in previous eras. This Insight examines the flip side of this trend: Who is living in those homes that millennials might otherwise have bought? We find that seniors born after 1931 are staying in their homes longer, and aging in place. The result is higher homeownership rates for this group relative to previous cohorts. We estimate that this trend accounts for about 1.6 million houses held back from the market through 2018, representing about one year’s typical supply of new construction, or more than half of the current shortfall of 2.5 million housing units estimated in December’s Insight. This additional demand for homeownership from seniors will increase the relative price of owning versus renting, making renting more attractive to younger generations. However, a shortfall of new construction puts upward pressure on both house prices and rental rates.
Why are seniors holding on to their homes? The pattern is explained by a few key factors, such as better health and higher levels of education in more recent cohorts. This pattern is likely to increase over time as improvements in health care and technology make aging in place easier (for example, the ability to Skype with a doctor).
Exhibit 1 displays the homeownership rates for seniors aged 67 to 85 for two cohorts. We label the first cohort, the “Good Times” cohort.1 Although these homeowners were born during the “bad times” between 1931 and 1941, they have received the advantages of relatively “good times” through their lifetime. The second cohort includes the previous generations for which data are available in the Health and Retirement Survey (HRS) as of 2014: those born before 1924; and the “children of the Depression” born between 1924 and 1930.2
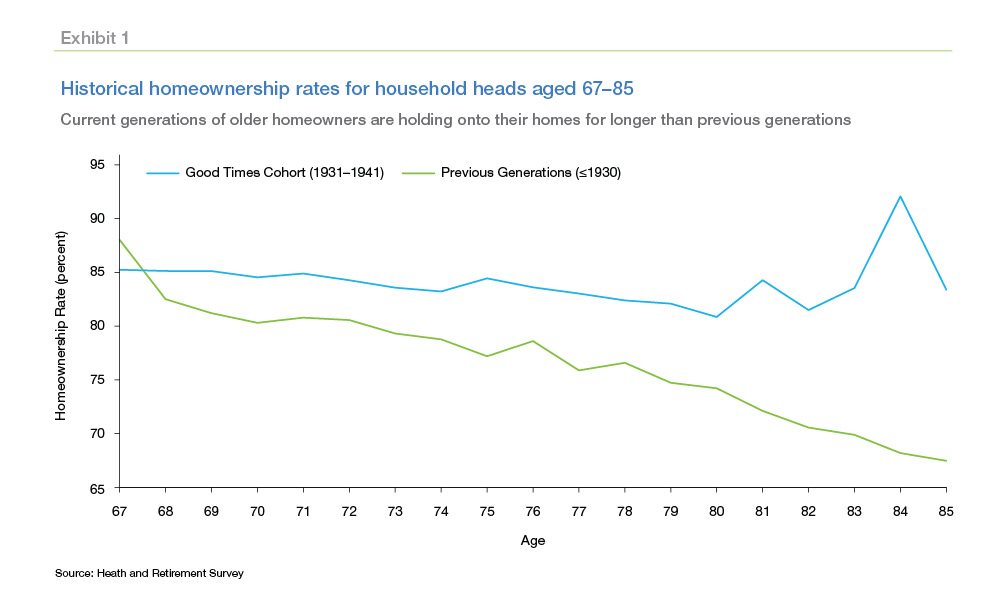
There are significant differences in these two groups in the age in which households cease being homeowners. Starting right after age 67, Good Times households stay in their homes at higher rates. Between the ages of 67 and 82, while the homeownership rate had dropped by 11.6 percent for previous generations, it fell by only 3.6 percent for the Good Times cohort.3 This divergent trend raises an important question: How many housing units have been held off the market as potential housing supply for younger generations by more recent cohorts of senior citizens?
To answer this question, we engage in a thought experiment and evaluate a “counterfactual”: What would have happened if the Good Times cohort had behaved like prior generations? Exhibit 2 calculates how many additional properties would be available if the Good Times cohort had transitioned out of homeownership at the same rate as previous generations. As shown in Exhibit 1, the important divergent pattern starts after age 67.4 Therefore, we use the pattern of previous generations starting at age 68 as a counterfactual scenario to estimate the number of housing units that have been held off the market. This counterfactual scenario helps us answer the question: If the Good Times cohort had transitioned out of homeownership in the same manner as previous generations, how many more properties would be provided to the market as available housing?
We decompose ages 68 to 85 into three groups: 68 to 75, 76 to 80, and 81 to 85. For each age bracket, we calculate the homeownership rates for both the Good Times cohort and the previous generations, based on Health and Retirement Study (HRS) data. As shown in Exhibit 2, even at ages 81 to 85, the homeownership rates for the Good Times cohort are still above 80 percent. By contrast, homeownership rates fell to 71 percent for previous generations. The wedge in homeownership rates between the two groups is as large as 15 percent at ages 81 to 85.
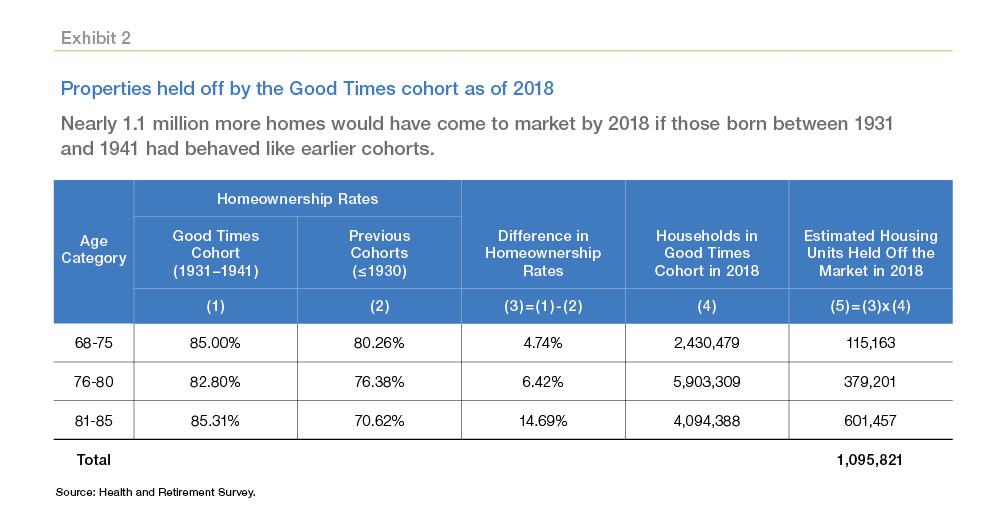
To estimate the number of properties held off the market, we multiply the number of households in 2018 by the generational differences in homeownership rates. We estimate the number of households in 2018 by applying age-specific survival rates to the 2014 estimates from the HRS survey. These estimates suggest that had the Good Times cohort transitioned as previous generations did, there would have been around 1.1 million more housing units available by 2018. Exhibit 2 breaks down the number of housing units by age group, and shows that 115,200 housing units would have been supplied to the market by respondents aged 68 to 75; 379,200 by respondents aged 76 to 80; and 601,500 by respondents aged 81 to 85.5
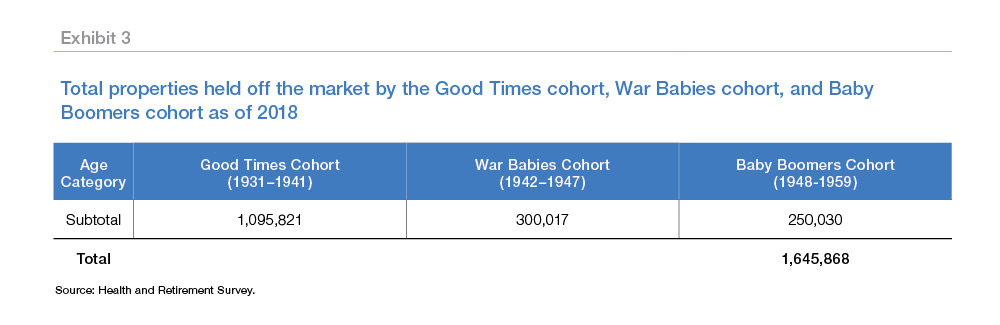
In addition to the Good Times cohort, later cohorts such as “War Babies” (1942–1947) and “Baby Boomers” (1948–1959) are also expected to stay in their homes at higher rates, and thus contribute even more to the number of houses held off the market.6 We make a similar calculation for the War Babies and Baby Boomers and estimate that an additional 550,000 homes were held off the market by these cohorts by 2018, as shown in Exhibit 3. In total, we estimate there were around 1.6 million housing units held off the market by those three cohorts as of 2018. This amounts to 2.1 percent of total owner-occupied housing units in the United States as of 2018.7 In this counterfactual, the seniors that transition from homeownership to renting would free up more owner-occupied housing units, but also would increase demand for rental units.8 Note, the higher propensity of homeownership by seniors would not lead to shortages in those markets with elastic supply because any shortfall would be offset by an increase in the housing stock.9
Despite the weakening of the housing market in 2018, early 2019 data signals a possible turnaround for the year to come. This recent uptick in activity proves that homebuyers are very sensitive to changing rates and will likely respond positively if mortgage rates remain low.
After steadily increasing for years, home prices have finally begun to cool, and while they're still increasing, we expect the rate of growth to slow. The growth rate of the Freddie Mac House Price Index fell slightly to 0.7 percent in the fourth quarter of 2018. We forecast that home prices will increase 4.1 percent and 2.7 percent in 2019 and 2020, respectively.
Conclusion
The most important fundamental in today's housing market is the lack of houses for sale. This shortage has been identified as an important barrier to young adults buying their first homes. This Insight sheds light on one factor that contributes to this shortage: seniors choosing to age in place. Older Americans prefer to age in place because they are satisfied with their communities, their homes, and their quality of life. Economic & Housing Research identified this desire to age in place from research conducted in 2016 using a survey of individuals aged 55 or higher. We estimate that approximately 1.6 million more senior households are staying in place than would have been the case if they behaved like older generations of homeowners. To provide context for this magnitude, the Urban Institute recently estimated that 3.4 million millennials are missing out on homeownership.10 The amount of homes retained by seniors is likely to grow as both the number of seniors increases and the barriers to staying in place are reduced. This highlights the importance of addressing barriers to the production of new housing supply to accommodate long-term housing demand.
Appendix: Detailed Decomposition of Homeownership Rates and Number of Households by Age
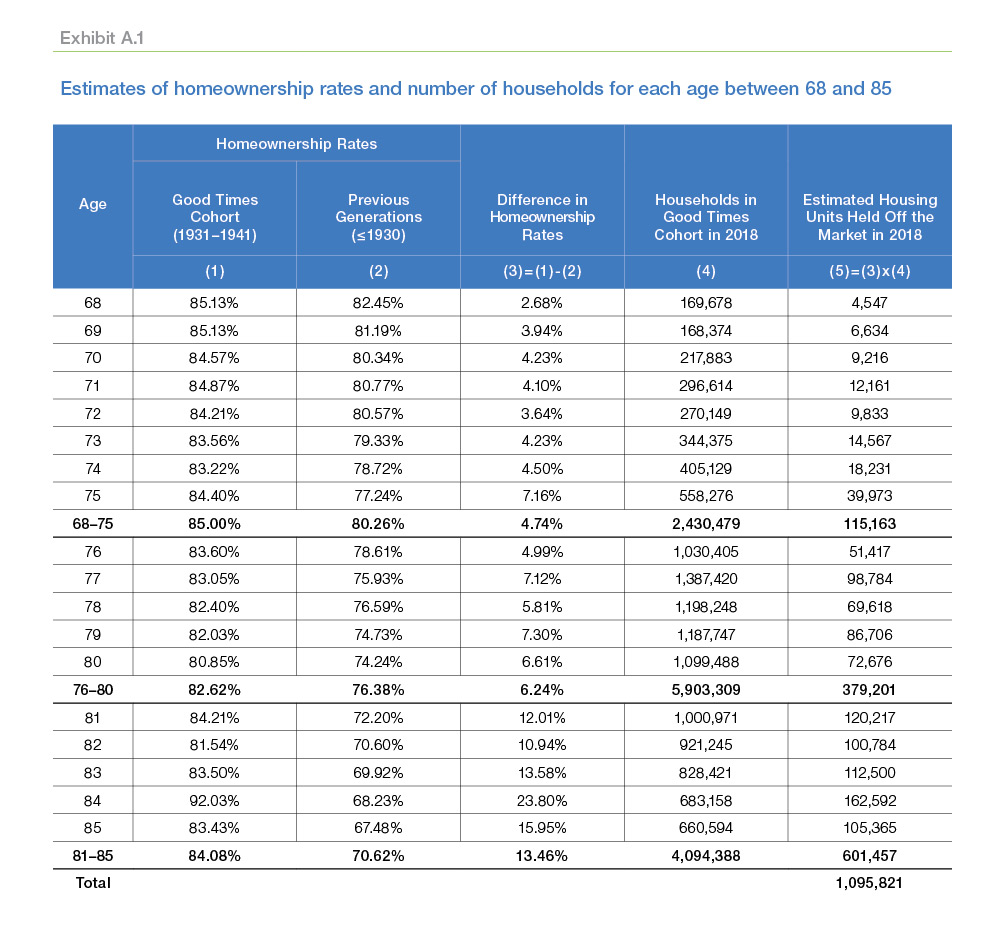
Exhibit A.1 expands on Exhibit 2 by providing estimates on the difference in homeownership rates between the Good Times cohort and the previous generations at each age between age 68 to 85. To estimate the number of homes held off the market by this cohort in 2018, we need to estimate the number of households by age group. For our purposes, the most recent “harmonized” public Health and Retirement Survey (HRS) data are available only up to 2014. To get the estimates on the number of households between age 68 to 85 in the Good Times cohort in 2018, we use the number of households starting at age 64 in 2014, and then multiply the age-specific survival rates based on the Social Security Administration's actuarial life table.11
1 See Harter, C. L. 1987. “The Good Times Cohort of the 1930s.” In Perspectives on Population: An Introduction to Concepts and Issues, edited by Scott W. Menard and Elizabeth W. Moen. New York: Oxford University Press.
2 The Health and Retirement Survey is a national longitudinal dataset funded by the National Institute of Aging and the Social Security Administration that samples households with initial respondents over the age of 50, starting in 1992. The generation is defined by the age of the initial respondent.
3 These data consist of households whose head is a senior. The measured homeownership rate would drop if a homeowning senior moves to a rental unit or is no longer the head of household.
4 We focus on respondents above the age of 67 because there is not an adequate sample size to observe homeownership rates before age 67 for previous generations.
5 Appendix A.1 displays the homeownership rate and number of households estimates for each age between 68 and 85.
6 For information, see the February 2017 Insight, “Can I Age in Place?” http://www.freddiemac.com/research/insight/20170221_age_in_place.html.
7 Data from the Federal Reserve Economic Data (FRED) series. Total owner-occupied housing units estimates as of Q2 2018 is around 77.9 million.
8 Some of this demand would be for senior-specific housing, such as assisted living communities, some of which include homeownership as an option.
9 For a discussion of the importance of supply elasticity in housing markets, see the September 2017 Insight “Is Geography Destiny?” http://www.freddiemac.com/research/insight/20170929_is_geography_destiny.html.
10 See “Urban Wire: The State of Millennial Homeownership” July 11, 2018, by Jung Hyun Choi, Jun Zhu, and Laurie Goodman, https://www.urban.org/urban-wire/state-millennial-homeownership.
11 Social Security Administration 2014 Actuarial Life Table, https://www.ssa.gov/oact/STATS/table4c6.html.
Prepared by the Economic & Housing Research group
Linna Zhu, Ph.D. candidate at the University of Southern California and Freddie Mac Research Intern Doug McManus, Director of Financial Research