


Refinance Trends in 2020
This past year was a busy year for the mortgage market. While the economy was in recession, record low mortgage interest rates contributed to refinance activity reaching near record highs. Many borrowers saved thousands of dollars by lowering their mortgage rate through refinances. This Research Note highlights some of the key trends defining refinance mortgage activity in 2020.
Refinance volume climbs
Despite an economy rocked by the COVID-19 pandemic, mortgage market activity in 2020 increased. With mortgage rates reaching historical lows in 2020, mortgage refinancing activity reached its highest annual total since 2003. There were an estimated $772 billion in inflation- adjusted 2020 dollars in single-family first lien refinances in the fourth quarter 2020. For full-year 2020, there were about $2.6 trillion in inflation-adjusted refinance originations, more than double the volume in the prior year, but still less than the $3.9 trillion in 2003.1
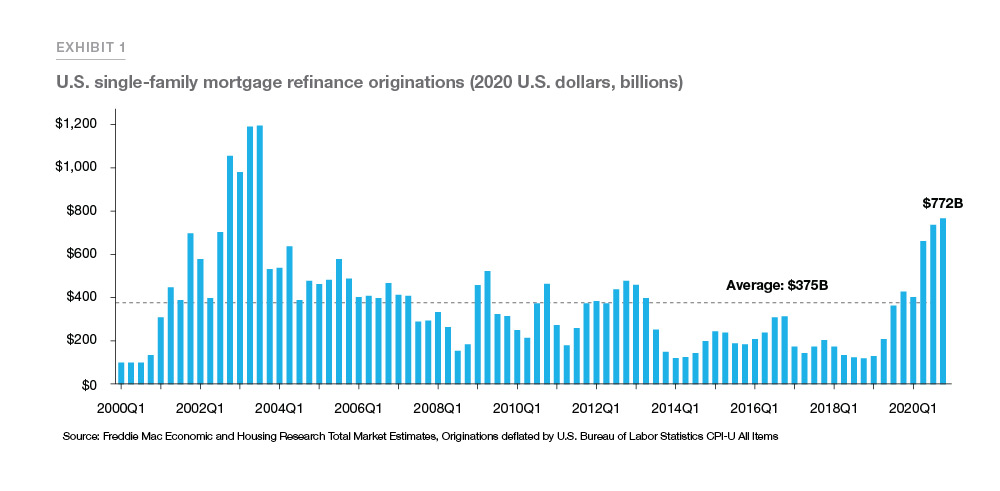
According to Freddie Mac’s Primary Market Mortgage Survey, the 30-year fixed rate mortgage rate averaged 3.1% in 2020, a decline of about 90 basis points from a year earlier. Also, in 2020 house prices rose 11.6% on a year-over-year basis. Homeowners took advantage of record low mortgage rates and increased homeowner equity to refinance their properties, reducing their monthly payments and extracting equity through cash-out refinances.
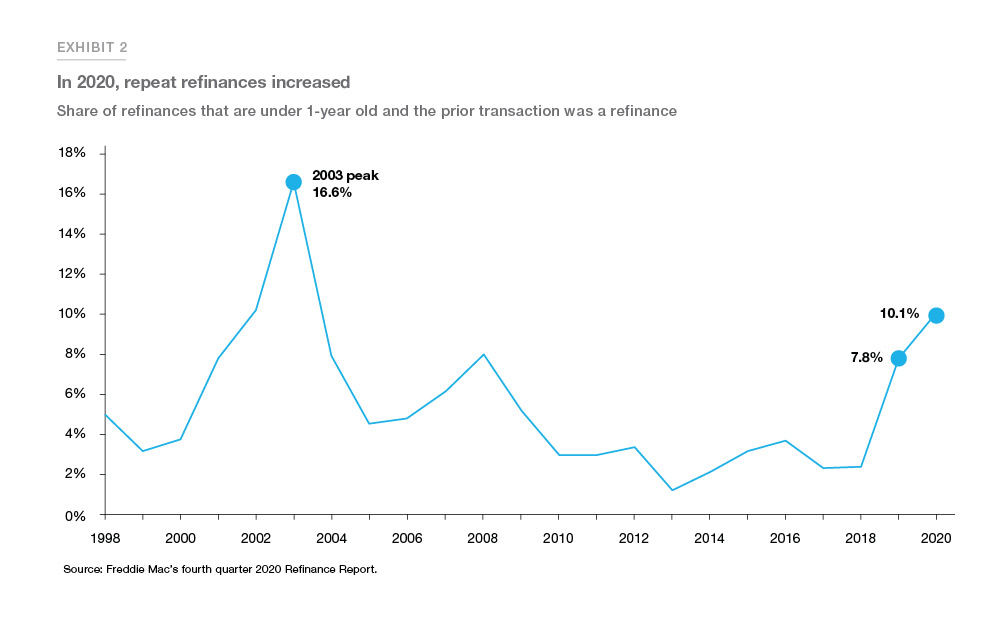
Repeat refinances increased
With mortgage interest rates falling rapidly throughout the year, we saw an increase in repeat refinances. Repeat refinances include loans that were refinanced two or more times within a 12-month period. In 2020, 10.1% of refinances were repeat refinances, up from 7.8% in 2019, but less than the 16.6% in 2003.
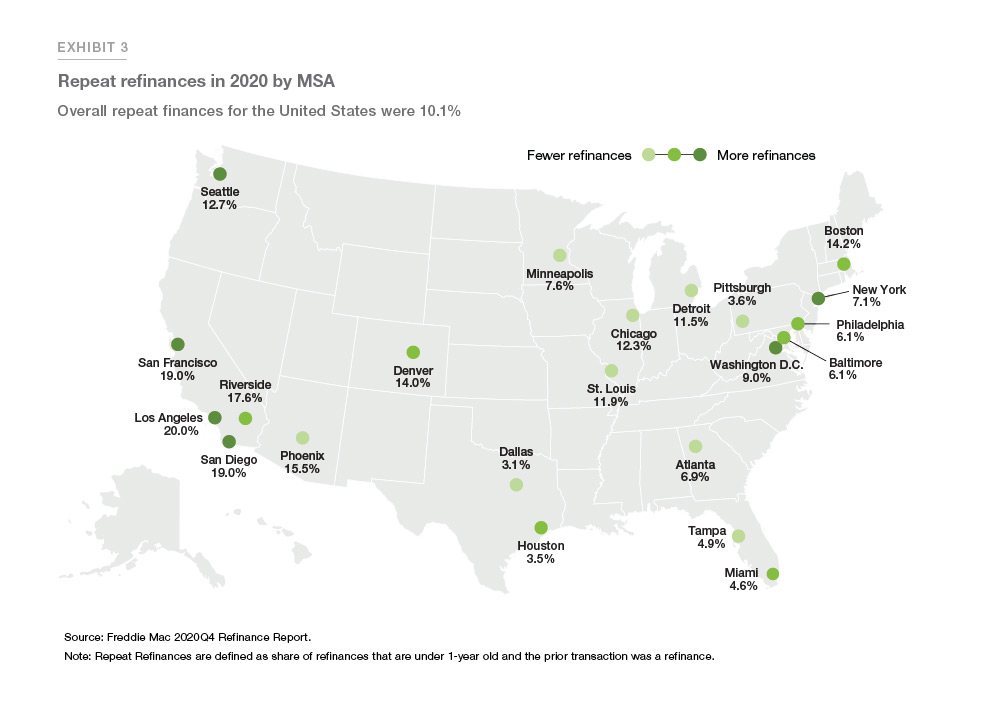
Repeat refinances were much more prevalent in high housing cost metro areas where the average unpaid principal balance of mortgages is higher. In 2020, almost 20% of conventional refinances in Los Angeles-Long Beach Anaheim, CA MSA were repeat refinances while only 3.1% of refinances in the Dallas-Fort Worth-Arlington, TX MSA were repeat refinances (Exhibit 3).
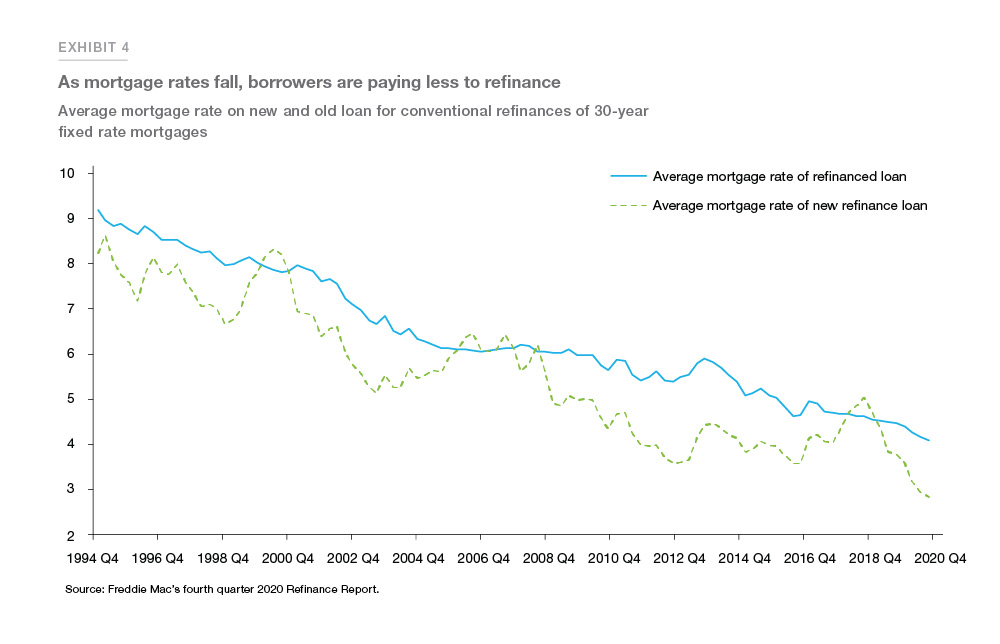
Borrower savings from refinances
On average, borrowers who refinanced their first lien mortgage in the fourth quarter of 2020 lowered their rate by more than 1.25 percentage points, the largest reduction since the second quarter of 2015. A year earlier, refinance borrowers lowered their rate by about 0.70 percentage points, on average. Exhibit 4 compares the average mortgage rate of the old refinanced loan against the average mortgage rate of the new refinance loans for each quarter from 1994 through 2020.
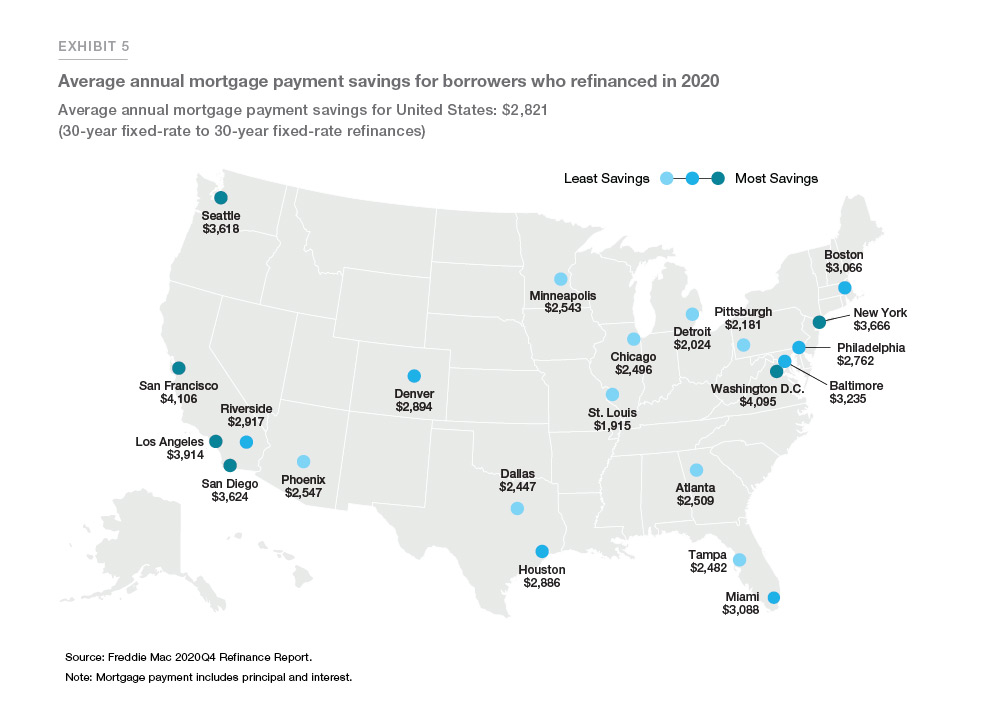
On average, borrowers who refinanced their 30-year fixed rate mortgage to another 30-year fixed rate mortgage to lower their mortgage rate (non cash-out refinancers) saved over $2,800 in mortgage payments (principal and interest) annually by refinancing in 2020. The typical refinance loan in 2020 was a loan for about $300,000 and the borrower lowered their rate from 4.3% to 3.1%.
The amount saved differed significantly by metro area; for example, borrowers in Los Angeles, San Diego, San Francisco, Seattle, and Washington DC metro areas have saved over $3,500 annually in mortgage payments while borrowers in St. Louis and Pittsburgh metro areas have saved about $2,000 (see Exhibit 5).
About one-fourth of refinance borrowers shortened their term
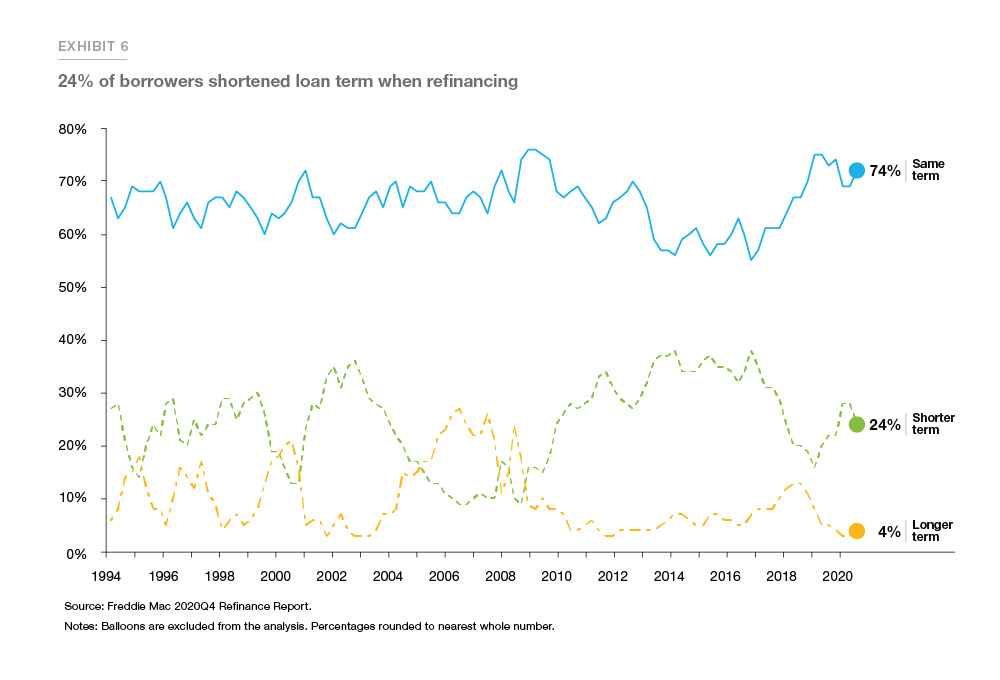
Of borrowers who refinanced in the first quarter of 2020, about 24% shortened their loan term, down from 28% in the prior quarter (see Exhibit 6). The difference between the 30-year and 15-year fixed rate loans averaged 0.52 percentage points. Borrowers tend to refinance into shorter term products when the mortgage rate difference between the longer and shorter-term products is larger. For example, in the first quarter of 2014, the difference between the 30-year and 15-year loan products was 0.96 percentage points—resulting in more than 37% of borrowers shortening their loan term. In terms of product distribution, more than 98% of refinancing borrowers chose a fixed-rate loan. Fixed-rate loans were preferred regardless of what the original loan product had been.
Homeowners are cashing out more
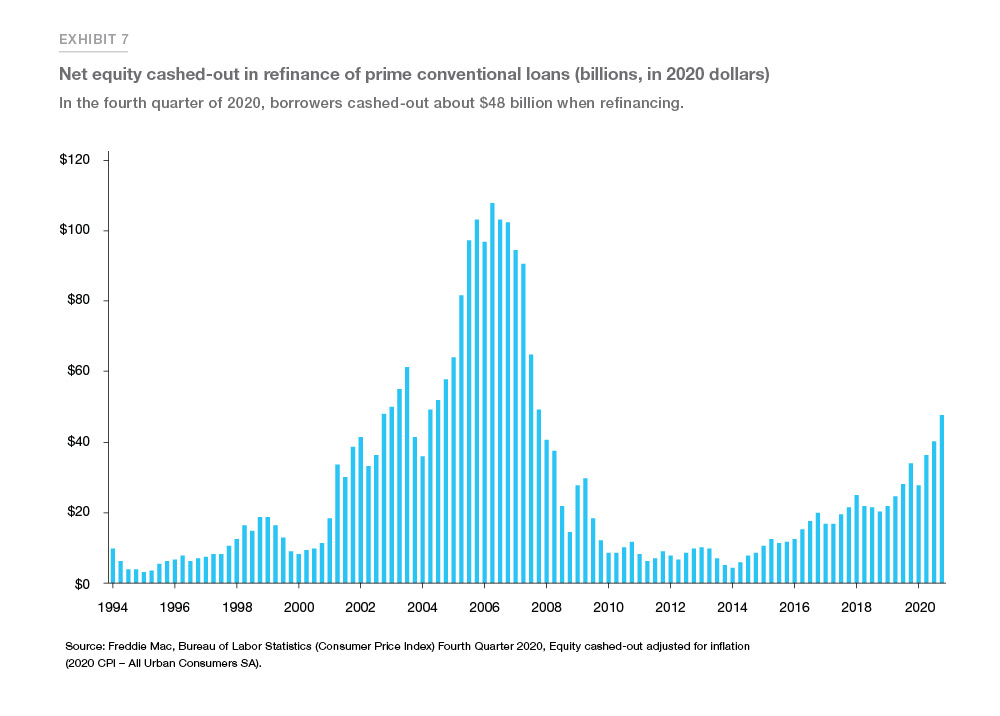
Based on Freddie Mac's Quarterly Refinance Statistics, "cash-out" borrowers, those that increased their loan balance by at least 5 percent, represented 38% of all refinance loans in the fourth quarter of 2020; an increase from the previous quarter, but much lower than the 89% share reached during the third quarter of 2006. The total cash-out volume increased to $48.4 billion but was lower than the volumes reached during the early 2000s housing boom. Adjusted for inflation in 2020 dollars, in the fourth quarter of 2020 an estimated $48.0 billion in net home equity was cashed out during the refinance of conventional prime-credit home mortgages, up from the $34.3 billion a year earlier and substantially less than the peak cash-out refinance volume of $108.1 billion during the second quarter of 2006 (see Exhibit 7).
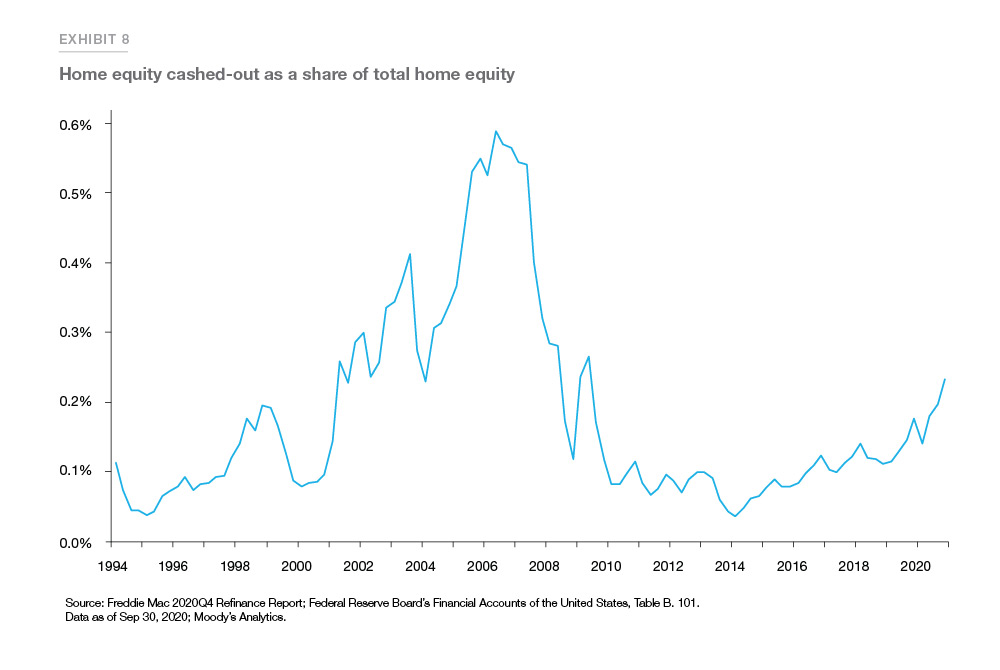
Although equity extraction has increased in recent quarters it is important to keep in mind additional context. Exhibit 8 compares the amount of equity extracted through the refinance of a prime conventional mortgage as a percentage of overall homeowner equity in real estate. In the fourth quarter homeowners cashed out only approximately 0.25 percentage points of available equity through a cash-out refinance, far less that the over 0.5 percentage points extracted in 2006. Our estimates are also conservative in that they exclude non-prime and nonconventional cash-out refinances. The total equity extracted via cash-out refinances including non-prime and non-conventional refinances in 2005 was over $200 billion a quarter, about three times the amount that we estimated for only the prime conventional market.2
Borrowers are paying less points to buy down rates when they refinance
When borrowers get a mortgage loan, they have the option to pay discount points and buy down their interest rate. By paying discount points—expressed as a percentage of the loan amount; i.e. 1 point for a $300,000 would be $3,000—borrowers can lower the rate on their mortgage. The amount of points paid by a borrower can be combined with the contract rate on the mortgage to calculate an effective rate on the mortgage. Typically, analysts assume that one point paid upfront translates to 0.2 percentage points in interest rate, though the borrower’s own translation between rate and points could be different depending on factors such as how much the borrower discounts future cash flows.
Prime conventional rate refinance borrowers (those with FICO score greater or equal to 740, loan-to- value ratio less than or equal than 80%) tend to pay the same effective rate as conventional purchase borrowers, while cash-out borrowers tend to pay slightly higher rate and points. Exhibit 9, Table A below shows the rate and points conventional borrowers paid with rate lock dates in 2018, 2019, and 2020.
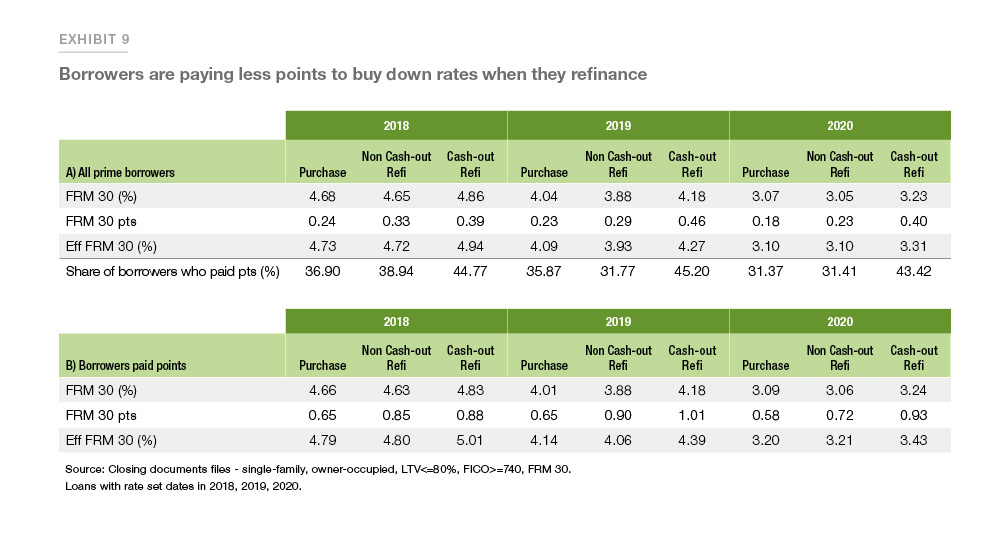
With mortgage interest rates falling so much in 2020, refinance borrowers did not pay as many discount points as in prior years. Lower mortgage rates reduce the amount of interest that borrowers have to pay, so there may be less utility in paying points for an even lower rate. While on average conventional refinance borrowers paid 0.33 and 0.29 points in 2018 and 2019, respectively, average discount points paid by refinance borrowers declined to 0.23 points in 2020. In general, purchase borrowers pay less in points than either cash-out or non cash-out refinance borrowers. The reduction in points paid by refinance borrowers in 2020 was due to both a decrease in the share of borrowers who paid discount points and a decrease in the amount of discount points paid by borrowers who did pay points. Exhibit 9, Table B shows that conditional on paying points, non cash-out refinance borrowers paid 0.72 points in 2020, down from 0.85 and 0.90 points in 2018 and 2019, respectively.
Who saved from refinancing in 2020?
If we compare refinance activity in 2020 to prior recent waves of refinance activity, we see an increase in the refinancing income gap, the difference in refinance activity between low- and high-income borrowers. The research paper "Inequality During the COVID-19 Pandemic: The Case of Savings from Mortgage Refinancing" shows that in the first half of 2020, the difference in savings from refinancing between high- and low-income borrowers was ten times higher than in prior refinance waves. The paper documents that the refinancing income gap was largest in the months hit hardest by the pandemic. Geographically, the counties hit hardest by the pandemic also saw some of the largest refinancing income gaps.
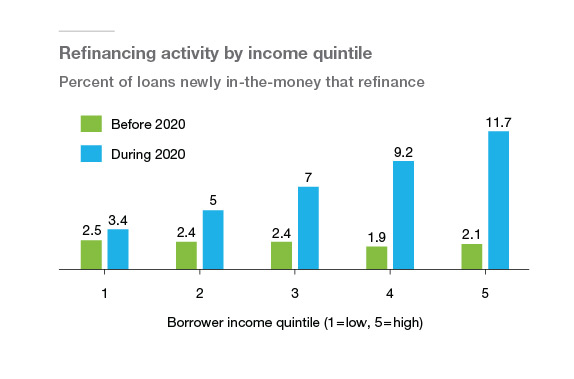
Notes: Refinancing activity is projected based on the coefficients Table 5 of Agarwal, Chomsisengphet, Kiefer, Kiefer and Medina (2020)* using refinancing levels in the bottom quintile of the income distribution before 2020 as the omitted category. The coefficients are estimated with the full set of control variables, and as a result, the projections hold control characteristics fixed at the levels observed on individuals in the bottom quintile of the income distribution.
We say that a mortgage is newly in-the money during a refinancing wave when it was not in-the-money at the beginning of the refinancing wave but becomes in-the-money during the corresponding refinancing wave. We say that a mortgage is in-the-money when it satisfies the conditions outlined in Agarwal, Driscoll and Laibson (2013).
Estimated for recent refinance waves
Before 2020: 2015 wave: 9/2014 – 2/2015, 2016 wave: 4/2016 – 9/2016, 2017 wave: 4/2017 – 9/2017, 2019 wave: 4/2019 – 9/2019, During 2020: 01/2020 – 6/2020
*Source: Agarwal, S., Chomsisengphet, S., Kiefer, H., Kiefer, L. C., & Medina, P. C. (2020). Inequality During the COVID-19 Pandemic: The Case of Savings from Mortgage Refinancing. Available at SSRN 3750133.
Conclusion
With mortgage rates reaching multiple record lows in 2020, refinance borrowers locked in thousands of dollars in savings on average by refinancing, sometimes more than once. Some homeowners also took advantage of the opportunity to tap equity through cash-out refinancing, while others sped up the rate at which they paid down their principal by refinancing into a shorter term. With mortgage rates still near a record low, we forecast that refinance volume will remain strong in 2021. Though there are still many homeowners who could benefit from refinancing their properties, without an unexpected drop in mortgage rates, the volume of refinances will likely contract this year relative to the near-record setting levels we saw last year.
References
1 Even not adjusted for inflation, 2003 refinance originations in nominal dollars ($2.8 trillion) exceeded 2020 ($2.6 trillion).
2 Greenspan, A., & Kennedy, J. E. (2005). Estimates of home mortgage originations, repayments, and debt on one-to- four-family residences. FEDS Paper, (2005-41).
PREPARED BY THE ECONOMIC & HOUSING RESEARCH GROUP