


Has An Urban Exodus Occurred? Residential Environment Trends Shaping the Future of Where We Live
Try entering the phrase “Americans leaving cities during pandemic” into your favorite search engine, and you will likely see the message “About 320,000,000 results” displayed at the top of the page. Did the pandemic signal the beginning of the end for urban revitalization?
As we noted in a previous report, there was an observed shift of home purchases in the last decade, even before the onset of COVID-19, from urban areas to suburbs and rural towns. We went on to link several possible socioeconomic factors driving the ongoing trend of household migration away from urban areas. The present study extends those findings using MLS data collected from January 2000 to May 2021 to address additional changes taking place pre- and post-COVID in the residential environmental preferences of households. While the rising trend of suburbanization and movement to rural areas still holds true, the new data also refutes the notion that urban revival is over—at least not in all cities—by illustrating the heterogeneity of the U.S. housing market across its regions.
Spotlight on last decade’s housing trends
Residential environmental preferences include not only the structural characteristics of dwellings but also aspects of the surrounding neighborhood and natural environment.1 We used the Urbanization Perceptions Small Area Index (UPSAI) tract-level product, introduced in a previous report, to classify each listing in our dataset as urban, suburban, or rural.
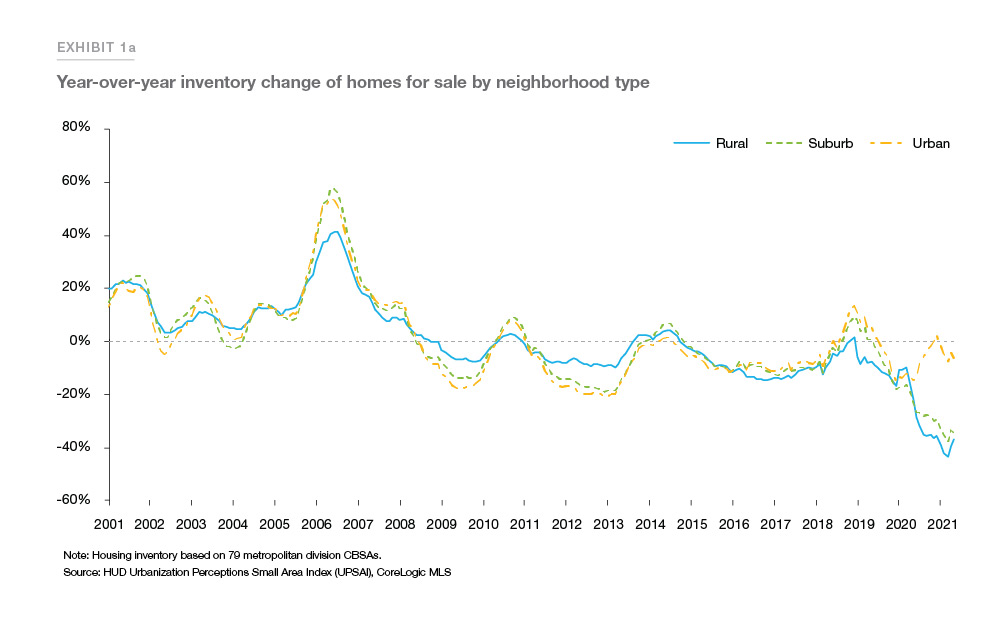
Exhibit 1a shows the year-over-year percent change in the number of homes for sale by UPSAI-classified neighborhood type. A similar pattern of peaks and valleys is present across neighborhood types over the last two decades prior to the pandemic. In June 2020, the tightening of inventory in urban neighborhoods gradually lessened, even as inventory contraction accelerated in less dense neighborhoods. By May 2021, urban housing inventory was down 6% year-over-year, while suburban and rural housing inventories plunged 34% and 37%, respectively, below prior year.
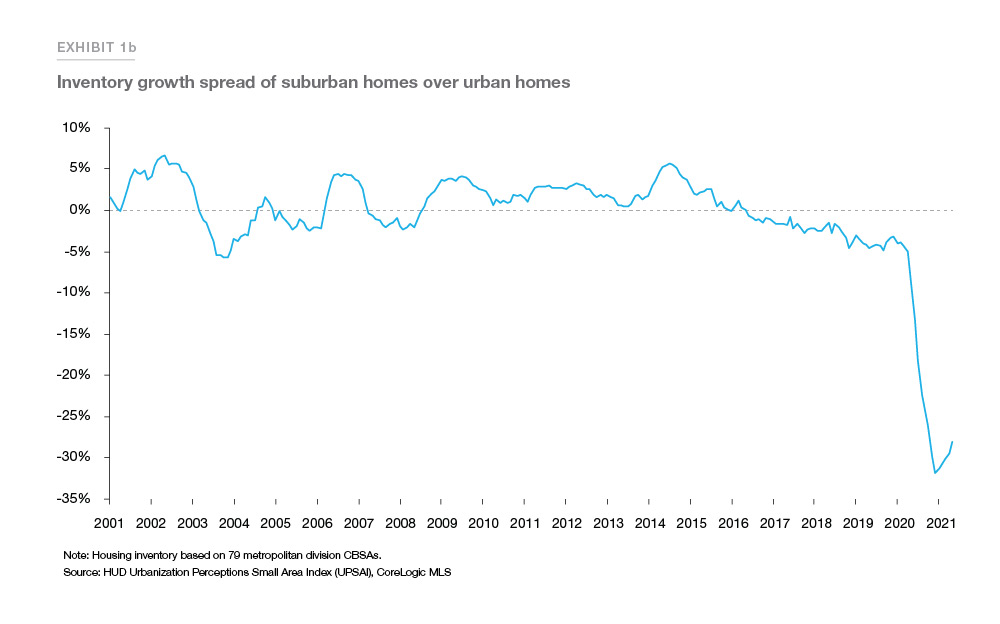
The widening gap between urban and suburban inventory growth depicted in Exhibit 1b is striking. The near-vertical drop-off of spreads in 2020, after slowly drifting downward since 2014, illustrates how the pandemic swiftly accelerated the trend of urban population dispersal that was already underway in the housing market. In December 2020, suburban housing inventory had shrunken 32% more than urban housing inventory year-over-year. Urban demand increased the following spring, narrowing the spread 4% by May 2021.
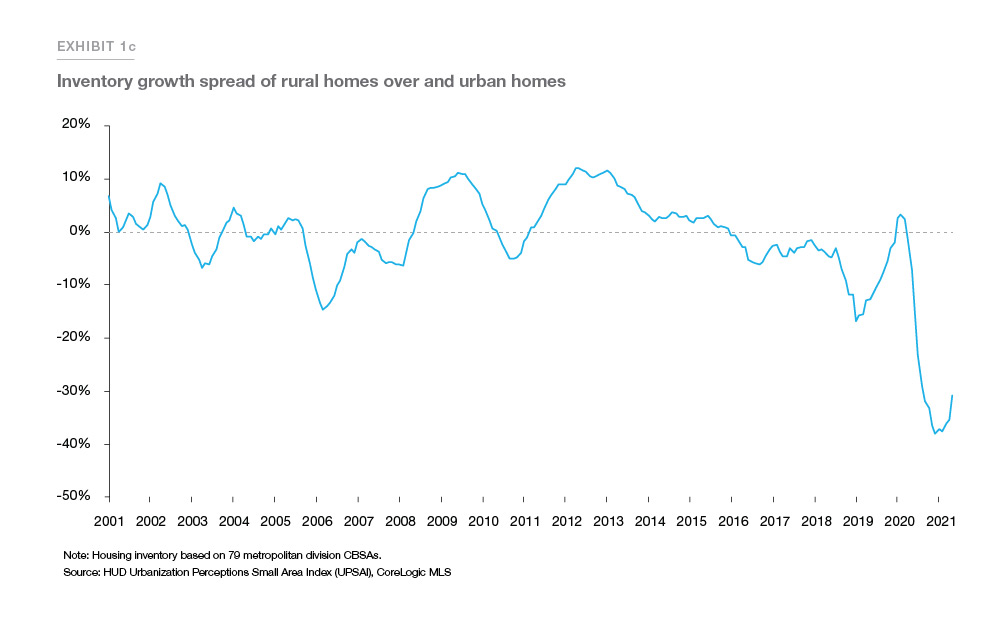
The change in spreads between urban and rural housing over the same time period is even more pronounced. In December 2020, rural housing inventory had shrunken 38% more than urban housing inventory year-over-year, climbing up 7% by May 2021 (Exhibit 1c).
In pandemic’s wake, more households upsizing
Numerous studies have been published examining the factors influencing people’s choice of residential environment. Suburban residents, consisting largely of families with children living at home, prioritize bigger space, enclosed backyards and safer neighborhoods. In contrast, urban residents, more often comprised of young adults and the elderly, exchange spacious living for easily accessible services, abundant amenities, and vibrant entertainment options.2 The pandemic-driven realities of working from home, businesses shutting down, and social distancing have especially diminished—in the short term in any case—the main factors driving residential satisfaction in the "urbanest" of cities. Exhibit 2a shows the year-over-year change in the number of homes for sale by bedroom count. In August 2019, the supply of available homes for sale was falling at similar rates year-over-year across all bedroom counts. Fast forward through 2020, we see evidence of shifting household preferences as many consumers reconsidered the role of homes and the altered landscape of their preferred residential environment.
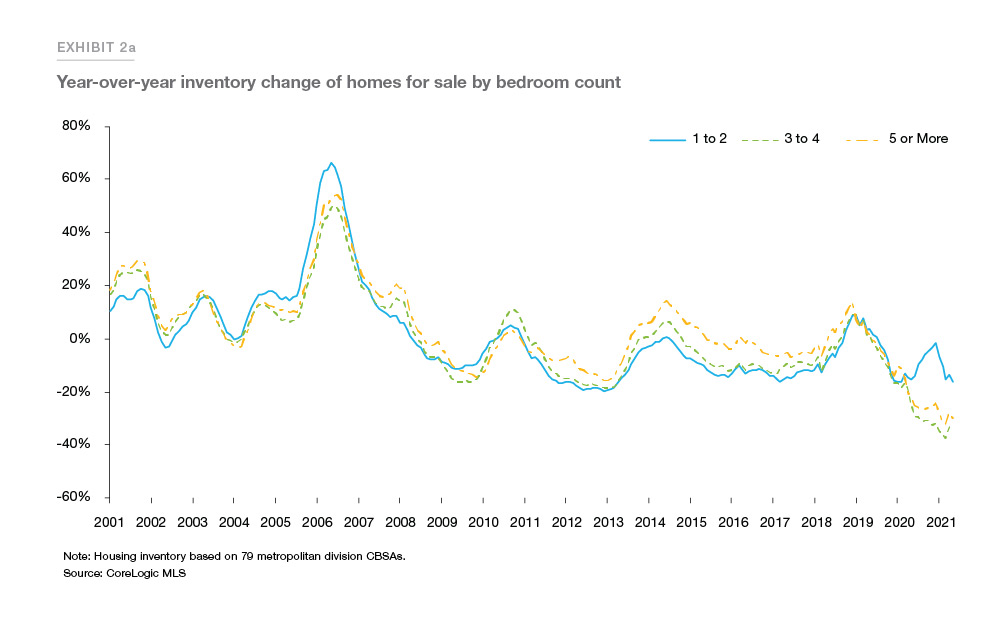
By May 2021, three-to-four-bedroom and five-or-more-bedroom housing inventories were down 33% and 30%, respectively, year-over-year. However, the inventory of one-to-two-bedroom homes—which started increasing month-over-month at the onset of COVID-19—remained at its pre-pandemic level of 16% below prior year. Exhibit 2b further illustrates the pandemic-driven free fall of inventory growth spreads between one-to-two-bedroom homes and three- to four-bedroom homes. Prior to spreads taking a dive in 2020, the available supply of larger homes had already begun to tighten, relative to the available supply of one-to-two-bedroom homes, throughout the latter half of 2010s as indicated by the downward sloping trend lines. It is reasonable to conclude from the data that by the end of 2020, the pandemic had further impacted the residential environment preferences of many additional households, leading rapidly to a 30% inventory growth spread favoring a tighter supply of large homes. By May 2021, the spread had narrowed to 17%.
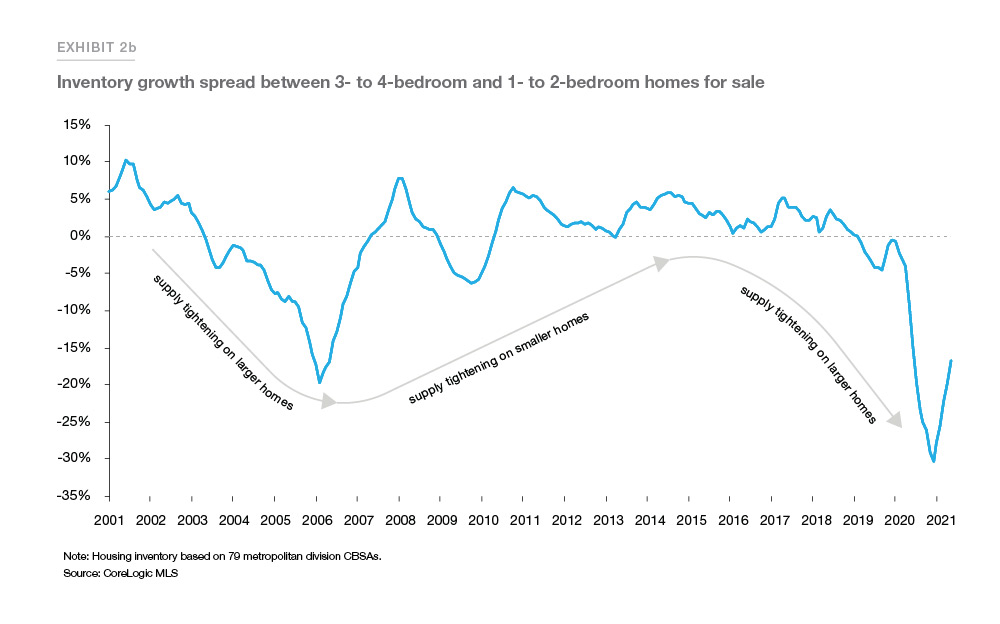
Exhibit 2c shows the recent impacts on home prices from strong shifts in buyer demand coupled with major housing shortages across the country. In May 2021, the median price per square foot of five-or-more-bedroom homes skyrocketed 31% since May 2020, appreciating 5% faster than one- to two-bedroom prices.
The myth and reality of urban flight
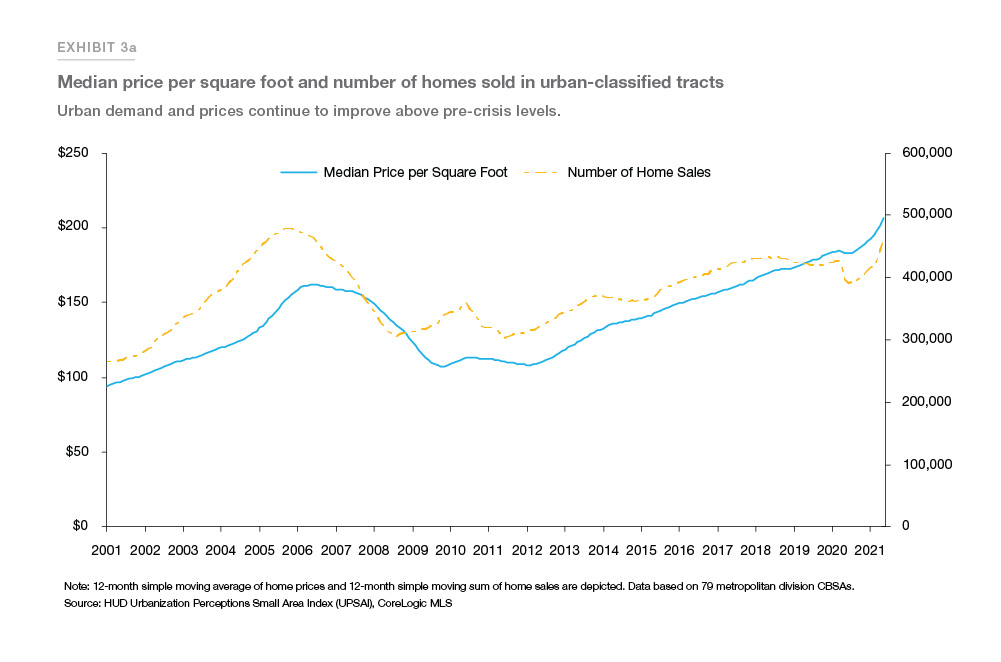
How widespread and prevalent is the urban exodus movement among U.S. cities, especially following the outbreak of COVID-19? Exhibit 3a shows the national median price per square foot and number of homes sold in urban-classified tracts over time. While demand for urban living decreased in 2020, prices and sales overall have recovered beyond their pre-pandemic levels as of May 2021.
Absorption rates—defined as the rate at which available homes go under contract over the period of a month—can serve as an indicator of the balance between supply and demand in markets. Monthly absorption rates over 20% signal a strong seller’s market where demand is higher than supply. It also indicates that the supply of inventory is expected to turn over in less than 5 months at the current sales pace. Since a handful of the nation’s biggest and most expensive cities account for a disproportionately large share of the U.S. urban population (of the 50 most populous cities, six times as many people live in the top ten than bottom ten),3 we need to drill down to specific city locales to have a more granular understanding of exurban migration. Exhibit 3b tabulates monthly absorption rates of urban listings across the nation’s top 50 “urbanest cities”—defined as cities with at least one-third of home sales located in UPSAI urban-classified tracts—ranked by 2019 Census population estimates.
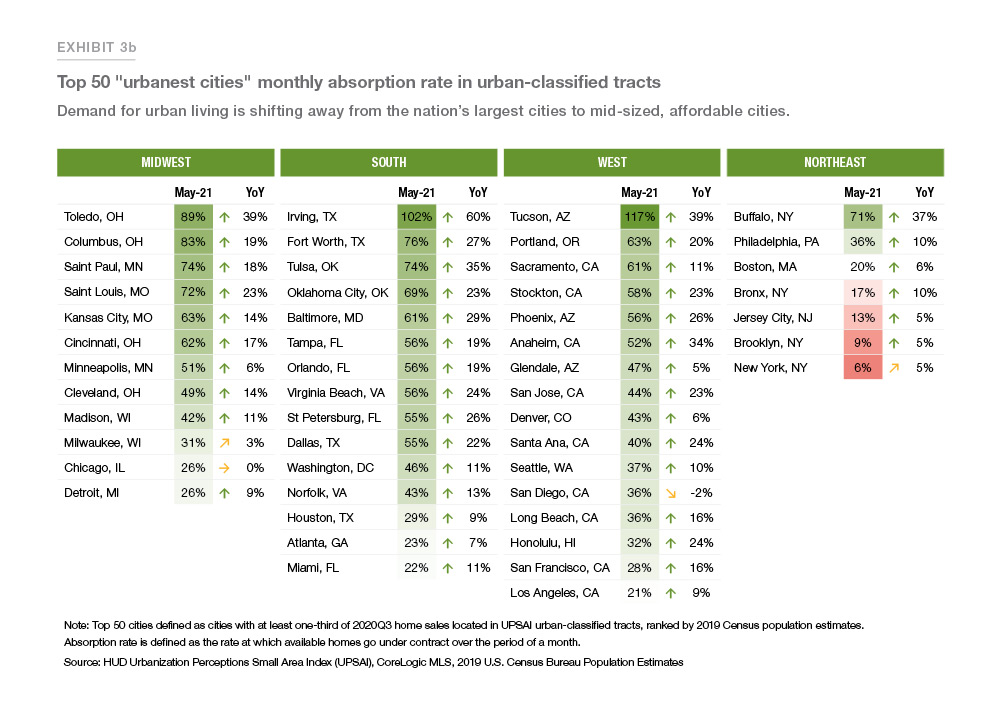
Examining the cities listed in the Northeast, four out of seven cities had low turnover of urban listings in May 2021, with absorption rates below 20%. In contrast, all of the cities listed in the Midwest, South, and West regions had 20% or higher absorption rates in May 2021. Furthermore, the largest cities in each region ranked low in terms of monthly absorption rates, while smaller mid-sized cities had higher inventory turnover. The wide range of absorption rates in the table showcase the heterogeneity of U.S. housing markets, while also demonstrating that demand for urban living still flourishes in mid-sized, affordable cities.
Conclusion
The pandemic accelerated existing migration out of big cities into lower-density communities across the U.S. It also boosted demand for larger homes and increased residential mobility across neighborhoods. What it did not do was bring about the end of urbanization. Empirical analysis of recent MLS data shows urban housing markets have made a strong recovery with sales and prices still improving as of May 2021. While overall urban demand remains firmly in place, demand is shifting to urban areas in more affordable cities across the Midwest, South, and West.
References
1 Menchik M. Residential Environmental Preferences and Choice: Empirically Validating Preference Measures.
Environment and Planning A: Economy and Space. 1972;4(4):445-458. doi:10.1068/a040445
2 Sylvia J.T. Jansen (2020) Urban, suburban or rural? Understanding preferences for the residential environment,
Journal of Urbanism: International Research on Placemaking and Urban Sustainability, 13:2, 213-235, DOI: 10.1080/17549175.2020.1726797
3 According to U.S. Census Bureau data for the top 50 cities in the U.S., ranked by 7/1/2019 population estimates.
PREPARED BY THE ECONOMIC & HOUSING RESEARCH GROUP
Sam Khater, Chief Economist
Kristine Yao, Macro Housing Economics Director