


Multifamily 2018 Outlook

Performance in the multifamily market remained healthy in 2017. Strength in the multifamily market is expected to continue into 2018, but with slight moderation.
- Multifamily performance moderated throughout 2017 but, by most measures, remained strong despite the high levels of new supply. While results across markets were mixed, the overall trend remained the same: Rents and prices are up but moderated, and vacancy rates slowly increased as more new supply is delivered.
- The trend will continue through 2018 as completions peak and supply increases slightly faster than demand. Vacancy rates are expected to continue their upward trajectory at the national level and in most metropolitan areas, but the majority will remain below their historical averages. Rents will continue to grow at current levels due to a healthy labor market and lifestyle preferences, creating demand for multifamily units.
- Freddie Mac predicts that multifamily originations will set another record in 2017 and 2018, but the growth rate will be slower than in the past few years. Rising interest rates through 2018 will cause capitalization rates to increase slightly, which will put downward pressure on property price growth and slow origination volume. But strong economic growth and multifamily fundamentals will continue to create investor demand for multifamily investments.
2017 in Review: Growth Continued with Slow Moderation
Although the multifamily market has been moderating since the cyclical peak in 2015, it remained strong in 2017. Vacancy rates continued their upward trend throughout the year, but less sharply than originally anticipated, which allowed for stronger-than-expected rent growth. Construction delays over the last few years have slowed unit completions, generally giving demand time to absorb most of the new supply. The slower the new supply is released to the market, the less dramatic the impact to vacancy rates and rent growth. Because dynamics vary across individual metros, new units have been entering some markets faster than demand can absorb them.
The key economic factor driving housing demand is the labor market. The unemployment rate was 4.1 percent at the end of December, down 60 basis points (bps) since the end of 2016. The economy added on average 170,000 jobs per month throughout 2017, for a total of just over two million jobs during the year. While fewer than the prior two years, this pace of growth represents a healthy labor market. Furthermore, the slower job growth last year is not alarming; growth at the high levels seen in the years following the Great Recession was unsustainable over time. The economy has regained all job losses from the recession and then some, which will naturally slow employment gains. With the economy near full employment, we don’t expect employment to grow faster than population growth for an extended period of time.
Getting to full employment was a long, slow process, but wage growth has been even more sluggish. It is, however, moving in the right direction. At the end of the third quarter 2017, the Employment Cost Index (ECI) reported annual total compensation growth of 2.5 percent, the second-highest growth rate since the Great Recession and the sixth consecutive quarter of income growth above 2.2 percent. Furthermore, wages are increasing at the same rate in goods as well as service industries – a good sign that most workers are benefiting.
With the economy adding jobs at a good pace and moderate wage growth, household formations are growing, but more slowly than in the previous few years. As of the third quarter 2017, 620,000 new households were formed over the past year. While full year data is not yet available, owner household formations outpaced renter household formations so far in 2017. If the trend holds for the full year, it will be the first time since 2006 that more owner households than renter households formed. In fact, total renter households – including single-family and multifamily – saw a reduction over the past year by 150,000, while owner households were up 770,000. As a result, the homeownership rate rose to 63.9 percent in third quarter, increasing 20 bps over the last quarter and 40 bps over the last year.
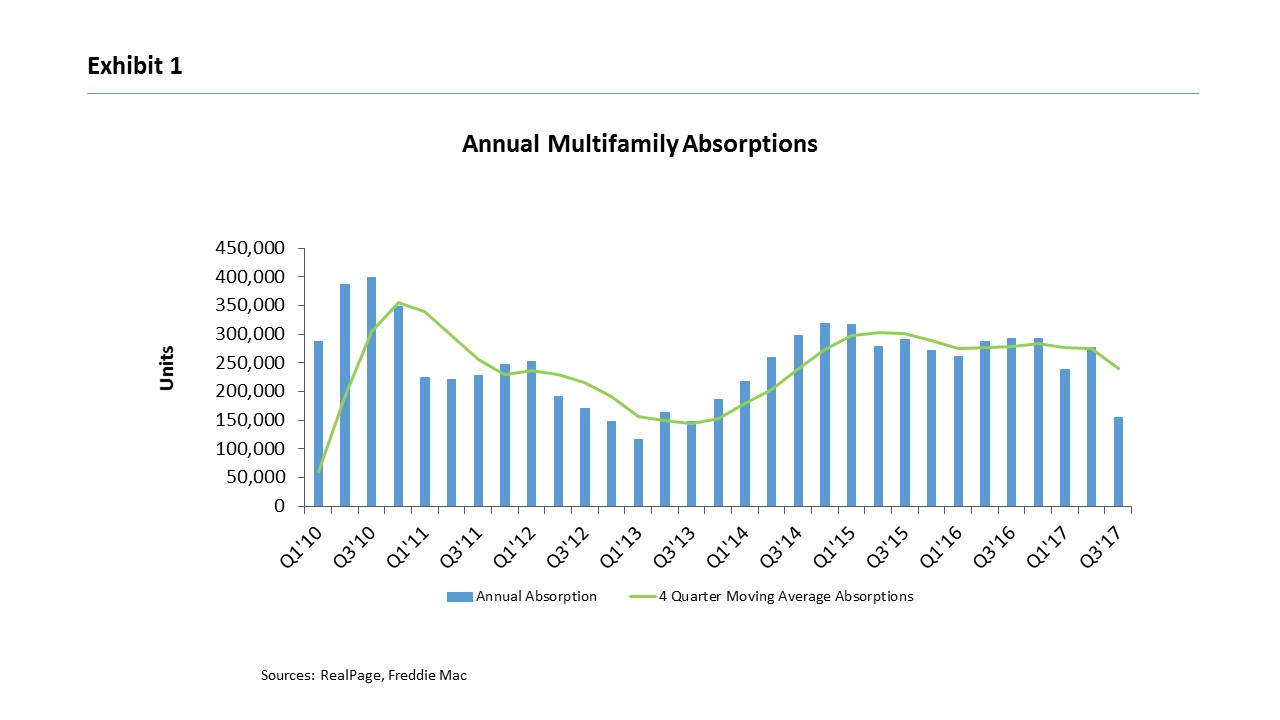
While total renter households are a proxy for multifamily absorptions, multifamily-specific data from RealPage shows a slightly different story. Annualized absorptions remained positive so far this year, but slowed in the third quarter compared to the prior few years, as shown in Exhibit 1. Annualized absorptions were reported at 150,000 units in the third quarter, compared to an annual average of 250,000 going back to 2010. But one off quarter is not enough to know whether this is a turning point or a blip and, with the second-quarter absorption rate in line with the prior few years, we do not see it as a sign of multifamily demand drivers weakening. In fact, due to strong absorptions in the prior few quarters, the four-quarter moving average remains robust at 240,000 units. The current demographic drivers for multifamily demand remain strong, given the size of the Millennial and Baby Boom cohorts, an increasingly ethnically diverse population, and household preferences for rental housing.
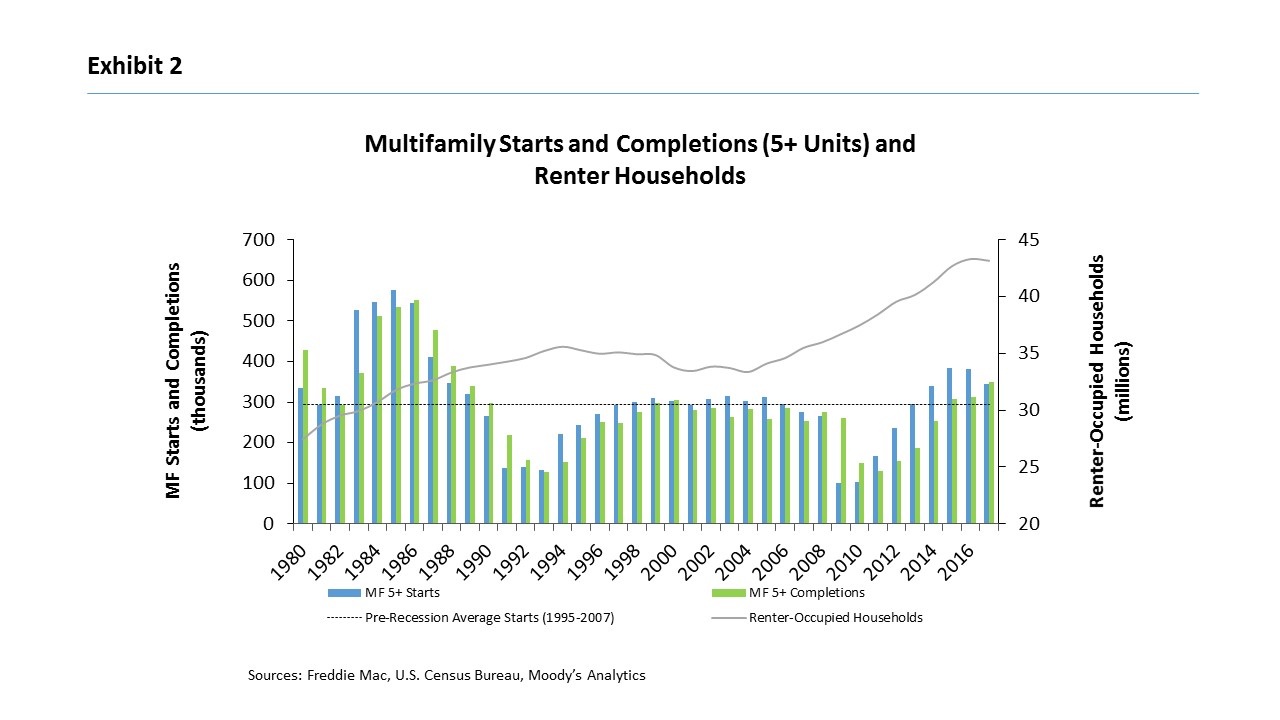
Completions increased this year after flat growth in 2016, as shown in Exhibit 2. For the 12 months ending November 2017, 350,000 units were delivered, an increase of 12.3 percent compared to the 12 months ending November 2016. New construction continues to slow compared to the prior few years; multifamily permits and starts are down 11.4 percent and 9.8 percent, respectively, since 2015.
With all the new deliveries, supply slightly outpaced demand and vacancy rates increased marginally over the past few months. While the firms tracking the market all report vacancy rates trended higher, the level and change in vacancy varies a bit: We forecast a year-end vacancy rate of 4.8 percent in 2017, up 60 bps year-over-year. Meanwhile, preliminary fourth quarter reports show a more subdued increase in vacancy rates: Reis forecasts a year-end vacancy rate of 4.5 percent, up 30 bps year-over-year, while Axiometrics forecasts a higher rate of 5.5 percent, but remained flat over the past year.
In most markets, rent growth continued to moderate in 2017, but less severely than anticipated at the beginning of the year. We forecast asking rent growth of 3.8 percent through 2017, while Reis preliminary fourth quarter results forecasts annual asking rent at 3.9 percent and effective rent growth of 3.3 percent and Axiometrics expects slightly more subdued growth of 2.5 percent. Reis forecasts year-end asking rent growth in line with 2016 growth; however, increased concessions from new buildings could bring effective rent growth slightly below 2016 levels. Combined with vacancy rates, gross income is expected to come in around 3.1 percent in 2017, slightly below the long-run average going back to 1990. It continues to grow faster than inflation, though, and at a healthy rate, given the large influx of supply.
With rents increasing, it is intuitive that multifamily property prices would have also risen. In the past seven years, gross income growth has outpaced the long-run average, driving up investment returns and demand for multifamily investments. Property prices, in turn, have increased faster than the historical average. Despite a slow start to the year, property price growth remained strong through third quarter, averaging 10 percent annually, according to Real Capital Analytics (RCA), as shown in Exhibit 3. This compares favorably to the 6 percent annual average growth since 2000, but is less than the average of 12 percent since 2012. While moderating rents and vacancies had some impact on property prices, higher Treasury rates and overall market uncertainty in the first part of the year also tempered property prices.
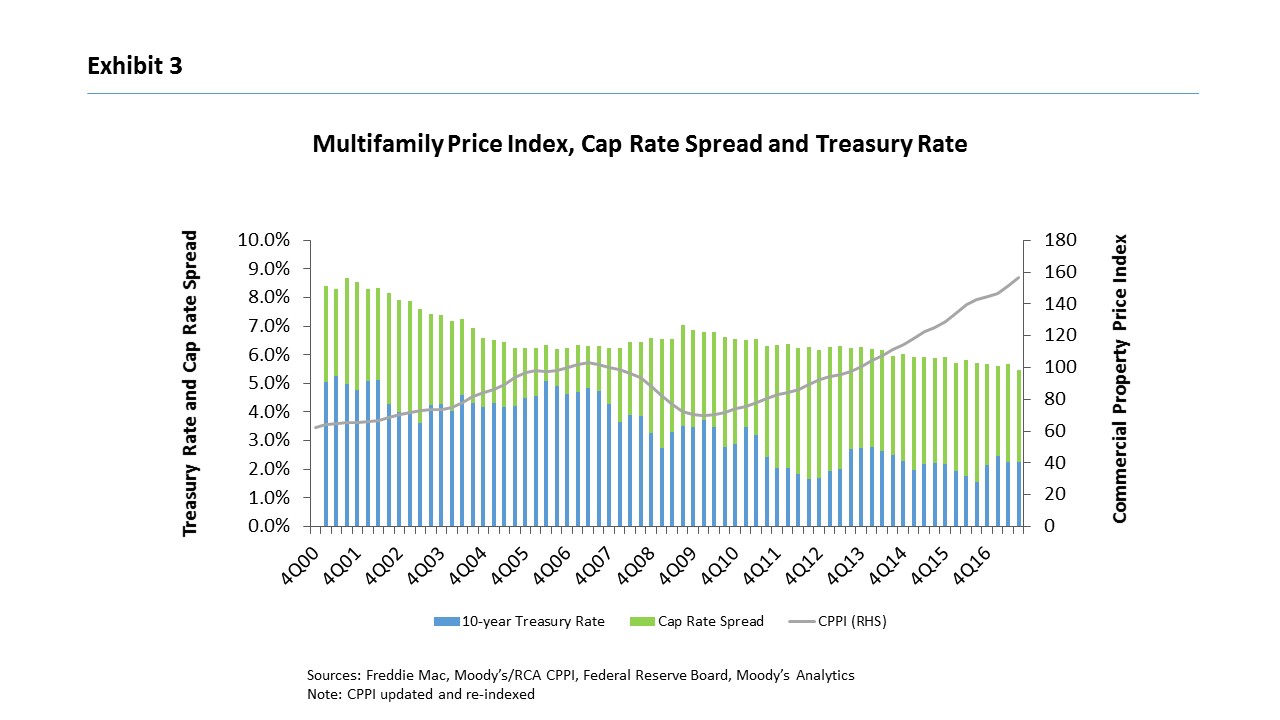
The 10-year Treasury rate began and ended 2017 around 2.4 percent, although the rate jumped around throughout the year. The sharp increase following the 2016 election saw rates peak in March at 2.6 percent but fell to 2 percent in September before rising slowly to 2.4 percent by the end of December. While rates have not dipped below 2 percent since November 2016, they remain low by historical standards. The higher 10-year Treasury rate had little impact on capitalization (cap) rates through 2017. While cap rates and Treasury rates are correlated – typically, as Treasury rates increase, so do cap rates – cap rates remained flat to slightly down in 2017, ending the third quarter at 5.8 percent, down 20 bps over the year. Cap rate spreads (the difference between cap rates and 10-year Treasury), however, contracted by 90 bps due to the higher interest rate. Despite the contraction, spreads remain wide at 360 bps compared to the long-term average of 320 bps going back to 2001.
2018 and Beyond: Status Quo
Most measures suggest the multifamily market will continue to grow in line with the historical average through 2018. The labor market again will drive market growth. Employment growth in 2018 is expected to remain near 2017 levels, but this growth rate cannot be sustained much longer, given the very low unemployment rate and shrinking pool of available workers. With full employment also comes higher wage growth, which is expected to pick up during the year, encouraging more household formations. Furthermore, there are still pent-up households that may be formed with continued economic expansion. Demand for multifamily units is expected to stay strong because of these economic factors as well as lifestyle preferences and demographic trends – such as Millennials, Baby Boomers, and increasing diversity – that are fueling an increase in rentership.
Regarding supply, new completions are expected to peak through the end of 2017 and into the beginning of 2018. New completions are estimated to reach between 360,000 and 370,000 units nationally in 2017, and could go slightly higher in 2018 before leveling off near current start levels. The new supply is expected to outpace demand nationally in the short-term, causing vacancy rates to continue to increase. Despite lower absorption rates in the third quarter of 2017, RealPage forecasts that absorptions will pick up through 2018 but remain lower than new supply entering the market. Vacancy rates, therefore, will increase, but forecasts vary on the extent of the rise.
We forecast that vacancy rates could increase by as much as 40 to 60 bps in 2018 if supply increases and demand stays at current levels.1 The high end of the range would put the year-end level in line with its historical average of 5.3 percent. An increase of 60 bps would be an unlikely severe case where new supply increases but demand does not increase from current levels. We expect that demand will also increase as more available units entice household formations. Also, if 2017 vacancy rates come in lower than anticipated, we expect rates will have a better chance of remaining below the historical average through 2018. Other forecasts (Reis, Axiometrics and Realpage) anticipate an increase in vacancy rates by only 20 to 30 bps. Expectations are for vacancy rates to increase to their long-run average over the next few years. Over the past several years, vacancy rates have remained lower than expected, despite higher levels of new supply and have taken longer to increase than anticipated. The same might happen again in 2018.
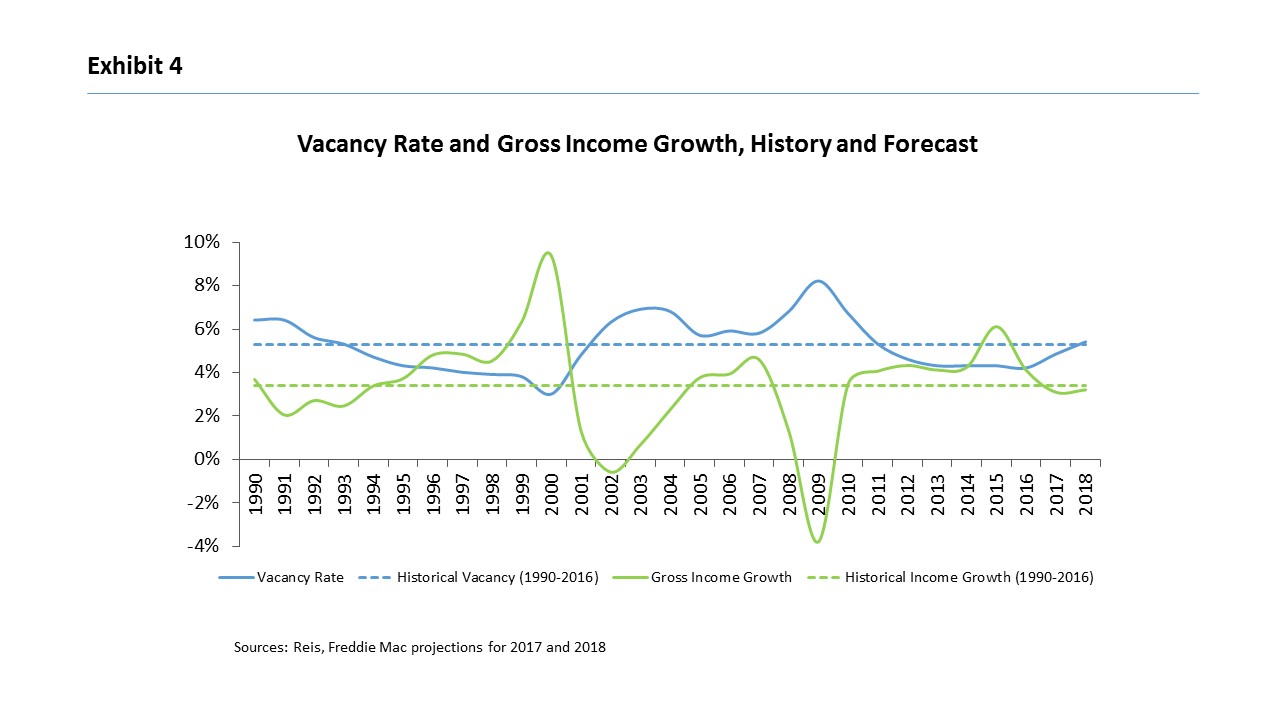
Despite higher vacancy rates, asking rents are expected to grow by 3.8 percent nationally – in line with 2016 and 2017 growth. This is above the long-run average going back to 1990 of 3.4 percent. Based on this rent growth, combined with the higher vacancy rate, gross income growth is expected to be in line with 2017 growth, just slightly below the long-run average, as shown in Exhibit 4, but remain above the 2 percent inflation target set by the Federal Open Market Committee (FOMC).
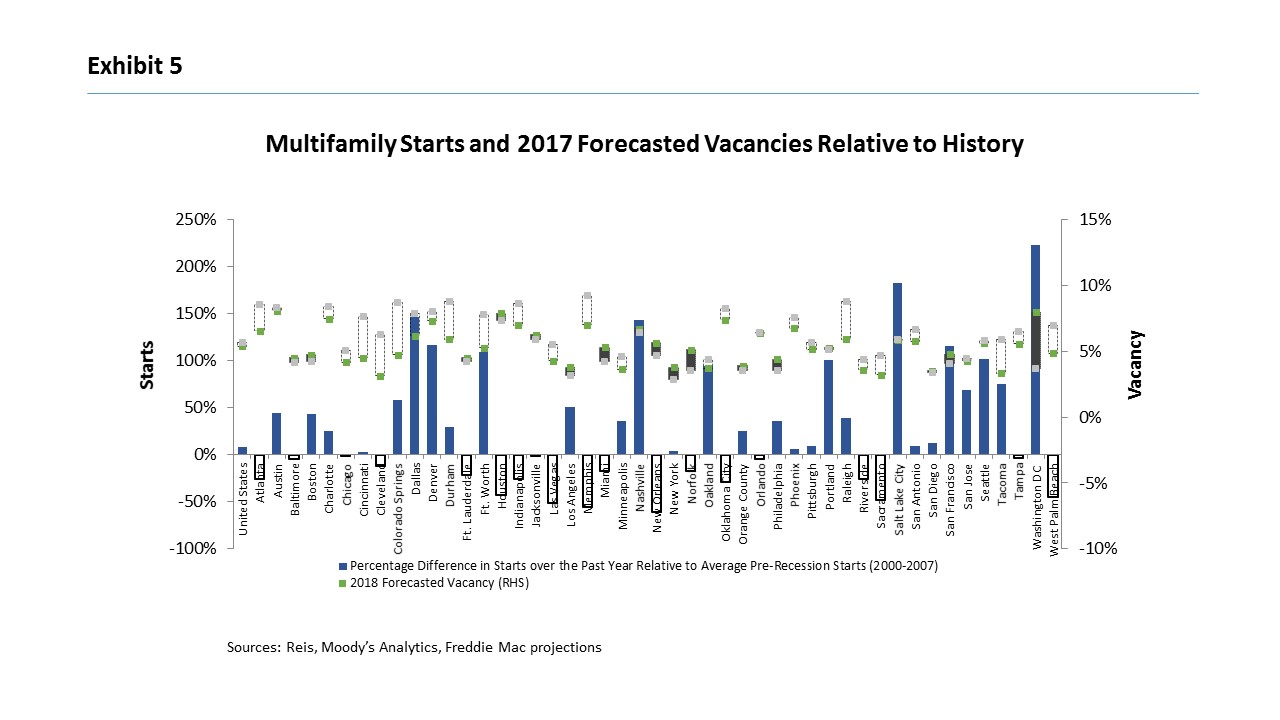
At the national level, performance is expected to remain in line with the historical average but, as always, performance across metros areas will vary. Construction starts in many markets are elevated compared to levels in the early 2000s and several metros have vacancy rates above their historical averages. As shown in Exhibit 5, areas with below-historical-average vacancy rates (for example, Colorado Springs, Raleigh, and Tacoma) are better poised to absorb new supply without significantly disrupting multifamily performance. However, areas with increased new supply and above-historical-average vacancy rates (for example, San Francisco and Washington, D.C.) can expect slower absorption and potential negative impacts on multifamily fundamentals.
New construction starts have pulled back in several metros, most notably Nashville, Oklahoma City, Raleigh, and Washington, D.C. At the same time, construction has increased in several places: Denver, Oakland, San Jose, and Tacoma. For most metros, vacancy rates in 2018 are expected to increase but remain below their historical averages, implying there is room for more supply to be absorbed.
Expected rent growth will continue to be mixed across the metros, as shown in Exhibit 6. About half of the metros will see rent growth slow in 2018 compared to 2017. Still, in nearly 70 percent of metros, rents will continue to grow faster than their historical average. Rents will moderate most in areas that previously experienced the most growth – such as Seattle, Salt Lake City, Nashville, and Tacoma – but remain above historical averages in those cities. Increased supply will heat up competition and slow the unsustainably rapid rent growth experienced in recent years. Meanwhile, San Francisco, West Palm Beach, and Boston are expected to experience the largest rebounds in rent growth in 2018, compared to 2017.
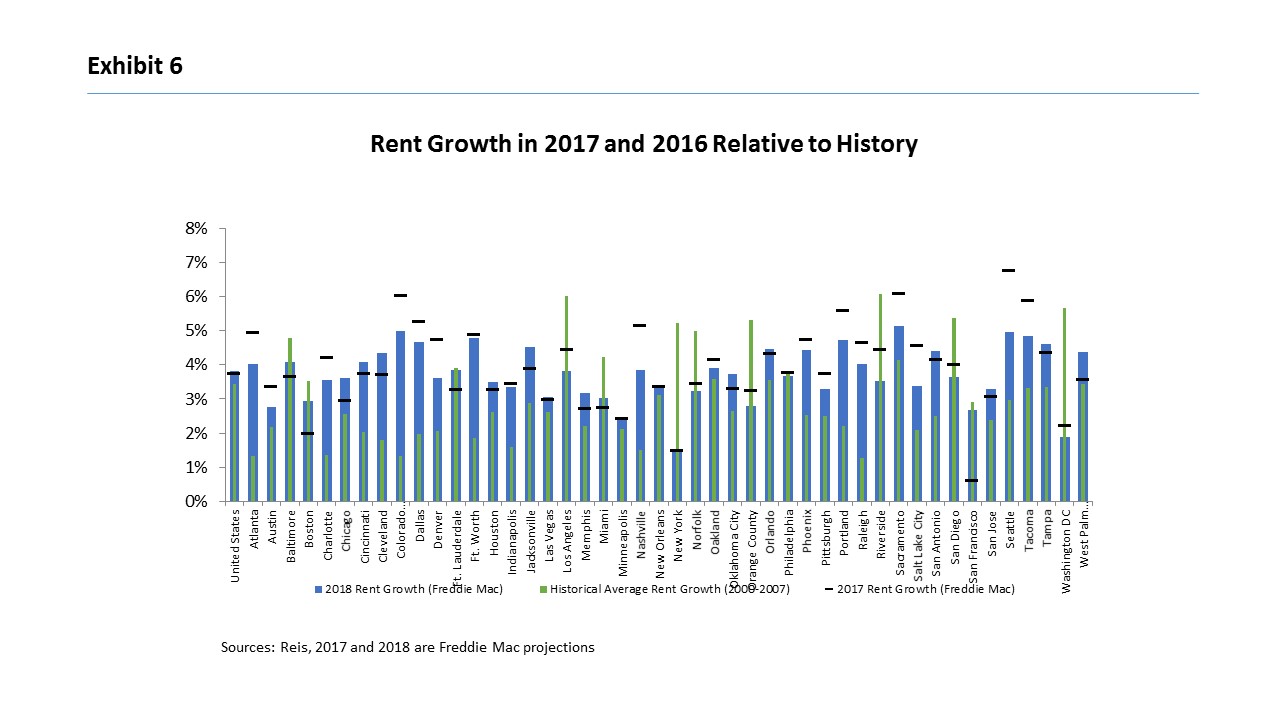
Rent growth in all metros is expected to remain above the FOMC’s target inflationary rate of 2 percent, except for New York City and Washington, D.C. – two areas experiencing some of the highest levels of completions. Southern California (comprising San Diego, Los Angeles, Riverside, and Orange County) also will experience below-historical-average rent growth.
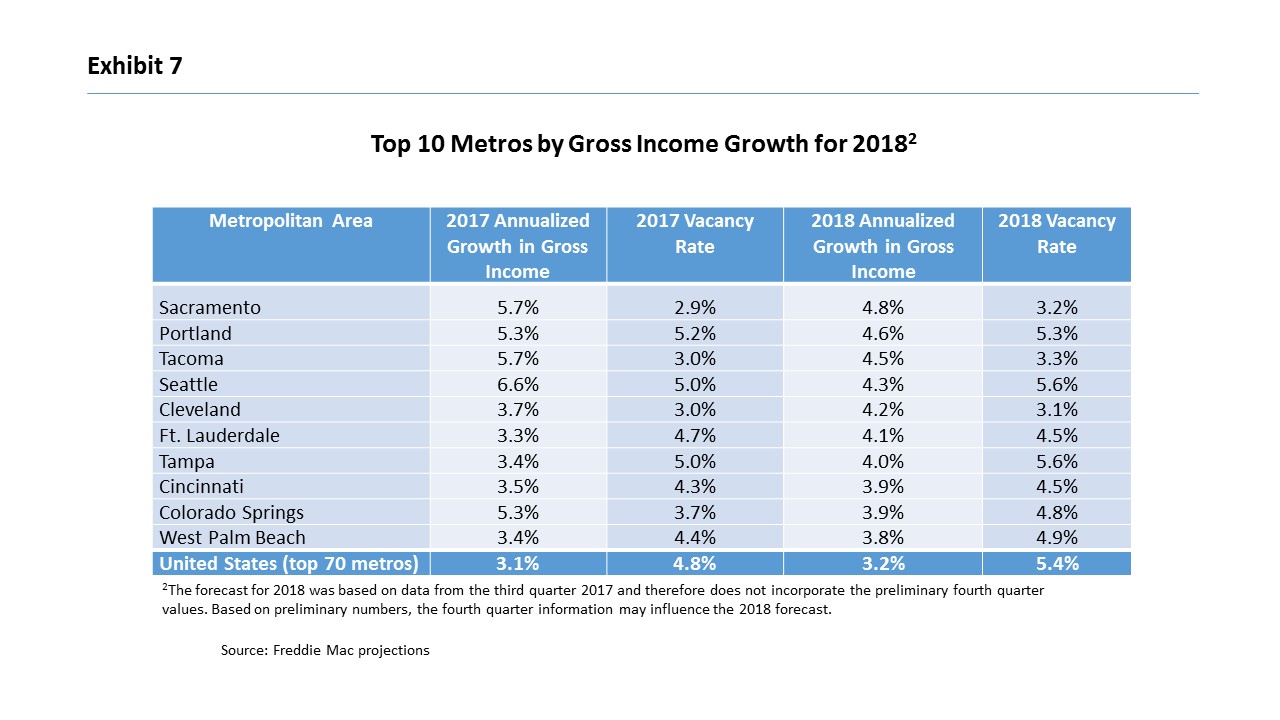
Taking these factors into account, half of the top 10 metros based on gross income growth in 2018 will be in western states and the rest in secondary and tertiary markets in Florida and Ohio, as shown in Exhibit 7. The five western markets (the West Coast metros along with Colorado Springs) will see gross income moderate in 2018 from 2017 levels and vacancy rates increase slightly, but remain robust due to strong demand drivers for multifamily rentals in those areas. On the other hand, the metros in Florida and Ohio will see gross income increase in 2018 from 2017 levels and, in some cases, vacancy rates decline. Growth is expected to be strong in these secondary and tertiary markets because limited new supply will keep vacancy rates well below their respective historical averages. Meanwhile, strong employment and wage growth is expected, which will allow rents to rise above the national average.
Origination Market Forecast
On the debt side, we expect the streak of multifamily origination volume growth will continue but the rate of growth will ease. Origination volume in 2016 came in higher than anticipated, at $269 billion, according to the Mortgage Bankers Association (MBA), up 7.6 percent over the year. One of the main reasons for the continued strength in origination volume is strong property price growth over the past several years. Property prices have grown on average 12 percent annually going back to 2012, or a total of 89 percent (as of third quarter 2017). The increasing property prices encourages market activity such as property sales, refinancing, and renovations, all contributing to higher volume originations.
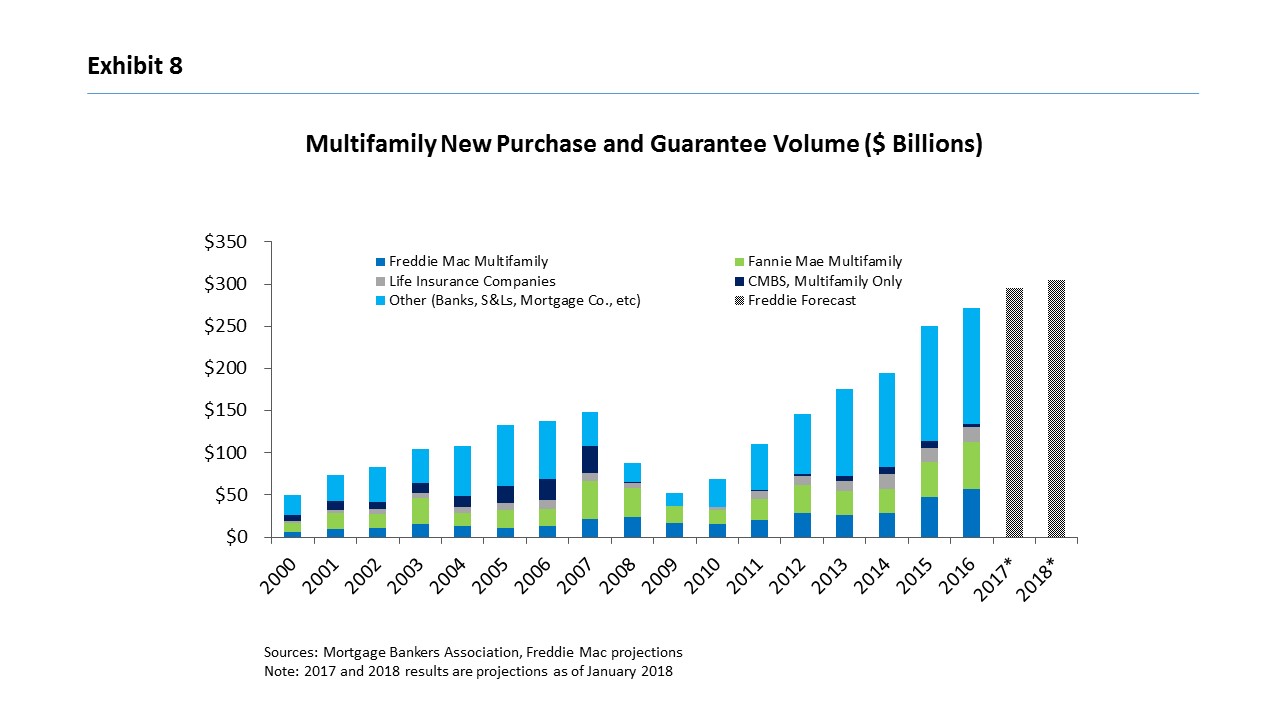
Despite the interest rate spike at the beginning of 2017 and concerns that it might diminish multifamily investment, we expect origination volume for the year grew by 8 to 9 percent, up to between $290 billion and $295 billion, as shown in Exhibit 8. Concerns that origination volume in 2017 would be lower due to the interest rate increase have diminished as strong multifamily fundamentals fueled investor demand. Property prices grew at an annualized rate of 10 percent as of the third quarter.
We expect originations to increase yet again in 2018, up to between $300 billion and $305 billion, as shown in Exhibit 8. That works out to 3 percent year-over-year growth. Interest rates are expected to slowly increase over the next year, up 30 to 40 bps through 2018. This increase will have little impact on cap rates, but they are expected to go up slightly, to around 6.1 percent by the end of 2018. In turn, property price growth will slow. Nonetheless, property prices will grow because of strong fundamentals, facilitating more market activity and increasing origination volume over the next year.
Although origination volume is expected to continue to grow in 2018, there are potential headwinds. A moderate rise in interest rates will not send the debt market into a frenzy but, if rates spike again as they did at the end of 2016 and at the beginning of 2017, originations might slow in 2018. Furthermore, as other commercial and residential industries grow, some investment appetites might shift toward them and away from multifamily.
Overall, the multifamily market outlook remains positive, even as it continues to moderate. Employment growth will stay above population growth, fueling demand for housing units, while demographic and lifestyle preferences continue to favor rental housing. New completions are expected to peak in late 2017 and into early 2018, pushing vacancy rates up but strong demand will keep rent growth above expected inflation. It will take longer to absorb new units in some areas than in prior years. Strong fundamentals and investor demand will boost property prices and market activity, leading to higher origination volume, which we predict it will hit another record in 2018.
For more insights from the Freddie Mac Multifamily Research team, visit FreddieMac.com Multifamily Research.
1 The forecast for 2018 was based on data from the third quarter 2017 and therefore does not incorporate the preliminary fourth quarter values. Based on preliminary numbers, the vacancy rate ended 2017 lower than projections, which would influence the 2018 forecast.