Economic, Housing and Mortgage Market Outlook – July 2023
The Economy, Though Volatile, Has Shown Resilience in the Face of Rising Interest Rates
The housing market has also been impacted by high rates as millions of homeowners locked into previously low mortgage rates and are content to remain in their current homes, therefore helping to keep inventory low
The U.S. economy has been resilient in the face of rising interest rates and grew at its long-run average rate of 2% during the first quarter of 2023. The labor market remains strong with an unemployment rate below 4% and rising labor force participation for the 25–54-year-old age group. The housing market has also been impacted by high rates with millions of U.S. homeowners locked into previously low mortgage rates and content to remain in their current homes, helping to keep inventory low and the balance tilted in favor of home sellers over buyers in most markets. In this month’s spotlight we show that this “mortgage rate lock-in effect” is the largest ever in U.S. history, and is likely to impact the housing market for years to come.
Recent developments in the U.S. economy
Per the U.S. Bureau of Economic Analysis, the third and final estimate of first quarter 2023 Real Gross Domestic Product (GDP) was much stronger than previously reported. Quarterly growth was revised up 0.7 percentage points to an annualized rate of 2%. While real GDP was revised upwards, the pace of growth continues to slow mainly due to the drag from the interest rate-sensitive sectors such as residential fixed investment and business investment. But the undaunted U.S. consumer has remained resilient, and consumer spending grew at an annualized rate of 4.2% in the first quarter, contributing to the upward revision of real GDP growth.
Consumer confidence and sentiment play a pivotal role in boosting consumer spending. The Conference Board’s June 2023 measure of consumer confidence jumped to the highest level since January 2022, reflecting improvements in the current conditions as well as in the future expectations. Expectations of inflation fell in June to 6%, the lowest reading since December 2020.
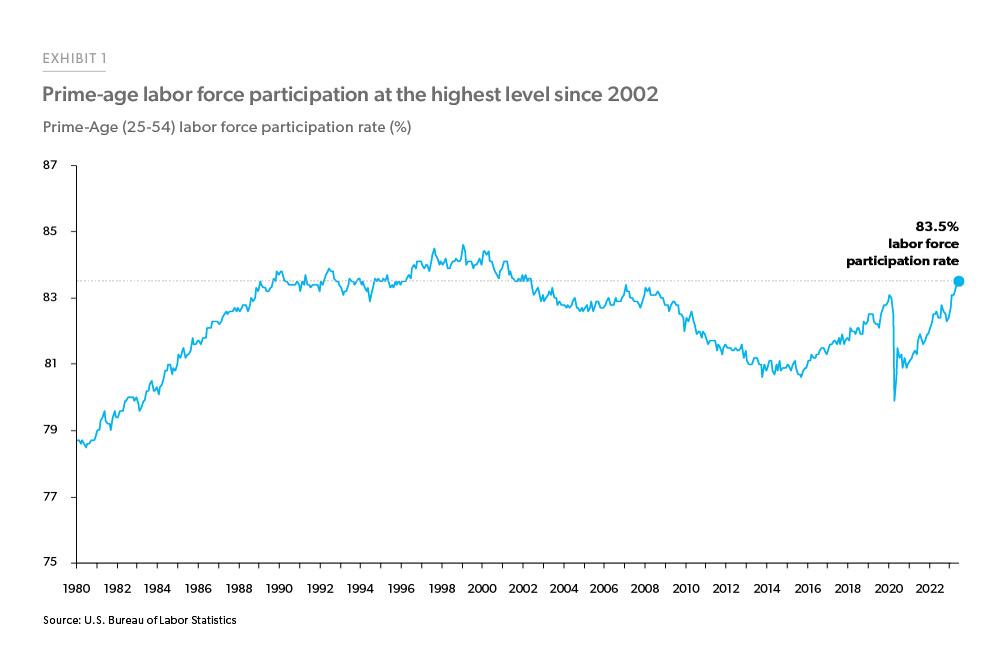
On the labor market side, according to the Bureau of Labor Statistics Employment Situation Summary for June 2023, the economy added 209,000 jobs in June led by the government, health care, social assistance, and construction sectors. The unemployment rate ticked down to 3.6% to remain near 50-year lows. The prime age (25–54-year-old) labor force participation rate has been rising and is now at the highest level since April 2002 (Exhibit 1). This suggests that the tight labor market is bringing many of the younger workforce, who were on the sidelines, back into the market.
The economy added 209K jobs in June, and the unemployment rate ticked down to 3.6% to remain near 50-year lows.
Inflation has been cooling in recent months, and the measure tracked by the Federal Reserve, the U.S. Bureau of Economic Analysis’ “core” price index for personal consumption expenditures, excluding food and energy (Core PCE), came in at 4.6% year-over-year in May. While housing continues to be the largest contributor to the increases in inflation and prices, it has started to cool off. Another inflation measure that the Federal Reserve has been tracking recently is the supercore service inflation (core services excluding energy and housing). Supercore inflation has been decreasing and the year-over-year change in May 2023 came in at the lowest since March 2022.
Inflation has been cooling in recent months, and the U.S. Bureau of Economic Analysis’ “core” price index for personal consumption expenditures came in at 4.6% year-over-year in May.

Recent developments in the U.S. housing market
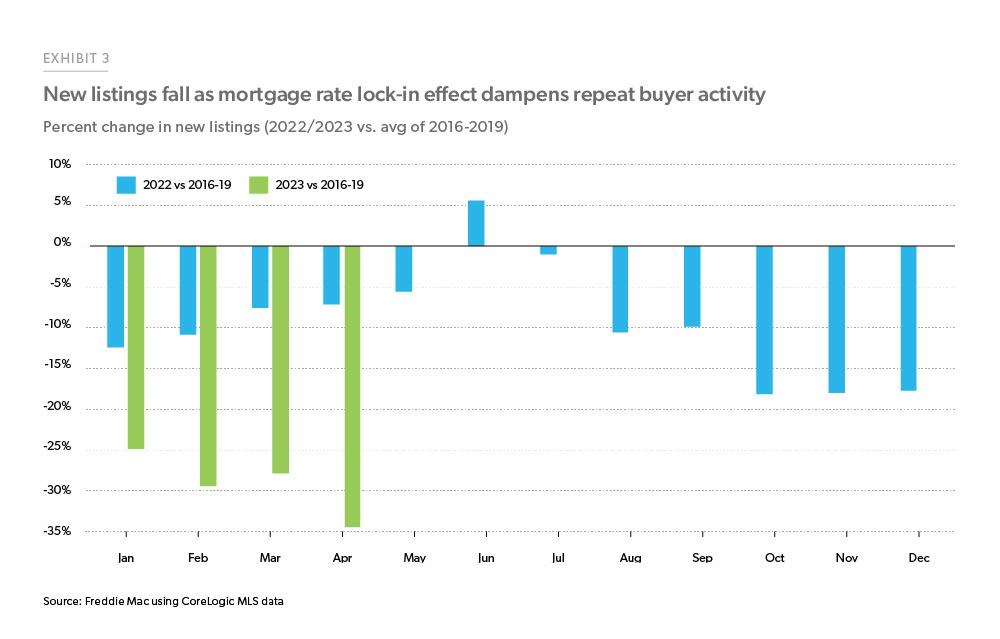
The divergence between existing home sales and new home sales has grown wider in recent months. Existing home sales receded 20% from a year ago, while new home sales surprised on the upside and increased 20% from a year ago in May. The mortgage rate lock-in effect continues to impact the listings of existing homes, which are down 35% as of April 2023, compared to the pre-pandemic average between 2016-19 (Exhibit 3). Pending home sales, which are a forward-looking indicator for existing home sales, also declined during May and were down 2.7% over the month and 22.2% over the year according to the National Association of Realtors®.
On the other hand, according to the NAHB/Wells Fargo Housing Market Index builder confidence improved to the highest level in nearly a year due to continued housing demand and easing of supply chain issues, as well as the lower level of existing homes for sale. All three subcomponents of the HMI increased: the sales expectation component saw the greatest increase of 6 points to 62, current sales conditions increased 5 points to 61, and buyer traffic rose 4 points to 37.1 The current sales conditions and the sales expectations rose to levels above 60 for the first time in a year as homebuyers warm up to mortgage rates in the 6-7% range.
This increased builder confidence was also reflected in the housing starts, which jumped 21.7% in May. Furthermore, the monthly increase in total starts at 291,000 units was the highest in over three decades. Permits also increased over the month of May and were up 5.2% on a month-over-month basis, despite being down 12.7% year-over-year.
House prices may have bottomed and continue to firm up in the short run. Per the FHFA’s Purchase- Only House Price Index, house prices increased nationally 0.7% from March to April 2023. While house prices increased across all the divisions over the month of April—ranging from +0.1% in the Pacific division to +2.4% in the New England division—the variation is wider when we consider the house price appreciation as compared to a year ago. The 12-month changes ranged from -3.8% in the Pacific division to +6.1% in the East South-Central division.
Recent developments in the U.S. mortgage market
The 30-year fixed-rate mortgage as measured by our Primary Mortgage Market Survey®, settled at 6.7% in June, partly due to the Federal Reserve’s decision to pause increases in the Fed Funds Rate. Partially in response to the stabilization in mortgage rates, purchase applications increased 7.1% over the month of June, while refinance applications increased 2.8%, both after seasonal adjustment according to the Mortgage Bankers Association Weekly Applications Survey.
Delinquency rate went down 11 basis points in May to 3.1%, close to the historical low of 2.92%; foreclosure starts remain 41% below 2019 levels.
With respect to mortgage performance, the delinquency rate, as measured by loans 30 or more days past due went down 11 basis points in May to 3.1%, close to the historical low of 2.92%, according to Black Knight’s May Mortgage Monitor. Serious delinquent loans (90 or more days past due) also fell by 18,000 over the month and are down around 30% since May 2022. While foreclosure starts increased 2.2% over the month of May, they remain 41% below 2019 levels.
The outlook
The outlook remains volatile as we enter the second half of the year. The Federal Reserve’s pause on interest rate hikes after ten consecutive increases since March 2022 was a welcome breather for the economy. The labor market remains strong with low unemployment and inflation appears to be moderating. Downside risks as a slowing economy could tip into recession, but on balance our outlook is cautiously optimistic.
General economy, rates, inflation
The U.S. economy will continue to grow, unless consumers pause their spending. While the labor market is gradually moderating, it remains sufficiently tight, and combined with consumers’ excess savings and recent wage gains, consumers will continue to spend and the economy will continue to expand, although at a reduced pace.
While the labor market is gradually moderating, consumers will continue to spend, and the economy will continue to expand, although at a reduced pace.
Under our baseline scenario, we expect inflation to continue cooling as the long and variable lags of monetary policy work through the economy. The slowing growth in prices of goods and services will further reinforce consumers’ purchasing power. However, even though inflation is expected to slow it will be gradual and the pressure on long term rates including mortgage rates will not likely abate this year. Therefore, we expect mortgage rates to stay above 6% for the second half of 2023. High mortgage rates will increase the cost of owning a home, likely leading to a reduction in other spending. However, savings from cooling inflation could be enough to offset the increased housing costs. If this is the case, consumers will keep spending, and the economy will continue to grow unless the labor market further moderates significantly.
Home sales
On the housing front, home sales are plagued by a combination of a lack of inventory of existing homes and high mortgage rates. Due to the mortgage rate lock-in effect (described further below), many existing homeowners are unwilling to list their homes for sale, and we do not expect sufficient existing homes to come on the market any time soon to significantly boost existing home sales. Therefore, we expect existing home sales to remain low through the rest of 2023. However, new home sales are expected to pick up through the rest of the year. Although new home sales’ contribution to the total sales has been increasing in recent months, they are a fraction of the total home sales, we expect total home sales to remain muted for the rest of the year.
Home prices
Our official corporate forecast for the next 12 months has house prices falling by 2.9% and an additional 1.3% over the subsequent twelve months. However, given the current housing market conditions with historic low inventory and an early read on our data, we will likely revise our home price forecast in the next iteration of the Economic, Housing and Mortgage Market Outlook. We expect tight inventory will push sales volume down, and we expect it to keep home prices up.
Mortgage originations
Due to lower home sales, purchase origination volumes are expected to remain muted this year, while high mortgage rates keep refinance activity low. As homebuyers get accustomed to the new normal in terms of mortgage rates, we expect home sales to pick up and purchase originations to resume modest growth in 2024.
See the July 2023 spotlight on the rate lock-in effect.
Footnote
- The Housing Market Index is a diffusion index normalized so that a value of 50 indicates sentiment balanced between positive and negative. Any value above (below) 50 indicates that on average survey respondents have a positive (negative) sentiment. For more information on the index see https://www.nahb.org/news-and-economics/housing-economics/indices/housing-market-index.
Prepared by the Economic & Housing Research group
Sam Khater, Chief Economist
Len Kiefer, Deputy Chief Economist
Ajita Atreya, Macro & Housing Economics Manager
Rama Yanamandra, Macro & Housing Economics Manager
Penka Trentcheva, Macro & Housing Economics Senior
Genaro Villa, Macro & Housing Economics Professional