Homeowner vs. Renter Spending in an Era of Rising Housing Costs
Housing expenses are the largest component of a household’s budget and account for around a third of total monthly expenses for the average American household. The rising demand for housing along with the shortage of homes available have pushed up both house prices and rents.
We explored buying vs. renting in a recently published research note where we found that poor affordability has widened the gap between the typical payments and rents on the same house. While affordability of owning relative to renting is very poor compared to pre-pandemic levels, it is similar to the early 2000s and within the upper range of historical norms. In this spotlight, we focus on how housing expenditures have shifted in recent years in an era of rising housing costs.
How much does a typical American consumer spend on average in a year and on what?
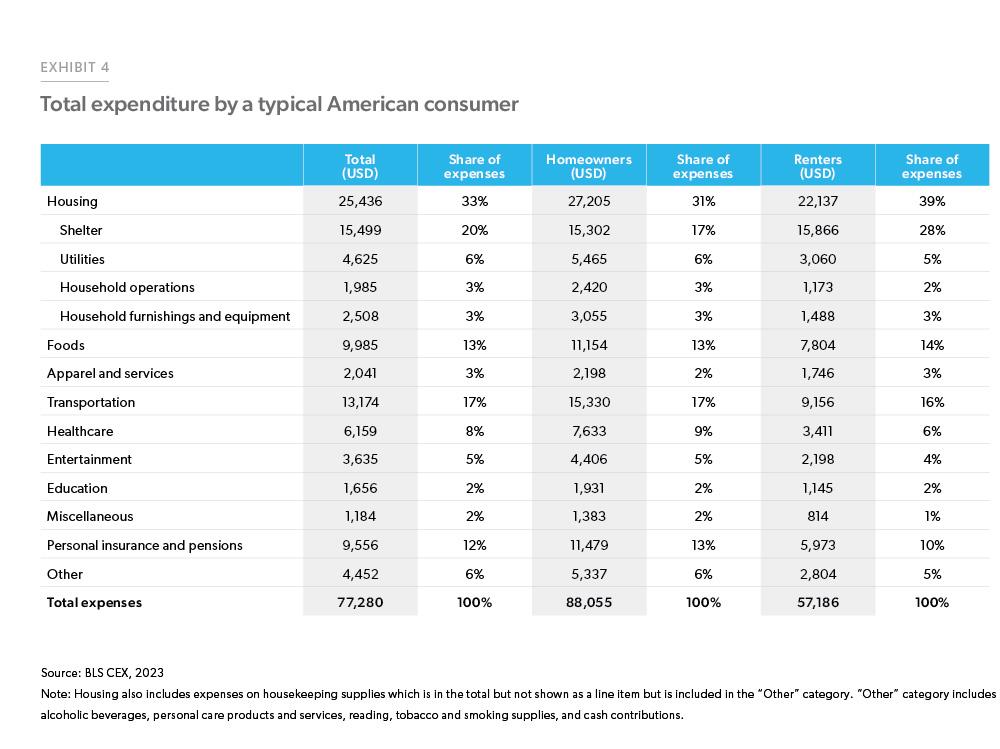
According to the Consumer Expenditure Survey (CEX) by Bureau of Labor Statistics (BLS), as of 2023 a typical consumer spent around $77,000 per annum with the largest share of expenditure going towards housing followed by transportation and food.1 Renters allocate a larger share of their expenses towards rent at 39% compared to homeowners who spend 31% on their total housing expenses. Housing expenses include shelter expenses (mortgage payments, taxes and insurance), utilities, fuel and services, household operations, housekeeping supplies and household furnishings, and equipment. While in nominal terms the total expenses increased by 252% over the period between 1984 and 2023, after accounting for inflation, expenses in real terms increased by 20%. In this spotlight, we study the share of expenses homeowners and renters spend on various expenditure categories to account for increases in both incomes and price levels over the period from 1984 to 2023.
Homeowners’ expenditures
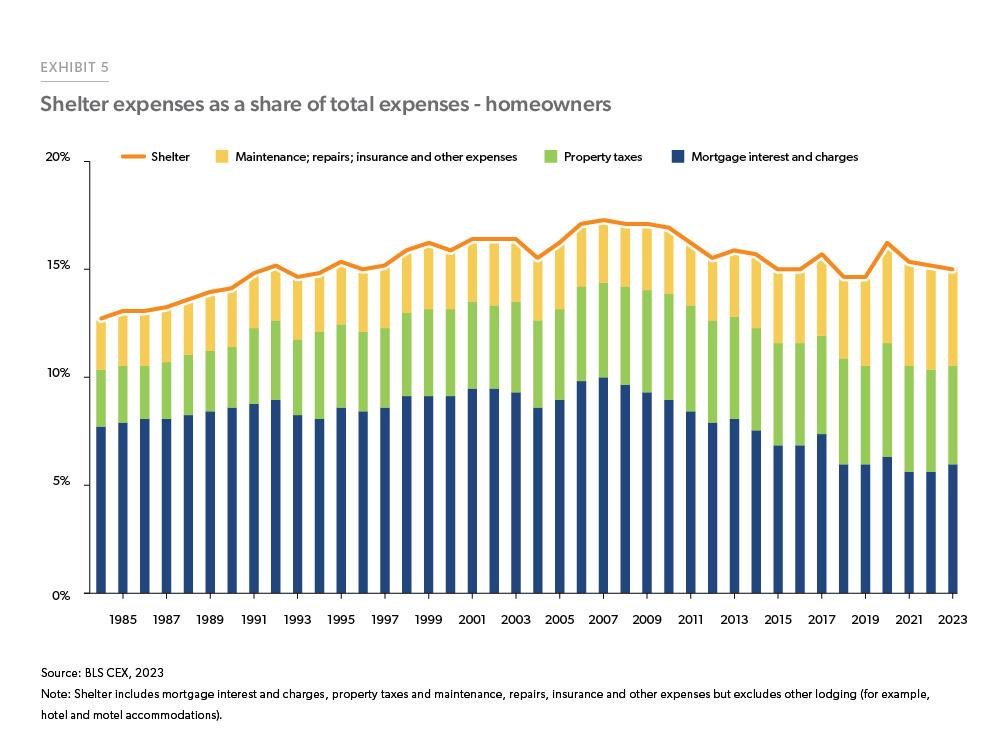
Per the 2023 CEX, on average a homeowner’s expense on shelter as a share of total expenditures has been around 15% since 1984. The shelter portion of housing expenses includes maintenance, property taxes, and mortgage and interest charges. Exhibit 5 (on the following page) plots the shelter expense for homeowners. As can be seen from the exhibit, the share of homeowner expenses on shelter rose and eventually peaked at 17% right before the financial crisis and has come down since then. There was another uptick during the pandemic, but since then it has stabilized back to its previous levels. Within shelter, mortgage and interest charges account for around 8% of total homeowner expenditures on average since 1984, peaking in 2006. As of 2023, mortgage interest and charges contributed to 6% of the total housing expense. While mortgages rates and house prices have increased now, a vast majority of the homeowners are locked into very low rates, helping homeowners keep their monthly payments lower as compared to the other expenses. Additionally, about two out of five homeowner households own their home free and clear without a mortgage, so their expenses on shelter are limited to insurance, taxes and maintenance.
Property taxes as well as maintenance and repairs have steadily increased over the years. Property taxes contributed to 3% of the total housing expense in 1984 and increased to 5% by 2009, remaining at that level since. Maintenance, repairs and other expenses also steadily rose over the years and doubled by 2023. In terms of the other broad categories BLS collects data for, we find that expenses on utilities and fuel declined between 1984 and 2023, along with household furnishings. On the other hand, expenses on household operations increased slightly while expenses on housekeeping supplies have remained constant.
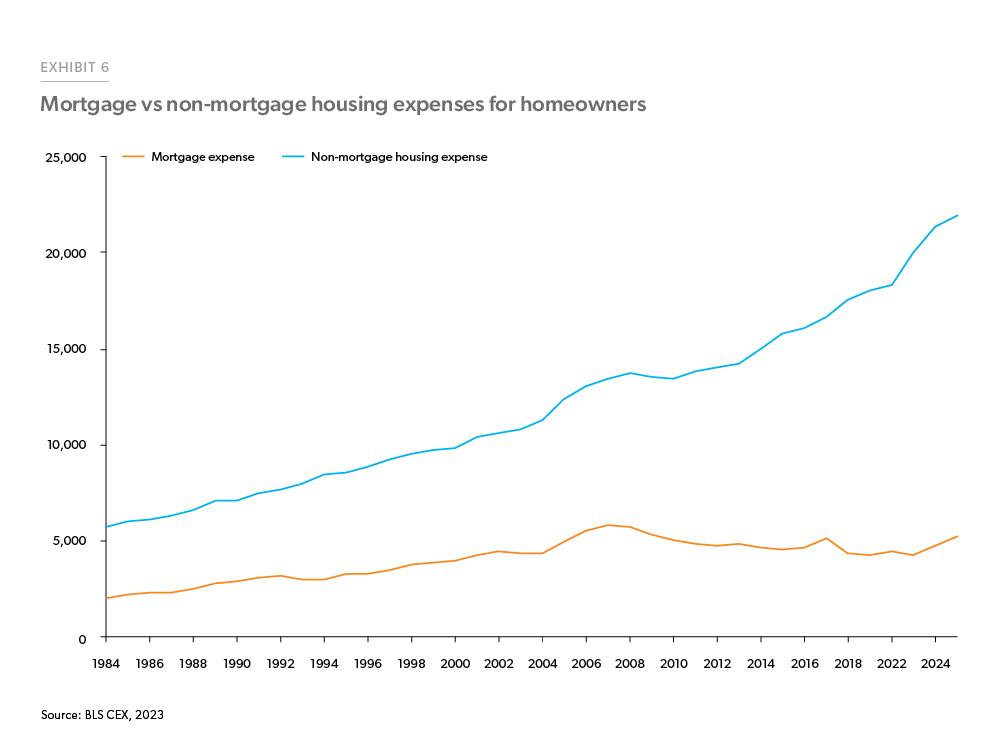
If we look at mortgage versus the non-mortgage expenses, we find that non-mortgage expenses have gone up more than the mortgage expenses. Non-mortgage expense is the total housing expense (which includes expenses on shelter, utilities, household supplies, household operations, etc.) less the expenses on mortgage interest and charges (Exhibit 6). Even though mortgage expenses increased from $1,982 in 1984 to $5,263 in 2023, the share of mortgage expense to total housing expenditures declined from 26% to 19% over the same period, mainly due to the fixed rate mortgages. On the other hand, non-mortgage expenses increased from $5,751 to $21,942 but their share also increased from 74% to 81% of total house expenditure share over the same period. So, while overall expenses on housing have increased over the period, how have homeowners adjusted and how have their expenses shifted over the years?
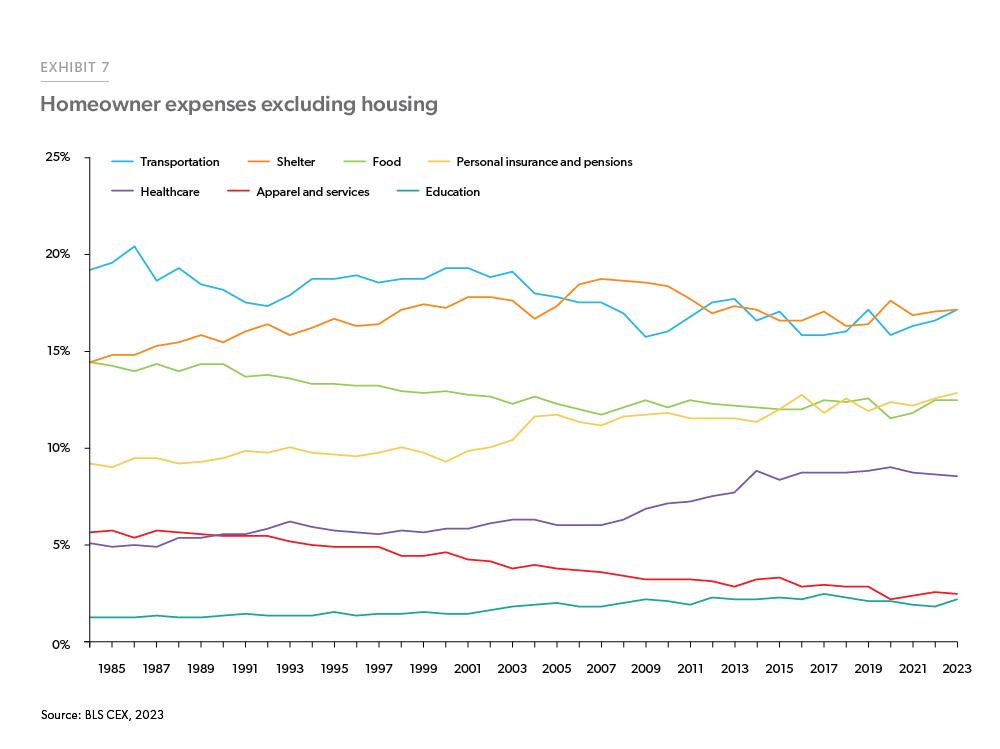
The components of homeowner expenditures that saw declining expenditure shares are food, apparel and transportation. Exhibit 7 plots the homeowner expenses excluding housing. Apparel saw the largest decline as a share of total expenditures, from 6% in 1984 to just 2% in 2023.
Renters’ expenditures
Unlike homeowners, who mostly have a fixed-rate mortgage and are shielded from rising interest rates and house prices, renters do not have the same advantage and must deal with rising rent costs. For renters, the share of average annual expenditures spent on rent rose from 18% to 26% between 1984 to 2023 (Exhibit 8). As opposed to homeowners, this steady increase in rent expenditure means that renters are having to cut back on their spending elsewhere.
These cuts are likely to be seen in more discretionary categories rather than necessities. As outlined in Engels Law, it is likely that the percentage of average annual expenditure for food at home will stay relatively constant regardless of how much the share of shelter expenditures increase.2 As can be seen in Exhibit 8, expenditures on food declined only slightly during the period from 1984-2023.
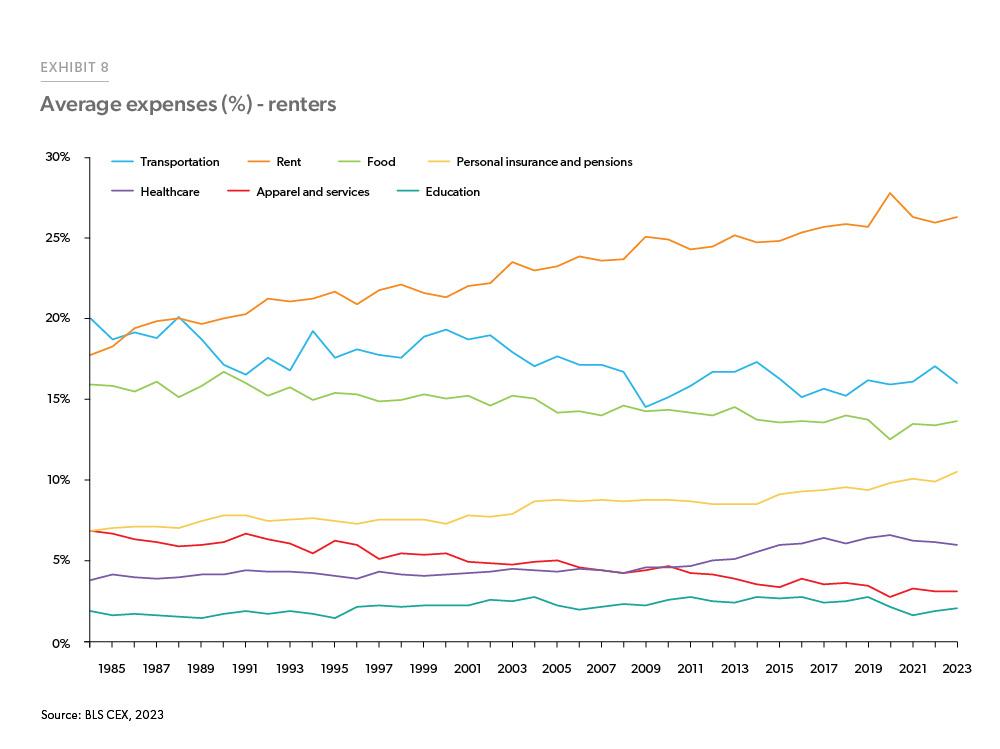
If we break down food into food away from home and food at home, we find that food away from home has increased slightly from its low in 2020 but has not made the recovery back to its pre-pandemic levels. Aside from food, a downward trend is also observed with renters’ expenditures on apparel and services.
Another area where renters have cut back expenses is transportation. Expenditure shares for transportation have declined more for renters than homeowners. One possible explanation for this could be homeowners moving away from city centers to suburbs to buy a home, therefore spending more on transportation in order to commute to work. Renters, however, are more likely to live closer to work and can spend less on transportation as a percentage of their total expenses.
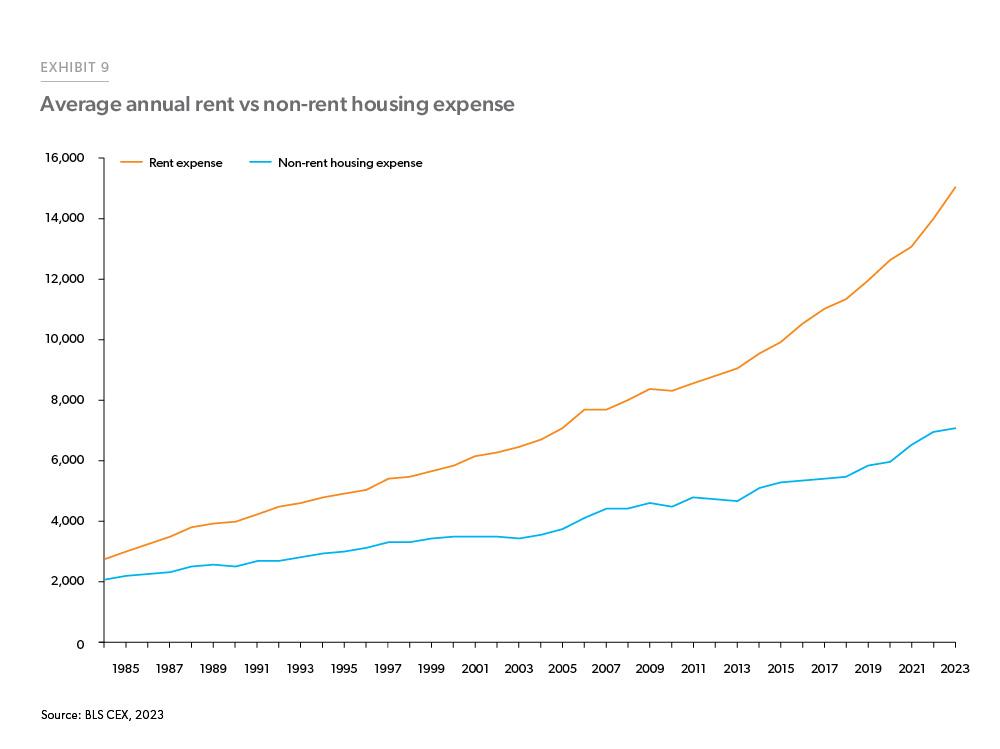
Unlike homeowners, for renters, the share of rent in total housing expenses has been rising as compared to the non-rent expense (Exhibit 9). Non-rental housing expenses like the non-mortgage expense includes utilities, household operations, furnishings, housekeeping supplies, etc.
To conclude, homeowners were able to lock themselves into lower mortgage rates and shield themselves from the rising interest rates and house prices. However, renters do not have the same advantage and must deal with rising rent costs. These rising costs meant reducing spending on other categories of expenses such as apparel and food away from home. While overall transportation expenses declined, they declined more for renters who typically try to rent closer to work, while homeowners have seen a movement away from city centers to the suburbs indicating a large share of transportation expenses as compared to renters.
Footnotes
- The BLS also produces the Current Employment Statistics which is often abbreviated CES, so we use CEX as the abbreviation for the Consumer Expenditure Survey to avoid confusion.
- Chai, A., & Moneta, A. (2010). Retrospectives Engel Curves. Journal of Economic Perspectives, 24, 225–240. https://www.aeaweb.org/articles?id=10.1257/jep.24.1.225
Prepared by the Economic & Housing Research group
Sam Khater, Chief Economist
Len Kiefer, Deputy Chief Economist
Ajita Atreya, Macro & Housing Economics Manager
Rama Yanamandra, Macro & Housing Economics Manager
Penka Trentcheva, Macro & Housing Economics Senior
Genaro Villa, Macro & Housing Economics Senior
Caroline Cheatham, Finance Analyst