Housing Supply: Still Undersupplied by Millions of Units
Housing affordability remains one of the top economic issues facing American households. Both homeowners and renters have seen the cost of housing increase faster than other consumer prices, putting a significant strain on household budgets.
As we have documented in several previous research notes,1 the root cause of decreased housing affordability is the fact that housing supply has not increased enough to match demand. Inadequate housing supply leads homeowners and renters to bid up the sale price and rent of available housing, which puts a squeeze on affordability.
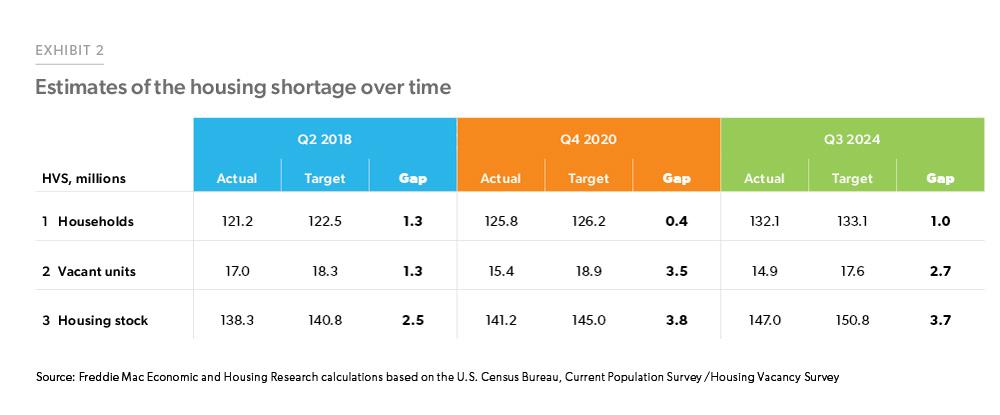
In this spotlight we provide an updated estimate of the housing supply shortage relative to long-run housing demand. In our last published estimate from May of 2021, we estimated that the U.S. housing shortage was 3.8 million units as of Q4 2020. Our updated estimate based on data through Q3 2024 is that the U.S. housing shortage has declined slightly to 3.7 million units.
Exhibit 2 below breaks down how we arrived at the new estimate and compares it to prior estimates. Since our previous estimate for Q4 2020, the U.S. housing stock has increased by 5.8 million units, or an average annual rate of 2.1 million units per year. However, over that same time the number of households increased by 6.3 million (2.3 million annual rate), while target or latent households increased by 6.9 million (2.5 million annual rate). But despite the increases in housing stock and the much larger increase in household formation, our estimate of housing shortage is slightly lower than our previous estimate.
That’s due to our lower target vacancy rate assumption. Our previous analysis assumed a target vacancy rate of 13% which was the average vacancy rate during the period between Q1 1990 and Q2 2018. The target vacancy rate assumed units held off market would continue to remain high as was the trend at that time. However, since our last estimate, housing market conditions have changed, and the units held off market have been declining, especially since 2022. Therefore, we revised our target vacancy rate assumption to correspond to the stable period in the housing market which we consider was from Q1 1994 - Q4 2003. Thus, our target vacancy rate declined from 13% to 11.7%, reducing the number of vacant housing units needed by 1.3 million.
Housing demand
The first component in estimating the housing shortage is housing demand. While we can directly observe the actual number of households in any given period, we cannot see households that have not formed due to high housing costs. To estimate the target number of households, we employ a counterfactual analysis. This method allows us to project the number of households that would have formed if housing cost had remained at the level in our benchmark period, which is the year 2000.
While household formation increased during the pandemic, limited supply has meant that many potential homebuyers have been priced out due to affordability concerns. To estimate the latent demand, we consider the households that could have been formed were the housing costs more favorable. For our estimate of housing costs, we utilize rent data.2 From 2000 to 2024 inflation-adjusted rents increased by 11%, from $1,396 per month to $1,556 per month. In our counterfactual, we set real rents back at 2000 levels and estimate the number of additional households that would create.
We obtain the current headship rates by 5-year population groups starting from 15-19, 20-24, 25-29, etc., from the Current Population Survey–Annual Social and Economic Supplement (CPS-ASEC) using the Integrated Public Use Microdata Series (IPUMS) (Flood et al. 2017).3 We then adjust the current headship rate by the housing cost factor to obtain the target headship rate. To obtain the housing cost factor, we run an Oaxaca-Blinder decomposition on the factors affecting household formation (including income and education, housing costs, race and age, marriage and children, etc.). We use rents as a proxy for housing costs as rents directly impact household formation. Based on the contribution of these factors, we add back the factors related to housing costs to the current headship rate to get the target headship rate which can be written as: 
Where  is the headship rate by 5-year age groups and
  is the contribution of housing costs to the total headship rate.
Applying the new headship rates to the 2024 population by these 5-year age groups, we get the target households for each of the age group. If housing costs as measured by rents were more affordable, we estimate that the U.S. would have added 1 million more households with most of the growth coming from younger households.
Vacant units for a well-functioning market
The second component in the estimation of the housing shortage is vacant units. A well-functioning housing market requires some vacant properties. If there are too few vacant housing units, home sales and new rentals will be hard to fill as there will be limited options that are move-in ready. In addition, there are some homes that are either seasonally vacant or held off market. Overall vacancy rate was at 10.1% in Q3 2024, 1.6 percentage points below our target vacancy rate of 11.7%, which is derived as described below.
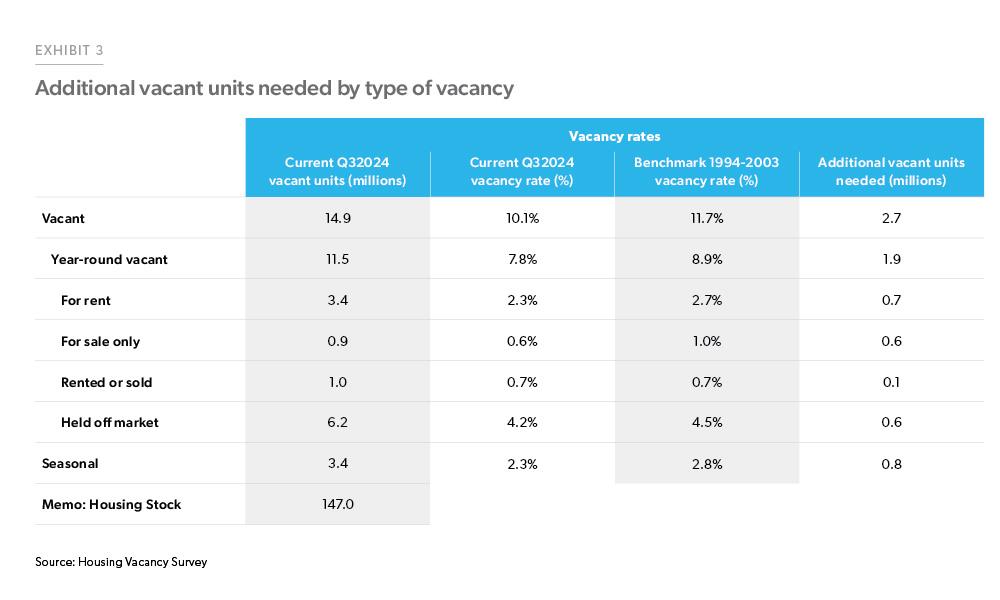
For the estimation of the housing supply shortage, we need a target vacancy rate. As explained above, we assume the vacancy rate during the “stable period” in the housing market (Q1 1994 – Q4 2003), 11.7%, to be the target vacancy rate.4 Within this vacancy, we assume that the seasonally vacant units average 2.8% of the housing stock, 0.7% are assumed to be in the process of being rented or sold, 3.6% for rent or sale, and 4.5% held off market. Exhibit 3, on the following page, converts the target vacancy rate to the target number of vacant units needed by type of vacancy. The various components equal 2.7 million additional vacant housing units needed to balance the market given the demand estimates presented in the previous section.
Conclusion
Our updated estimates show that the housing market is still dramatically undersupplied relative to long-run housing demand. Despite adding 5.8 million housing units over approximately four years (since our previous estimate), housing demand has increased by almost the same amount, resulting in very little progress in reducing the housing shortage. In the aggregate, we estimate that U.S. housing stock is 3.7 million units below what is needed given our current population and assuming inflation-adjusted housing costs returned to historical levels. Even without the push from latent housing demand, the current housing stock remains below levels consistent with historical vacancy rates.
While there is reason to be optimistic about the housing market given the demographic tailwind and the cohort of Millennials and young adults entering the housing market, high mortgage rates have put a damper on affordability. Rising home prices have also had an effect and are directly related to the supply shortage. Building more houses is essential but builders are also contending with high interest rates.
There is no silver bullet to alleviating this ongoing shortage. That said, there are viable options being considered and acted, upon including accessory dwelling units (ADUs), Community Land Trusts, condominium conversions, manufactured homes, to name a few. We will continue to study this topic and work with the industry to uncover potential solutions.
Footnotes
- https://www.freddiemac.com/research/insight/20210507-housing-supply, https://www.freddiemac.com/research/insight/20200227-the-housing-supply-shortage, https://www.freddiemac.com/research/insight/20181205-major-challenge-to-u.s.-housing-supply
- We obtain the data on rents by Metropolitan Statistical Area (MSA) from RealPage.
- Sarah Flood, Miriam King, Steven Ruggles, and J. Robert Warren. 2017. Integrated Public Use Microdata Series, Current Population Survey: Version 5.0. [dataset]. Minneapolis: University of Minnesota. https://doi.org/10.18128/D030.V5.0
- Our previous analysis assumed a target vacancy rate of 13% which was the average vacancy rate during the period between 1990Q1 and 2018Q2. The target vacancy rate assumed units held off market would continue to remain high as was the trend at that time. However, since our last estimate of the housing shortage in May 2021, housing market conditions have changed and the units off market have been declining especially since 2022. Therefore, we revised our target vacancy rate assumption to correspond to the stable period in the housing market.
Prepared by the Economic & Housing Research group
Sam Khater, Chief Economist
Len Kiefer, Deputy Chief Economist
Ajita Atreya, Macro & Housing Economics Manager
Rama Yanamandra, Macro & Housing Economics Manager
Penka Trentcheva, Macro & Housing Economics Senior
Genaro Villa, Macro & Housing Economics Senior
Caroline Cheatham, Finance Analyst