In Pursuit of Affordable Housing: The Migration of Homebuyers within the U.S.—Before and After the Pandemic
In this Research Note, the first of a three-part series on migration, we compare net migration of homebuyers across U.S. metropolitan areas (“internal migration”) and explore the patterns of metro-to-metro migration flows.
Tracking homebuyers in real time
Internal migration plays an important role in understanding the ways population shifts are shaping the nation. Most researchers turn to the Census Bureau’s American Community Survey and the Current Population Survey for statistics on migration and geographic mobility, but those surveys are released only annually and are limited by sample size and geographic specificity. Alternatively, Freddie Mac’s automated underwriting system, Loan Product Advisor® (LPASM)—created to streamline the loan application process and serve as a database management system for hundreds of millions of transactions—offers a real-time view into the residential mobility of American homebuyers. To put the sample sizes into perspective, in 2020, the American Community Survey, the largest household survey on approximately 3 million households a year, collected data on roughly 315,000 households who moved in the prior year.1 In that same year, out of nearly 14 million loan applications submitted to LPA, 2 million were for owner-occupied home purchase loans.2 Key findings of this analysis include:
- Homebuyer migration patterns using Freddie Mac LPA data show a population in pursuit of affordable housing.
- The pandemic amplified existing urban deconcentration by threefold, from large, expensive metro areas to smaller, more affordable destinations.
- In fast-growing metro areas, the continued shortage of housing and high house-price-to-income ratios eventually lead to increased out- migration as homebuyers seek more affordable destinations.
Freddie Mac’s automated underwriting system, Loan Product Advisor® (LPASM), offers a real-time view into the residential mobility of millions of American homebuyers every year.
Relocating farther for housing
According to the U.S. Census Bureau, 2021 saw the lowest percentage of people change their residence since 1948, when the data series began. Last year, 8.4% of the population moved, down from 11.0% in 2017. In terms of total number of moves, this amounted to 5.7 million fewer moves in 2021 compared to 2017. However, nearly three out of four moves are local and within the same metro area or non-metro county boundaries. If we turn our attention to the share of moves crossing metro boundaries, we see an upward trend in inter- metro moves. In 2021, 27.1% of total movers migrated to new metro areas or left metro areas for non-metro areas. This is an increase of 3.8 percentage points from 23.4% in 2017. While there were still roughly half a million fewer moves crossing metro boundaries in 2021 compared to 2017, this was only a drop of 8.1% compared to the 20.9% drop in the total number of moves. In short, although fewer moves are occurring each year, a larger share are longer distance moves.

In 2021, 27.1% of total movers migrated to new metro areas or left metro areas for non-metro areas—an increase of 3.8 percentage points from 23.4% in 2017.
To understand the main reasons impacting people’s decision to move, starting in 1998, the Census Bureau began asking respondents this question in the Annual Social and Economic Supplement (ASEC) of the Current Population Survey (CPS). Over the last 24 years, housing- related reasons (e.g., wanting to own a home, wanting a larger home and wanting cheaper housing) were the main factors behind shorter distance moves within counties while employment-related reasons (e.g., new job, easier commute, retirement) were the main factors behind longer distance moves crossing county lines. In 2021, CPS ASEC data reported that for inter-county moves, the number of housing-related reasons surpassed employment-related for the first time since 2005. With more employers offering remote work and the number of job openings at its highest since 2001, motivations for migration have shifted to factors affecting housing.
Inter-metro migration patterns
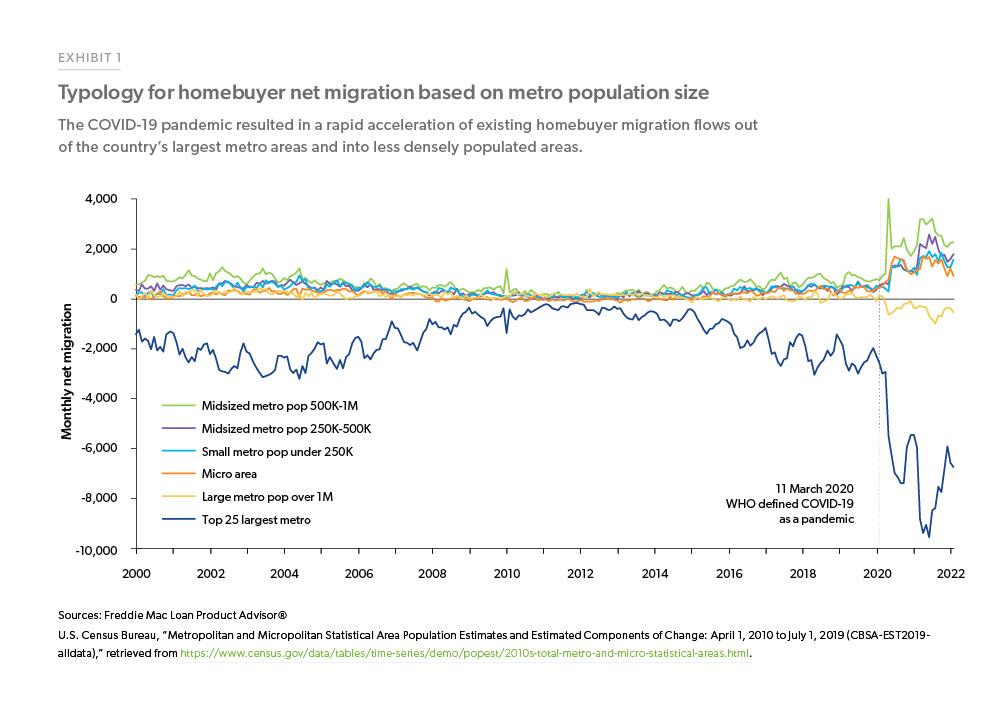
To better understand these factors, we calculated inter-metropolitan net migration using LPA owner-occupied purchase applications submitted between January 2000 and February 2022. By creating a typology for homebuyer net migration based on metropolitan population size, we gain important insights into migration trends before and after the start of the pandemic. The economic and social impact of COVID-19 resulted in an acceleration of homebuyer migration flows out of the country’s large metro areas and into midsized metro areas and less densely populated areas (Exhibit 1). While it is generally known the largest metro areas in the country were losing population in the past several years, relatively smaller metro areas with population over 1 million also began experiencing net outflows at the start of the pandemic. Interestingly, as of February 2022, while the pandemic seems to be abating and people are returning to some form of hybrid work, inflows into the remaining midsized metro areas and less populated places remain elevated. The persistence of the trend seems to suggest some form of suburbanization may be here to stay, which would have major implications for our economy, society and culture.
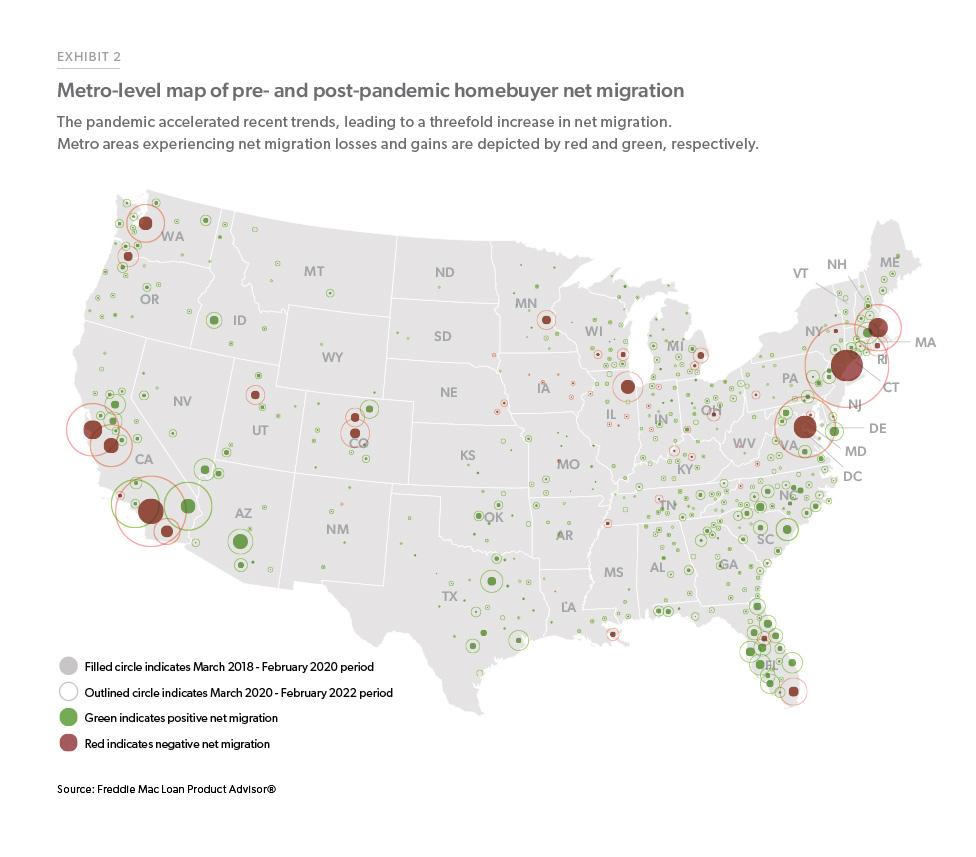
The map in Exhibit 2 breaks migration patterns down in more detail and reveals the highest homebuyer net migration losses have occurred in high-cost, inelastic markets located in coastal areas. Metro areas experiencing the most gains in homebuyer net migration are found more inland and to the South. The map also shows a remarkable threefold increase in homebuyer net migration between the two-year period occurring before and after the first confirmed case of COVID-19 in the country. The pandemic intensified existing migration patterns of homebuyers, driving housing demand to levels far exceeding that of supply. In 2021, the Freddie Mac House Price Index (FMHPI) reported that while house price appreciation rose to historical highs in the United States, the fastest rise occurred for those metro areas which experienced a surge of migrant homebuyers.
Gainers, losers and market movers
Between March 2020 and February 2022, the top ten metro areas gaining the most out-of-metro homebuyers consisted of more affordable interior markets and Southern beach destinations. On average, the median home price on loan applications submitted in February 2022 for these top 10 destinations was $128,000 less than the median home price in their metro of origin3 (Exhibit 3a).
The only exception was North Port-Sarasota-Bradenton, FL, with its median home worth $68,000 more than the median home in Tampa-St. Petersburg-Clearwater, FL. For this market, it is worth noting that the second top metro of origin was New York-Newark-Jersey City, NY-NJ-PA, where the median home price exceeded that of North Port metro by $115,000. During the same two-year period, the top ten metro areas losing the most out-of-metro homebuyers consisted of the country’s largest and most expensive markets (Exhibit 3b). The median home price in each of these metro areas exceeded the median home price in the destination metro areas by an average of $144,000.
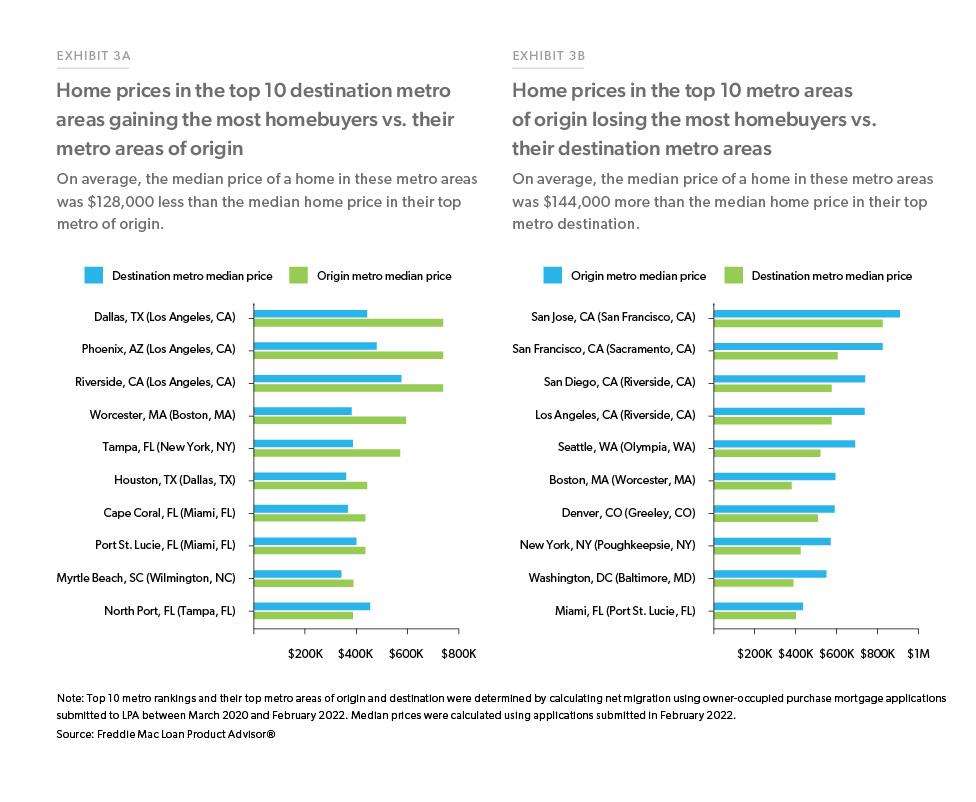
Exhibit 4 lists the top metro gainers and losers ranked by two-year homebuyer net migration between March 2020 and February 2022. Net migration in the two-year period occurring before the pandemic are displayed in the columns to the right. The top three metro gainers and losers based on changes in their net migration rankings also are highlighted.
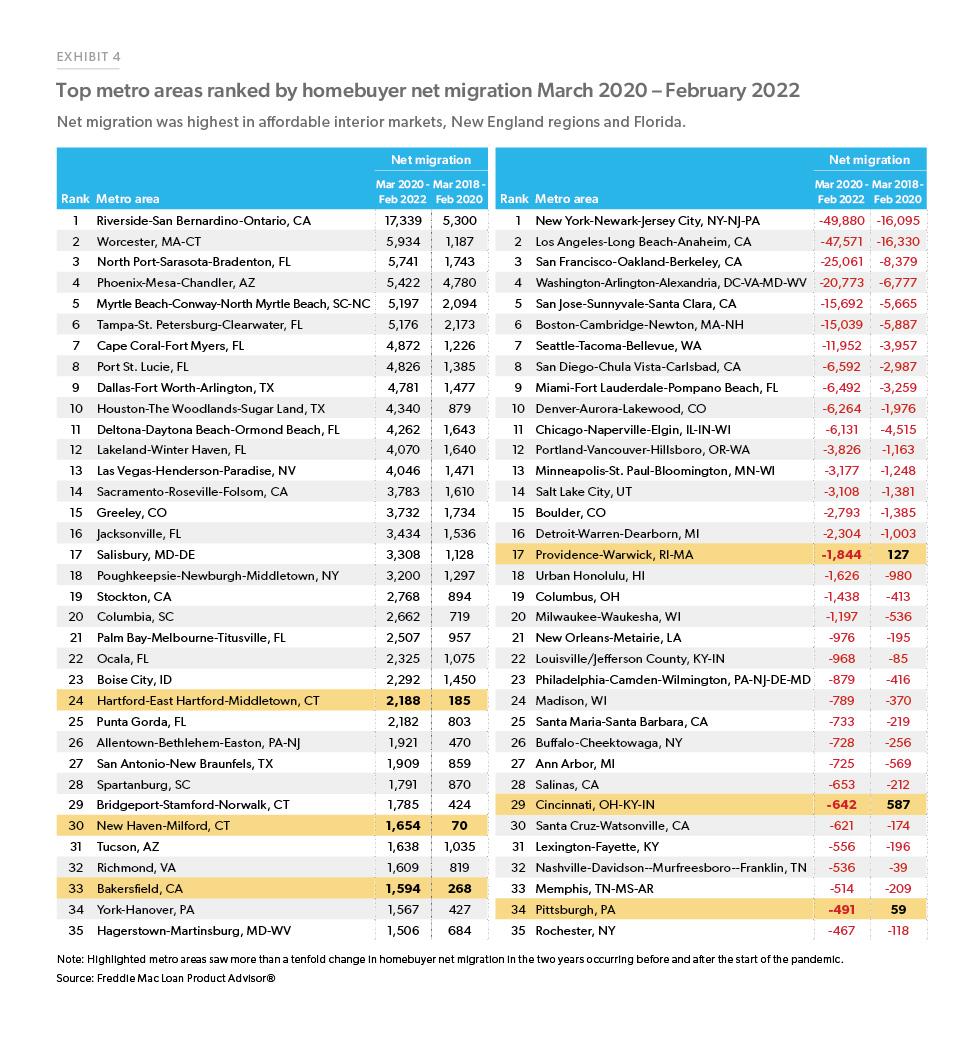
Among growing markets, Riverside-San Bernardino-Ontario, CA, remained in first place with its net migration increasing by more than 200% after the start of the pandemic. Phoenix- Mesa-Chandler, AZ, dropped from second to fourth place after Worcester, MA-CT, and North Port-Sarasota-Bradenton, FL, jumped to second and third place, respectively. Moreover, three New England markets with considerable upsurge in out-of-metro homebuyers were added to the list: Hartford-East Hartford-Middletown, CT; Bridgeport-Stamford-Norwalk, CT; and New Haven-Milford, CT.
In shrinking markets, the pandemic led to New York-Newark-Jersey City, NY-NJ-PA, moving up one spot to first place ahead of Los Angeles-Long Beach-Anaheim, CA. San Francisco-Oakland- Berkeley, CA, and Washington-Arlington- Alexandria, DC-VA-MD-WV, remained in third and fourth place, respectively. Furthermore, three markets shifted from positive to negative net migration: Providence-Warwick, RI-MA; Cincinnati, OH-KY-IN; and Pittsburgh, PA.
Previously red-hot markets have tempered
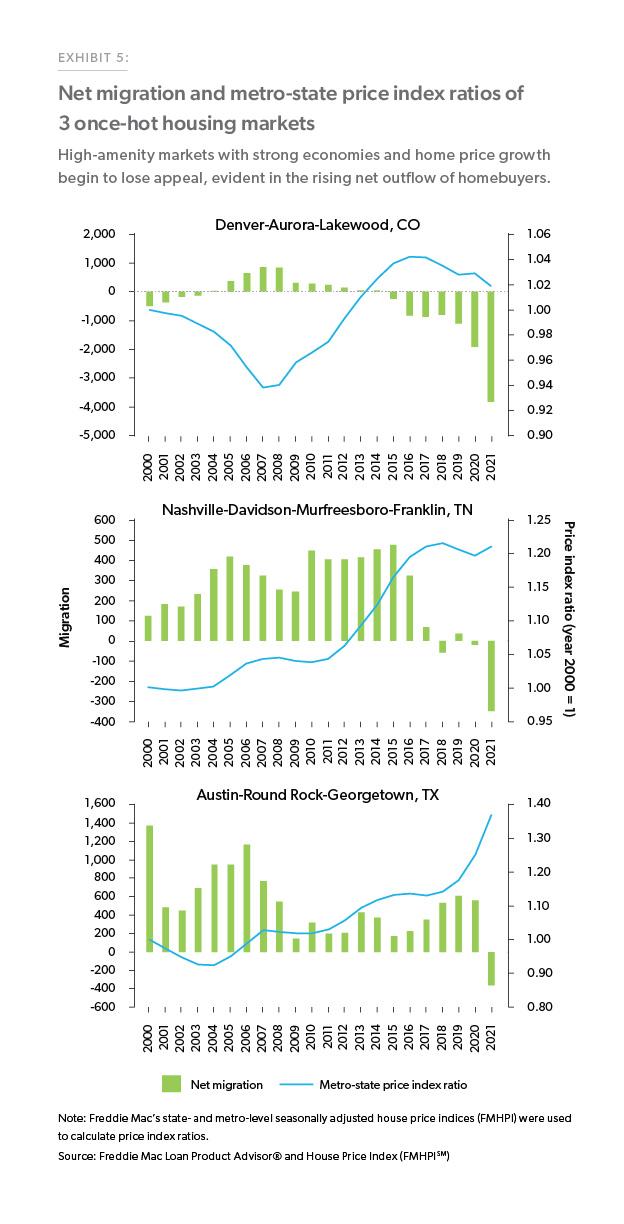
The pursuit of affordable housing can be seen through the lens of migration, observing the inflows and outflows of people in booming areas over time. High-amenity markets with strong economies have historically experienced rapid population increases driven by rising inflow of migrants. Even before the pandemic, single-family housing supply constraints were prevalent in fast- growing metro areas across the country, leading to extensive housing shortages and home prices outpacing resident incomes. This is a topic that we have written as affordable housing becomes an insurmountable obstacle for many buyers, the pendulum of migration swings back the opposite way towards higher net outflow. The graphs in Exhibit 5 plot the net migration and metro-state price index ratios of three metro areas recently considered to be some of the hottest markets in the U.S: Austin-Round Rock-Georgetown, TX; Denver-Aurora-Lakewood, CO; and Nashville-Davidson-Murfreesboro- Franklin, TN. Since 2012, as the flow of in-migration steadily increased and house prices in these areas appreciated faster than their surrounding state, out-migration also increased and eventually exceeded the number of homebuyers moving in. Denver started losing net migrants in 2015, followed by Nashville in 2018, and Austin in 2021.
Conclusion
The latest insights on homebuyer migration patterns using Freddie Mac LPA data show a population in pursuit of affordable housing. The pandemic amplified existing urban de-concentration by threefold from large, expensive metro areas to smaller, more affordable destinations. The data also shows that in fast-growing metro areas, the continued shortage of housing and high house-price-to-income ratios eventually lead to increased out-migration as homebuyers seek more affordable destinations. An important question remains: will builders, lenders, local governments and other housing advocates rise to meet the challenges impacting affordable housing—or will these growing markets eventually be confronted with the same problems of high costs, limited space and reverse migration faced by gateway markets?
The pandemic amplified existing urban de-concentration by threefold from large, expensive metro areas to smaller, more affordable destinations.
Understanding societal changes and shifts in population is vital to the success of affordable housing initiatives for both the public and private sectors. As a follow-up report, the second in a series on internal migration, Freddie Mac researchers will dive into recent socio-demographic trends of U.S. homebuyers.
Footnotes
- Integrated Public Use Microdata Series, IPUMS USA, University of Minnesota, www.ipums.org, 2020 American Community Survey 1-year sample
- The final LPA migration sample removed loan submissions in the prequalification stage and where the mortgage was unlikely to comply with Freddie Mac’s eligibility and underwriting requirements.
- For this metro of origin, we have considered the top metro of origin for each of the top 10 destination metro areas.
Prepared by the Economic & Housing Research group
Sam Khater, Chief Economist
Kristine Yao, Macro Housing Economics Director