The Cost of Homeowners’ Insurance
The cost of homeownership has risen significantly in recent years. This is largely driven by high mortgage payments fueled by elevated mortgage rates, but homeowners’ (HO) insurance costs also have a part to play – although at a smaller scale compared to mortgage principal and interest payments.
HO insurance provides financial protection against physical damage to a property.1 As such, it helps safeguard home values, especially in the event of large, unexpected losses resulting from natural disasters such as tornadoes, hurricanes and wildfires. However, as a recurring cost of owning a home, albeit a relatively smaller component, surging insurance premiums could add extra cost burdens on many households in this high borrowing cost environment. Using data from Uniform Closing Database (UCD)2 we estimate the cost of HO insurance over time and across the U.S.
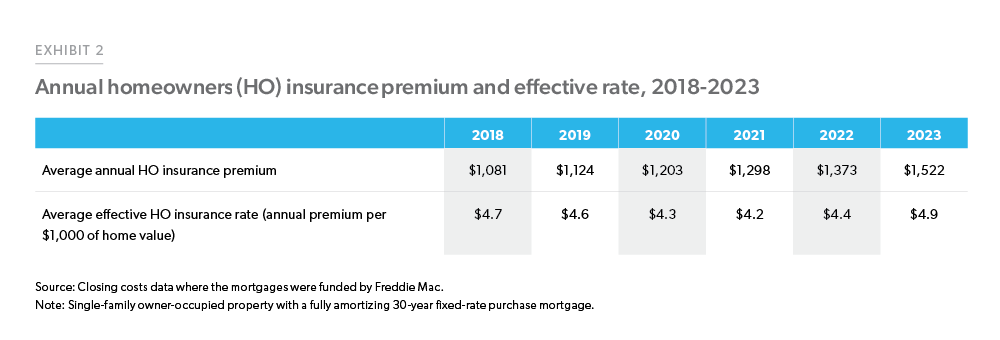
Based on our estimates, the average annual HO insurance premium (without adjustment) was $1,081 in 2018 among Freddie Mac borrowers for a single-family owner-occupied home with a conventional 30-year fixed-rate mortgage. By 2023, the average borrower had to pay an annual premium of $1,522, which was 10.8% higher than in 2022, and 40.8% higher than in 2018 (Exhibit 2).
Over the last five years, the value of homes owned by Freddie Mac borrowers, and therefore the value insured by HO insurance policies, has also changed. To facilitate comparison, we calculated the effective rate paid by each borrower by scaling the annual HO insurance premium over the home value. Note that the value of a home also includes the value of the land it sits on. Therefore, the actual effective HO insurance rates paid by policyholders are likely to be higher than our estimates, considering that HO insurance premiums are set based on the cost of rebuilding the home.
On average, the effective HO insurance rates have remained fairly stable. In 2023, the average borrower paid $4.90 in HO insurance premium for every $1,000 of their home’s value, compared to the 2018 rate of $4.70 per $1,000,3 showing a slight increase of $0.20.
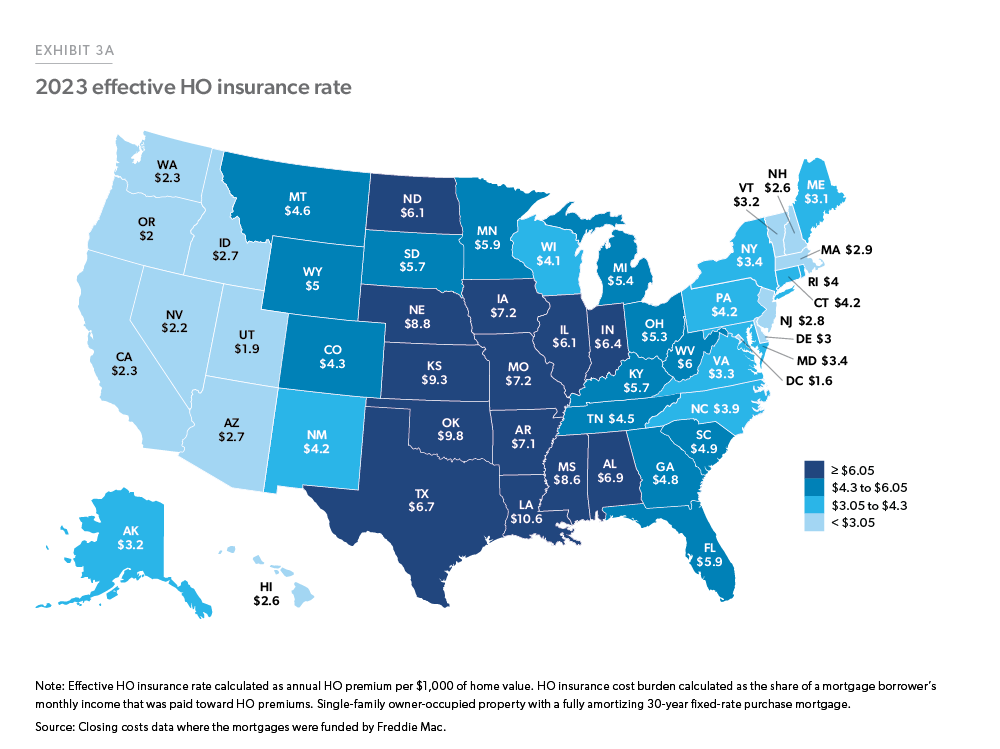
There is a large difference in the effective HO insurance rates paid by mortgage borrowers across the U.S. (Exhibit 3A). In 2023, mortgage borrowers from LA, OK, KS, NE, and MS paid an average HO insurance premium of over $8 for every $1,000 home value, whereas borrowers from CA, WA, NV, OR, UT, and DC paid less than $2.5 for every $1,000 home value. The higher rates observed in the central U.S. are consistent with aggregated statistics collected by the National Association of Insurance Commissioners (NAIC).4 While exposure to natural hazards is one of many factors that affect HO insurance rates across different states, varying regulatory environments may also play a role.5 In CA, for instance, insurance companies offering HO insurance are subject to strict regulation, which limits the rates they can charge. This may in part explain why we observe a relatively lower HO insurance rate in CA, compared to other similarly disaster-prone states such as LA and MS.
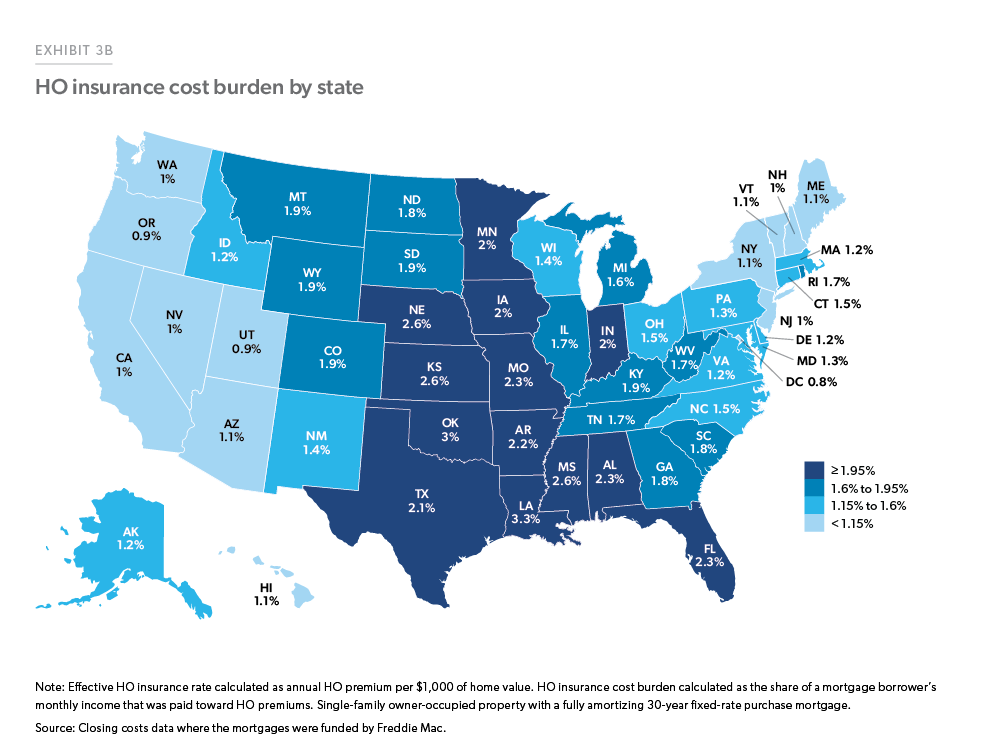
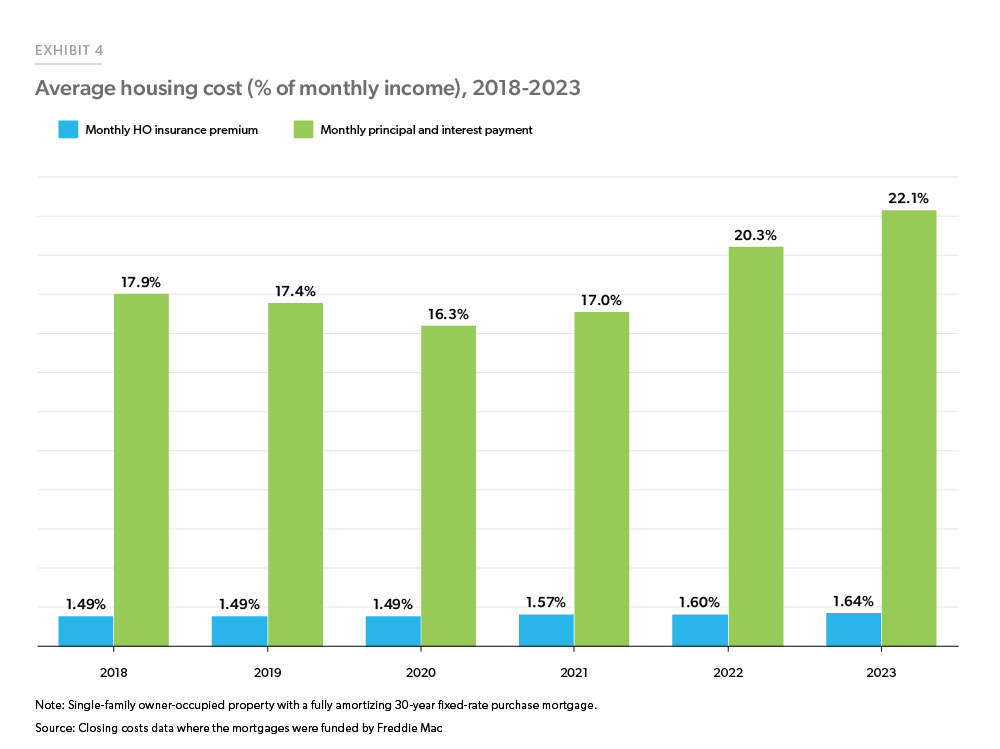
As HO insurance premiums continue to rise, one question of interest is how much of a financial burden these costs place on borrowers. To quantify the extent of associated cost burdens, we calculated the share of a borrower’s monthly income that was paid toward HO insurance premiums. Our analysis in Exhibit 4 shows that, in 2018, HO insurance premiums accounted for an average of 1.49% of a borrower’s monthly income. In 2023 the share had moved up by 10% to 1.64% of an average borrower’s income. The impacts were particularly significant in certain states such as LA, OK, KS, NE, and MS, where borrowers paid over 2.5% of their monthly income towards HO insurance premiums (Exhibit 3B). During the same period, borrowers also had to allocate a greater share of their income towards mortgage principal and interest payments, resulting in high housing cost burdens. Note that while we control for the type of property and occupancy status over time the average Freddie Mac borrower profile has changed between 2018 and 2023 and therefore the variation in insurance cost and P&I may arise from the changing borrower mix. Nevertheless, Exhibit 4 demonstrates that while insurance costs have added to cost burdens, the net impact is much smaller than the impact of higher mortgage principal and interest payments.
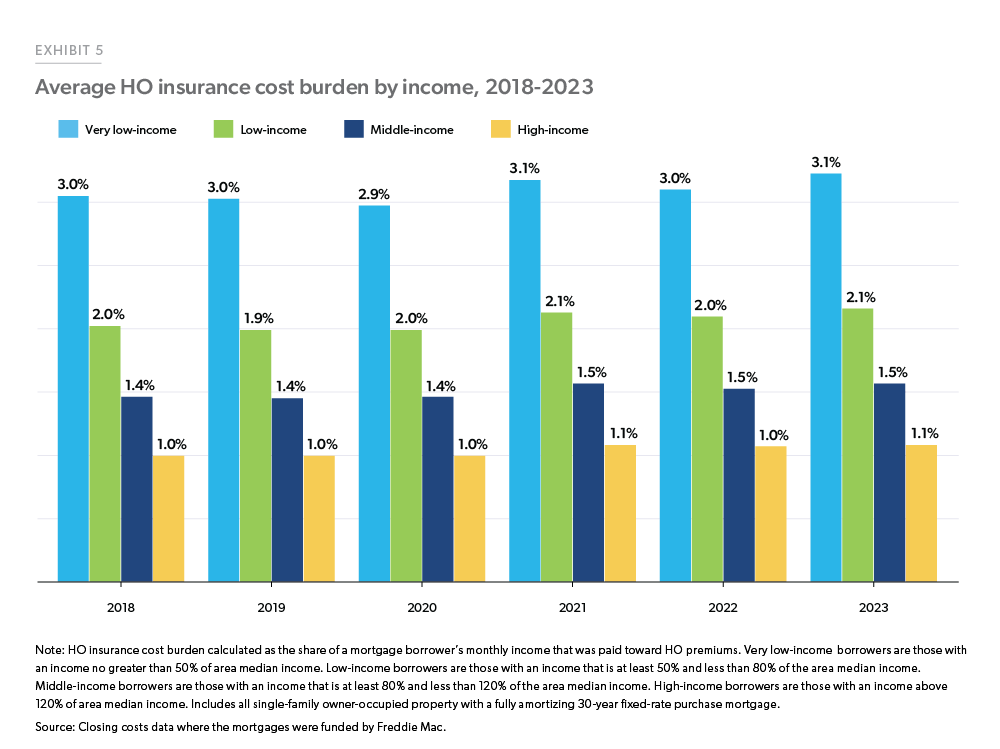
Despite widespread cost burdens across geographies, some homeowners, especially those with lower income, are affected more by increased costs of HO insurance. We find that between 2018 and 2023, very low-income borrowers (those with an income no greater than 50% of area median income) were consistently most burdened by such costs. As shown in Exhibit 5, in 2023, the HO insurance premiums took up 3.1% of their monthly income, which was significantly higher than low-income (2.1%), middle-income (1.5%), and high-income groups (1.1%).6
To conclude, as a component of ongoing housing expenses, HO insurance costs are growing but are a small fraction compared to the mortgage principal and interest payment. However, even a small incremental increase in HO insurance cost will impact those at the margin. Our findings highlight substantial heterogeneity in such costs and the cost burdens experienced by borrowers. We find that the effective HO insurance rates were the highest in the central U.S., leading to notable cost burdens in several states within this region. Among all income groups, lower-income borrowers were more challenged. While the costs of HO insurance remain a small fraction of housing expenses, it’s a trend that we will continue to track going forward.
Footnotes
- A standard homeowners insurance policy provides coverage for the structure of your home, your personal belongings, liability protection, and additional living expenses (e.g., if you cannot live in the insured home due to damage from a disaster). It does not cover damage to your land, or damage caused by floods or earthquakes.
- The UCD is a dataset jointly created by Fannie Mae and Freddie Mac to support the Consumer Financial Protection Bureau’s (CFPB) Borrower Closing Disclosure. It contains detailed records of the closing documents for all single-family loans purchased by the GSEs (Fannie Mae and Freddie Mac). The earliest UCD data goes back to September 2017. We combine UCD data with Freddie data to create our sample population of a single-family owner-occupied home with a conventional 30-year fixed-rate mortgage.
- For comparison, the average effective property tax rate among those with a mortgage was $11.5 per $1,000 home value nationwide
- NAIC (2023). Dwelling Fire, Homeowners Owner-Occupied, and Homeowners Tenant and Condominium/ Cooperative Unit Owner’s Insurance Report. https://content.naic.org/sites/default/files/publication-hmr-zu-homeowners-report.pdf.
- Oh, S., Sen, I., & Tenekedjieva, A. M. (2022). Pricing of climate risk insurance: Regulation and cross-subsidies. Available at SSRN 3762235.
- Low-income borrowers are those with an income that is at least 50% and less than 80% of the area median income. Middle-income borrowers are those with an income that is at least 80% and less than 120% of the area median income. High-income borrowers are those with an income above 120% of area median income.
Prepared by the Economic & Housing Research group
Sam Khater, Chief Economist
Len Kiefer, Deputy Chief Economist
Ajita Atreya, Macro & Housing Economics Manager
Rama Yanamandra, Macro & Housing Economics Manager
Penka Trentcheva, Macro & Housing Economics Senior
Genaro Villa, Macro & Housing Economics Senior
Song You, Macro & Housing Economics Senior
Jessica Donadio, Finance Analyst