Inflation Diffuses to More ‘Sticky’ Consumer Price Segments
After hitting 40-year highs in 2022, inflation has turned the corner and started to decline. The Consumer Price Index (CPI) in March 2023 rose 0.1% over the month and 5% over the year to register the smallest annual increase since May 2021. The increase was led by shelter inflation which increased 0.8% over the month and 8.1% over the year and accounted for over 70% of the increase in the headline index for all items. Other components such as energy, used cars and medical care declined over the month.
While the CPI basket is constructed to represent the average U.S. consumer, some items are purchased more frequently and thus are more salient in consumers’ minds. For example, many goods and services like groceries or gas are bought nearly every week. On the other hand, many items, such as airline tickets and durable goods like used cars, washing machines, etc., are only bought infrequently. Finally, the costs of some goods and services are locked in over a long time through a contract, including things like motor vehicle insurance and leases, and rents.
To better understand how inflation has moved over time, we group the various items in the consumer basket that the BLS uses to compute the CPI index into three groups based on the frequency of their purchase: frequent, infrequent, and contractual.1 The time series trends for these groups are presented in Exhibit 4.

While overall CPI growth averaged 2% over the nine-year period prior to the pandemic, inflation for frequent purchases only averaged 1% growth over the same period. This slow growth was mainly the result of lower growth in the prices of motor fuel, internet, and telephone services. During the same period, inflation for infrequent and contractual purchases marginally pulled up the CPI, averaging growth of 2% and 3%, respectively. During the mid-2010s, because of lower inflation for frequently purchased goods and services, overall inflation remained relatively stable. During the peak of price growth, the prices of frequent purchases increased roughly 15% on a year-over-year basis. However, in recent months, as the price of energy, medical care, fuels, and utilities comes down, we see that the increase in the frequent purchases component of CPI has been falling. On the other hand, unfortunately, as shelter inflation continues to increase, it is pushing up inflation for contractual purchases.

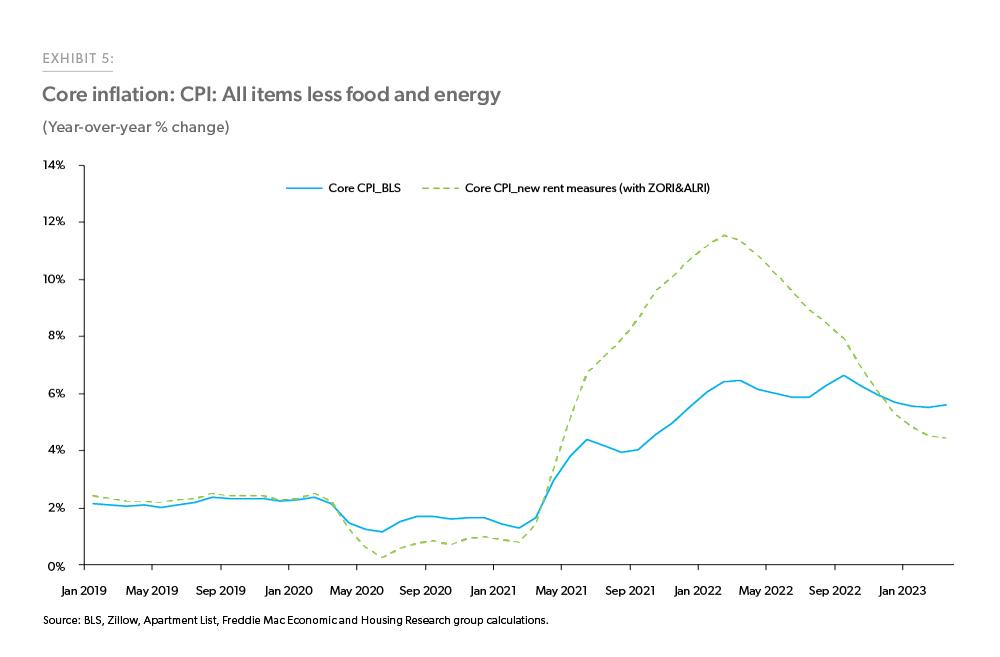
The BLS measures the shelter component of inflation in the CPI by using a sample of all rental units, regardless of whether the rent was reset during the sample period. By construction, this causes the CPI shelter index to lag market-based measures of rent that capture the rents of newly leased units. During periods of accelerating/decelerating rents, market-based measures of rents on newly leased units will adjust faster than the rent on all units while official measures tend to lag. Because shelter has such a high weight in the overall CPI, this builds in substantial inertia in the official inflation statistics. By substituting market-based measures of rent into the “core” CPI for all items, less food and energy, we can get a sense of how large the impact is.
In Exhibit 5, we present an alternative core CPI and energy measure that replaces the rent component with the Apartment List Rent Index (ALRI) and the owner equivalent rent with the Zillow Rent Index (ZORI).2 This alternative measure of rents showed much larger inflation in 2021 and early 2022, peaking at 11.5% in February 2022 vs. the peak in the published core CPI of 6.6% in September of 2022. In the latest data for March 2023, the published core CPI was 5.6% versus only 4.4% in our alternative measure.
The alternative index presented in Exhibit 5 shows that official inflation measures may be overstating the rate at which prices are increasing in recent months. But it also shows that even after adjustment, the core CPI is increasing at a rate far above the rate of inflation consistent with the Federal Reserve’s definition of price stability.
Footnotes
- We exclude some components for which data is not available. These add up to 0.012% of the total weight for the overall CPI basket. Frequent purchases are made regularly—mostly on a monthly basis—and include goods and services like food, utilities, domestic services, personal services, internet, and telephone services. Infrequent purchases occur few and far between and include vehicles, apparel, household furnishings, computers, etc. Contractual purchases consist of components for which contracts are written—usually on an annual basis—and include rent, health and vehicle insurance.
A similar alternative measure was suggested by Harvard economist and former CEA chair Jason Furman in a series of tweets. We compute the core CPI by using the following formula:

Prepared by the Economic & Housing Research group.
Sam Khater, Chief Economist
Len Kiefer, Deputy Chief Economist
Rama Yanamandra, Macro & Housing Economics Manager
Ajita Atreya, Macro & Housing Economics Manager
Penka Trentcheva, Macro & Housing Economics Senior
Genaro Villa, Macro & Housing Economics Professional
Brandon Recto, Analyst