Economic, Housing and Mortgage Market Outlook – May 2023
Economic Risks Remain Weighted to the Downside Because of Stubborn Inflation
Dampened affordability and low inventory impacting sales and originations while prices remain solid, for now
Recent data suggest the glass is more than half full: a growing economy, a strong labor market, and relatively resilient first-time homebuyer demand despite poor affordability. Below we summarize key recent developments, then provide our opinion on the outlook as well as a breakdown on the topic of inflation.
Recent developments in the U.S. economy
GDP grew at a 1.1% annualized rate in the first quarter of 2023, according to the U.S. Bureau of Economic Analysis’ advanced estimate. That was a decline from the revised estimate of 2.6% annual growth in the fourth quarter of 2022. This represents three consecutive quarters of positive GDP growth following two quarterly declines in the first and second quarters of 2022. While many people use two consecutive quarters of negative GDP growth as a rule of thumb for determining a recession, it is clear from recent economic data that the U.S. economy did not enter a recession in 2022, and at least through the first quarter of 2023 remains on the path of modest growth.
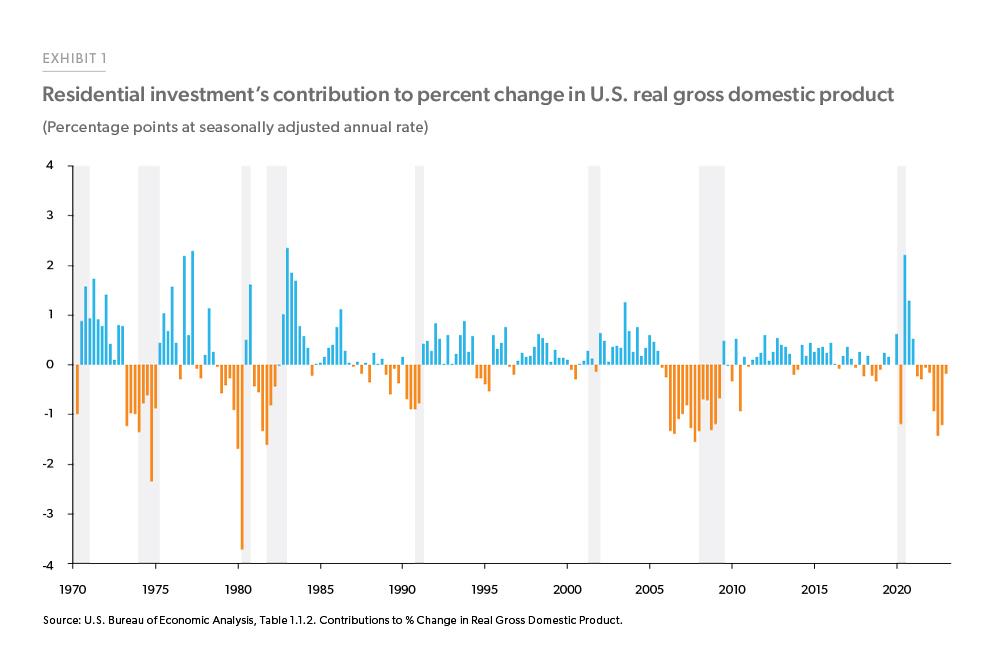
However, concerns about the future path of economic growth remain elevated. Despite the positive topline GDP growth number for the first quarter of 2023, there remains some cause for concern. Housing continues to be a drag on the economy. Residential investment subtracted from growth again in the first quarter, marking the eighth consecutive quarter that residential investment’s contribution to GDP growth was negative. Housing has traditionally been a strong predictor of broader economic growth. Exhibit 1 (following page) shows that since 1970, every time residential investment subtracted from growth for five or more consecutive quarters, a recession soon followed.
Most of the incoming data points to a strong labor market, though there are some signs of a potential cooldown. The U.S. economy added 253,000 jobs in April, and the unemployment rate dropped to 3.4% equaling the lowest rate in more than 50 years. Although job openings pulled back by 384,000 to 9.6 million, there is still more than one job available for each unemployed person, as indicated by the job openings to the unemployed ratio, which in March was at 1.64. However, layoffs and discharges jumped by 248,000 to 1.8 million in March, signaling that the red-hot U.S. labor market may be starting to cool off.
Economic risks remain weighted to the downside largely because inflation remains stubbornly high. Though the rate of consumer price inflation has fallen, inflation rates are still far above the Federal Reserve’s target of 2% inflation. In addition, some of the most recent inflation indicators, the Employment Cost Index and the core PCE price index came in stronger than expected.
Recent developments in the U.S. housing market
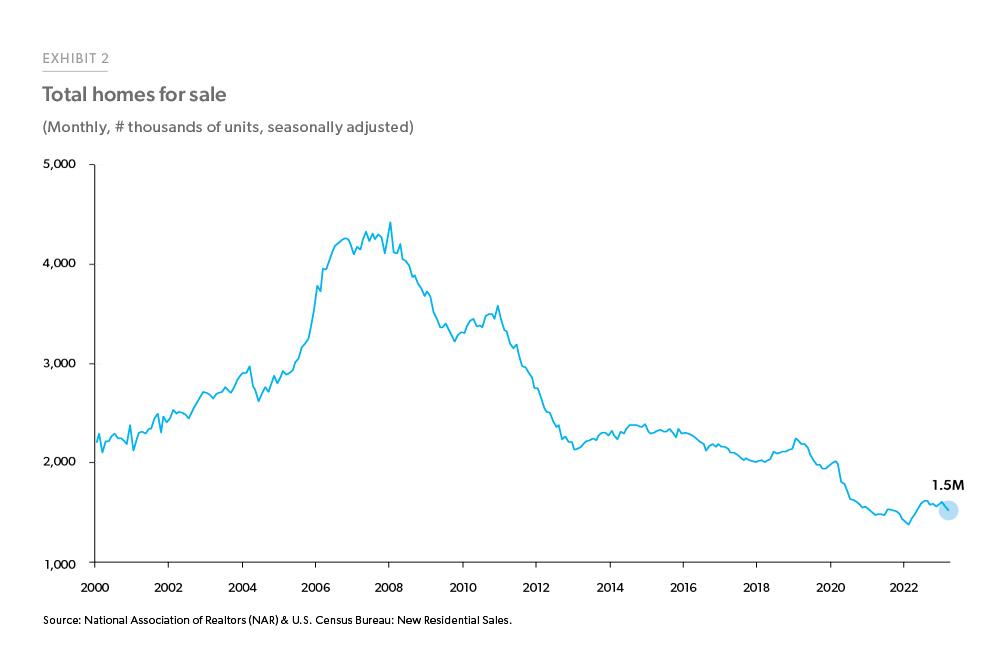
Higher mortgage interest rates remain a significant challenge for the housing market in the current seasonal peak in homebuying activity in April-May. The National Association of Realtors (NAR) reported that existing home sales fell 2.4% month-over-month and 22% year-over-year to 4.44 million units in March 2023. The housing market continues to be challenged by low inventory levels of for-sale homes. For example, NAR indicated that the months’ supply of homes available for sale was just 2.6 months, and on average properties remained on the market for 29 days in March. Additionally, Exhibit 2 shows that the total single-family homes for sale (new and existing) is near historic lows at 1.5 million units.
Little relief for inventory will come from newly constructed units. Housing starts were also down in March, with Census and HUD jointly reporting that starts were at 1.42 million in March 2023, down 0.8% month-over-month and 17% year-over-year. Cumulatively, 2023 single-family housing starts had the slowest first quarter since 2019.
Confidence in the future path of the housing market remains low, with the National Association of Home Builders reporting a Housing Market Index reading of 45 in April 2023. Anything under 50 in that index indicates negative sentiment on balance. The overall index was weighed down by a weak homebuyer traffic rating of 31, while the current sales conditions subindex was mildly positive at 51 and the future sales expectation subindex was exactly balanced between positive and negative at 50.
While transaction volumes remain low compared to a year ago, and sentiment is mixed, home prices have gone from modest declines to modest increases in the latest data. Per the latest report from FHFA, the national Purchase-only House Price Index was up 0.5% in February after seasonal adjustment. The S&P CoreLogic Case-Shiller 20-city Composite Home Price Index was also positive in February 2023.
There is a high degree of uncertainty around these estimates, given that the recent market volatility has been larger than usual and seasonal adjustments remain challenging in a shifting market. Signals are pointing to the potential beginnings of a return to modest growth in house prices nationally. However, our own approach to forecasting house prices remains conservative, and our corporate forecast (described below) calls for modest declines in house prices over the next two years.
Recent developments in the U.S. mortgage market
In the week of May 4, 2023, the U.S. weekly average mortgage interest rate in our Primary Mortgage Market Survey® was 6.39% for the 30-year fixed. This is up 1.12 percentage points from a year ago, but down from the peak of 7.08% in the week of November 10, 2022. After peaking last fall, mortgage rates have been drifting mostly sideways staying in the range of 6 to 6.5%. This is welcome stability for the housing market that saw a record increase in mortgage rates during the calendar year 2022.
Though mortgage rates are substantially higher than they have been on average over the past decade, from an historic perspective rates are about average. For example, since starting on April 4th, 1971, Freddie Mac conducted 2,718 weekly surveys and 62.5% of the time mortgage rates were at least as high as they are now.
The suddenness of last year’s rate increase creates some challenges for the mortgage market. As seen in Exhibit 3 (following page), very few mortgage loans are now in-the-money for a refinance, with only about $60 billion out of over $7 trillion of 30-year mortgages securitized in Freddie, Fannie or Ginnie Mortgage-Backed Securities anywhere close to in-the-money for a rate-and-term refinance. In addition, if we look at aggregate statistics for outstanding residential mortgages as of the fourth quarter of 2022 from the FHFA’s National Mortgage Database, nearly 2 out of 3 had an origination interest rate of 4% or less. Interest rate lock-in is impacting the resale market by keeping some potential move-up or move- down homebuyers on the sidelines. Thus, listings are down substantially as well as sales, helping keep inventory relatively tight and remodeling activity high.
With unemployment low and household income still buoyed from excess savings relative to historical averages, mortgage performance remains good on aggregate. Per the latest National Delinquency Survey from the Mortgage Bankers Association, as of the 4th quarter of 2022 only 1.38% of all mortgage loans serviced were 90 days or more past due or seriously delinquent. Among conventional loans, less than 1% were seriously delinquent, while the rate for FHA loans was 3.39% and for VA loans was 1.75%. According to our Monthly Volume Summary for March 2023, Freddie Mac seriously delinquent rates were just 0.62%, down from 0.66% in February.
Though mortgage rates are substantially higher than they have been on average over the past decade, from an historic perspective rates are about average.

The outlook
In this section we provide a qualitative narrative outlook. In addition to commenting on a broad array of issues, including the macroeconomy, we focus on the housing and mortgage market, particularly on home sales, house prices, and mortgage originations. This replaces the quantitative forecast table we used to publish.
General economy, rates, inflation
Our baseline outlook does not include a recession. Instead, our view is based on an economy that slows and sees a modest uptick in unemployment, while inflation continues to moderate. In this scenario, long-term interest rates move largely sideways, staying in a range similar to where rates are today, perhaps moving up or down by around half a percentage point.
Home sales
Higher mortgage interest rates have substantially dampened affordability and will continue to weigh on home sales. With so many existing homeowners locking in low mortgage rates, inventory will remain a challenge as fewer people list homes. Additionally, if the economy avoids a recession, unemployment will not spike, and forced selling will also not spike. A stable interest rate environment will enable home sales to level off and gradually resume modest growth, although it will likely be several years before volumes return to the heights we saw in 2021.
Home prices
While home prices have been positive in most markets, it is still too early to fully separate the signal from the noise, and employment is likely to weaken, so we maintain a cautious outlook for prices. Our official corporate forecast calls for house prices to fall 2.9% over twelve months through Q1 of next year and an additional 1.3% over the subsequent twelve months.
Mortgage originations
With so few mortgages in-the-money for a rate refinance, refinance origination volumes will remain low. Mortgage rates would have to fall substantially to bring a large number of refinances. But as rates ebb and flow, some opportunities will present themselves and a trickle of refinances will flow through. There also remains refinance demand for non-rate-related reasons, such as the cancellation of FHA Mortgage Insurance Premiums by refinancing into a conventional loan and term extension. On the purchase side, low levels of home sales coupled with falling national house prices will likely keep home purchase originations flat this year. But, as home price growth turns positive and home sales gradually rise, purchase originations will resume modest growth in the second half of this year and into the next.
See the May 2023 spotlight on inflation, “Inflation Diffuses to More ‘Sticky’ Consumer Price Segments.”
Prepared by the Economic & Housing Research group.
Sam Khater, Chief Economist
Len Kiefer, Deputy Chief Economist
Rama Yanamandra, Macro & Housing Economics Manager
Ajita Atreya, Macro & Housing Economics Manager
Penka Trentcheva, Macro & Housing Economics Senior
Genaro Villa, Macro & Housing Economics Professional
Brandon Recto, Analyst