Economic, Housing and Mortgage Market Outlook – June 2023
Although the Macroeconomic Outlook Remains Uncertain, the Homeownership Rate Continues to Grow, Particularly Among Below-Median Income Families
The overall increase in the total homeownership rate can be attributed to the strong growth in the below-median family income homeownership rate, which has sharply increased since 2016 from 48.0% to 53.4%
The U.S. economy is stalling as higher interest rates weigh on interest rate-sensitive sectors like housing. But the U.S. consumer has been resilient, and the broader economy has weathered several adverse shocks over the past year and a half, avoiding a recession so far. While housing market activity has slowed, the favorable demographic tailwind from a large cohort of potential first-time homebuyers has bolstered the market and led to some surprising trends in homeownership.
Recent developments in the U.S. economy
The U.S. Bureau of Economic Analysis revised Gross Domestic Product (GDP) growth upward 0.2 percentage points to an annualized rate of 1.3 % in the first quarter of 2023. Though this is the third consecutive quarter of positive GDP growth, the pace is slowing due to a continued drag in residential fixed investment. With the second estimate of GDP also comes the first estimate of Gross Domestic Income (GDI), which decreased 2.3% in the first quarter of 2023.
In theory, GDP and GDI should be identical as they are both estimates of aggregate output. GDP measures expenditures while GDI measures income; as a rule, aggregate expenditures always equals income. However, research has shown that the GDI measure can be more predictive of future output growth than GDP, and the Philadelphia Federal Reserve Bank’s GDPplus combines both GDP and GDI to produce a composite estimate.1 GDPplus as of May 25, 2023, estimates output growth at -1.4% and -1.2% for Q4 2022 and Q1 2023 respectively. If the GDPplus measure is accurate, then the U.S. economy has begun to contract; however, because employment remains strong, this implies that productivity must be falling.
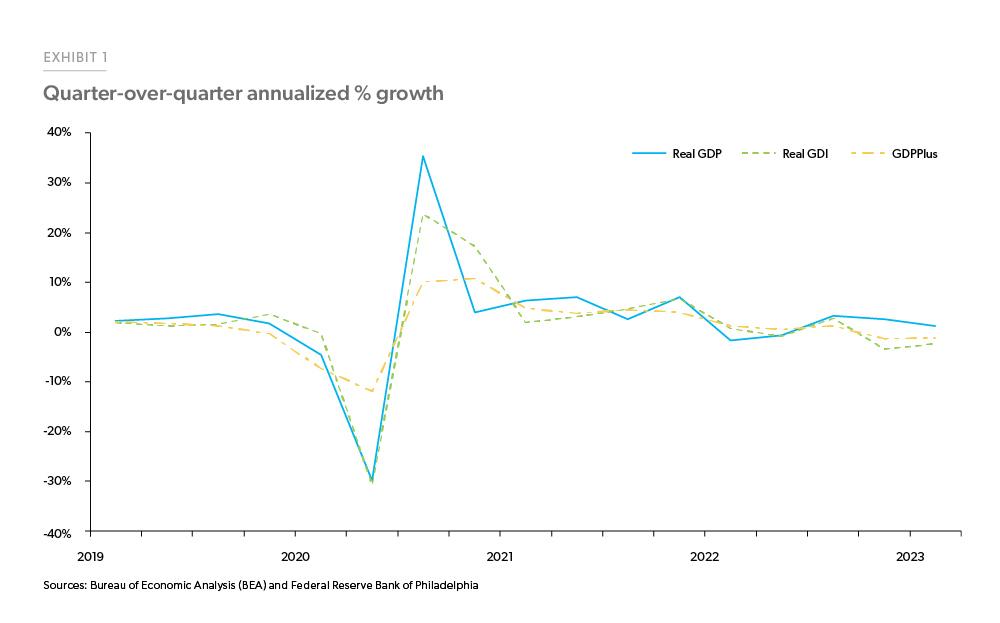
The negative correlation between productivity and monetary policy has been studied in many recent academic papers, see for example Jordà et al. (2020) and Meier et al. (2022).2 Falling productivity was associated with the monetary tightening of the high-inflation episodes in the 1970s and early 1980s in the U.S., and negative output per hour growth preceded each of the recessions of that period. Output per hour growth in the U.S. has been negative since the first quarter of 2022.
Despite the potential contraction in activity indicated by GDI, the labor market remains resilient.
Despite the potential contraction in activity indicated by GDI, the labor market remains resilient. The unemployment rate did increase in May by 0.3 percentage points to 3.7%; the largest month-over-month increase since the onset of the COVID-19 pandemic. However, an increase in job openings caused the ratio of job openings to unemployed persons to jump up to 1.79 in April 2023 from 1.67 the month before. Despite the rise in the unemployment rate reported in the household survey, the establishment survey reported that nonfarm payrolls increased by 339,000 in May. In addition, average hourly wages increased 0.3% over-the-month, and 4.3% year-over-year to $33.44/hr.
Inflation continues to slow from its peak in September 2022 but remained high in April at 4.7% year-over-year according to the U.S. Bureau of Economic Analysis’ “core” price index for personal consumption expenditures excluding food and energy. The annual growth rate in the price index for services less housing has continued to hover between 4.3% and 5.2% since April 2021 and currently sits at 4.8% year-over-year
Recent developments in the U.S. housing market
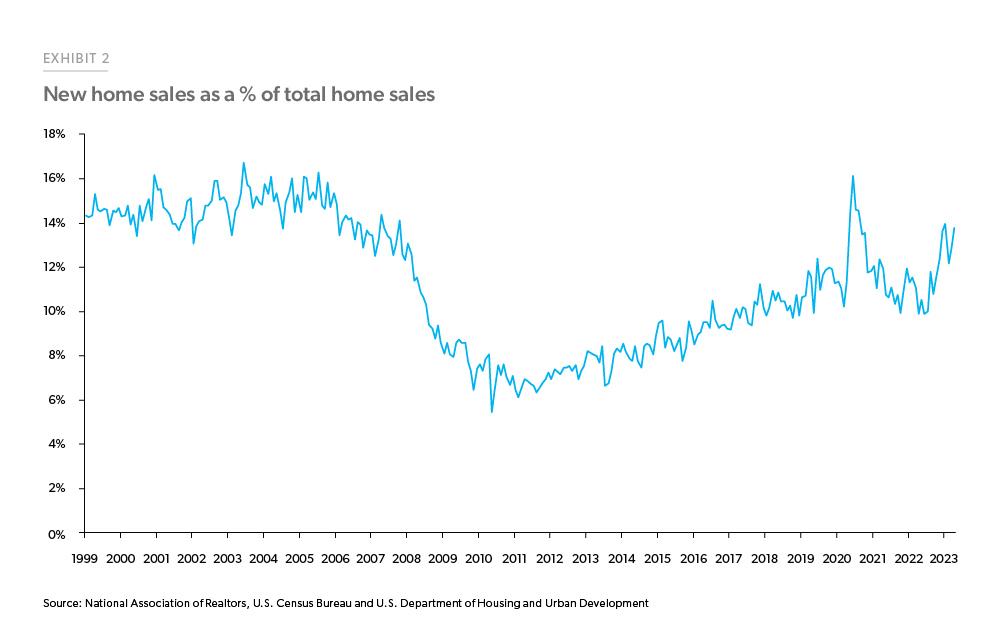
Per the National Association of Realtors, existing home sales receded 3.4% in April to a seasonally adjusted annual rate of 4.28 million, while a separate joint release from the U.S. Census Bureau and U.S. Department of Housing and Urban Development surprised on the upside and reported that new home sales increased 4.1% in April. Through the first four months of the year, existing home sales have averaged a 4.3 million seasonally adjusted annual rate, representing a 14% decline from last year’s 5 million sales. Meanwhile, new homes have averaged a seasonally adjusted annual rate of 655,000 sales, representing a 2% increase from last year. The simultaneous decline of existing home sales and increase of new home sales has shifted the composition of the home sales market toward new home sales. Excluding the temporary spike due to the onset of the COVID-19 pandemic, of new home sales as of April 2023 comprise the largest percentage of total home sales since 2008 (Exhibit 2).
There is 2.9 months’ supply of existing homes at the current sales rate, and existing homes remained on the market for only 22 days in April according to NAR. New homes, on the other hand, have 7.6 months’ supply, according to the U.S. Census Bureau. Overall, the total number of single-family homes available for sale remains low at 1.3 million units, only 8.1% above its all-time low in February 2022. Furthermore, as the number of existing homes available for sale has dwindled while available new homes are relatively higher, the share of active for-sale inventory of new homes has reached near 30% (Exhibit 3).
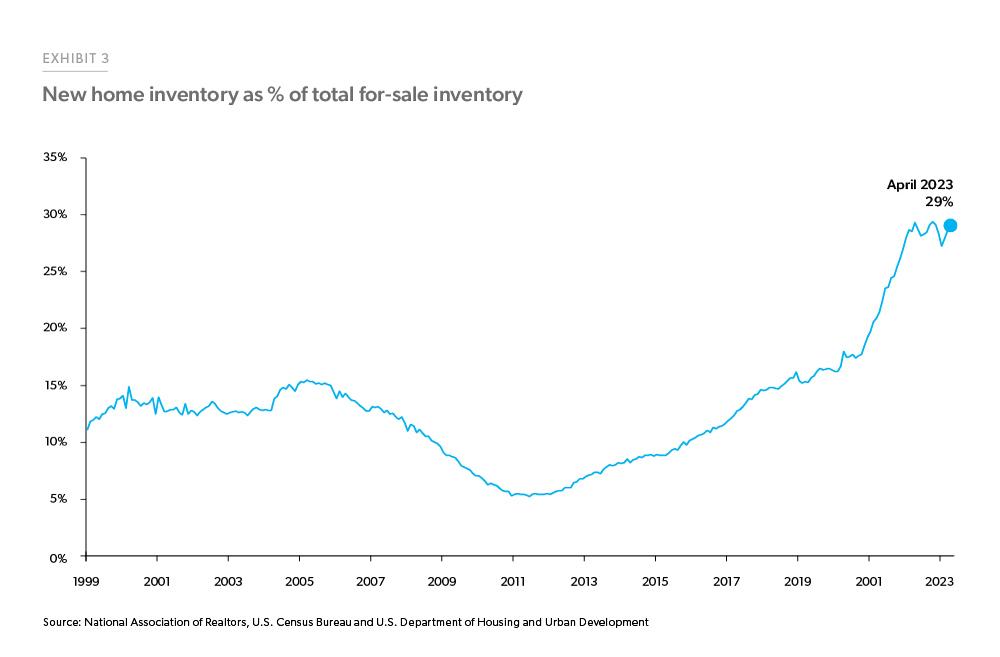
The divergence between the new and existing home sales markets is suggestive of a substantial rate lock-in effect: homeowners with lower rates on their mortgages have a lower propensity to list their homes for sale and move due to the elevated rates of today, which pushes prospective buyers into the new-home market. This dynamic is consistent with the trends highlighted in Exhibits 2 and 3.
Though sales and supply are lagging, there are signs that the housing market is starting to rebound. The NAHB reported that builder sentiment increased to an index value of 50 in May, indicating that building conditions are balanced even in the face of tight credit conditions. The increase in sentiment is primarily due to current sales conditions and 6-month sales expectations, which both increased into positive sentiment territory in May. Starts and permits for single-family homes increased by 1.6% and 3.1%, respectively, over the month of April on a seasonally adjusted basis, according to the U.S. Census Bureau.
House prices continue to firm up in the short run. Per the FHFA’s purchase-only house price index, house prices increased 0.6% from February to March 2023. However, the national figures do not represent all regions equally as there is substantial regional heterogeneity, with monthly house price changes ranging from +1.5% in the East North Central Division to -1.3% in the Mountain Division.
Recent developments in the U.S. mortgage market
After spending two months in a narrow range between 6.28% and 6.43% from mid-March through mid-May, mortgage rates measured by the U.S. weekly average 30-year fixed mortgage rate in our Primary Mortgage Market Survey® have resumed their ascent in recent weeks. In the week of June 1, rates reached 6.79%, the highest reading since November of last year.
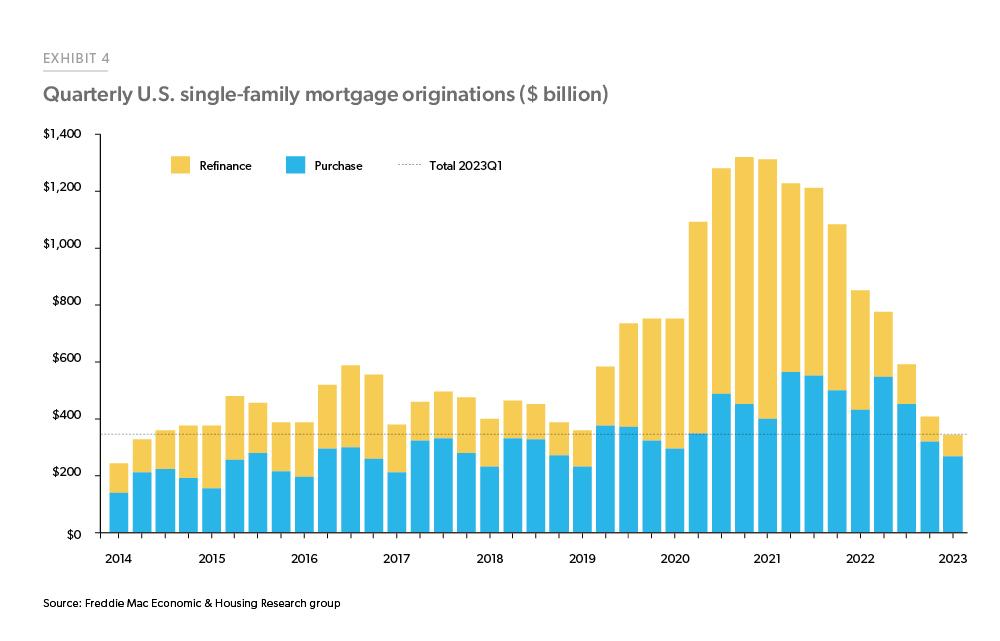
According to our estimates shown in Exhibit 4, mortgage originations in the first quarter of 2023 were just $344 billion, the lowest quarterly total since the second quarter of 2014. Higher mortgage rates are dampening mortgage application activity. Purchase applications were down 6.9% during the last week of May, while refinance applications dropped 11% after seasonal adjustment. Due to seasonality in the housing market, mortgage originations will likely increase in the second quarter, but full-year 2023 originations will almost certainly be below 2022 levels.
With a strong labor market and house prices resuming modest increases, overall mortgage performance is strong, especially when compared to other types of credit. According to data from Transunion the share of loans 60 days or more past due fell 0.01 percentage points from Q1 2021 to Q1 2023 for mortgages, while it increased by 0.36 percentage points for autos, 0.80 percentage points for Bankcards and 1.1 percentage points for unsecured personal loans over the same period. Per Transunion, subprime auto delinquency rates for the Q2 2022 vintage over nine months are up 3.16 percentage points relative to the Q2 2019 vintage, while delinquency rates for prime borrowers are only up 0.97 percentage points over the same period.
Overall credit performance remains solid for higher credit quality borrowers, but that is in an economy with unemployment rates below 4%. If the labor market outlook darkens, mortgage performance could weaken, and rising delinquency rates spread to higher credit quality borrowers.
The outlook
The macroeconomic outlook, and thus also the future of the housing and mortgage markets, remains uncertain. Macroeconomic indicators like GDI and inflation point to a slowing economy that could tip into recession if hit with a significant adverse shock. However, our baseline view does not include a recession, rather only a slowdown in growth and a modest uptick in unemployment as the most likely scenario. In establishing this baseline view, risks are weighted to the downside.
Macroeconomic indicators point to a slowing economy that could tip into recession if hit with a significant adverse shock. However, our baseline view predicts only a slowdown in growth and a modest uptick in unemployment.
General economy, rates, inflation
The U.S. economy, which primarily hinges on consumer spending, will slow down once consumers’ buffer of savings are depleted. But its impact on the economy will be limited unless it is accompanied by a substantial negative economic shock. In the past year and a half, the economy has weathered adverse shocks (war, banking failures) and avoided slipping into recession. Part of the reason for the resilience of the economy is the resilience of the U.S. consumers, who still have substantial savings to draw on and can bolster the economy despite a decline in employment.
Under our baseline scenario, the unemployment rate gradually moves modestly higher, enough to slow the economy but not trigger a full-blown recession. In that scenario, we expect inflation to cool but remain above the Federal Reserve’s target of 2% and mortgage rates to move mostly sideways, most likely remaining above 6% through year-end.
Home sales
Our housing outlook, particularly for home sales, remains muted due to the challenges presented by higher mortgage rates and a slowing economy. However, not all the trends in the housing market are unfavorable. Despite the substantial affordability challenges, first-time homebuyers continue to come to the market and have contributed to an increase in homeownership rates as discussed in our spotlight section below.
Home prices
While home prices have been positive in most markets, it is still too early to separate the signal from the noise fully, and employment is likely to weaken, so we maintain a cautious outlook for prices. Our official corporate forecast calls for house prices to fall 2.9% over twelve months through Q1 of next year and an additional 1.3% over the subsequent twelve months.
Mortgage originations
The refinance market will remain muted this year, given the expected path for mortgage rates. On the home purchase side, we expect mortgage originations to stay flat this year. Purchase originations will start to strengthen later this year as home sales stabilize, and they will resume modest growth in 2024.
See the June 2023 spotlight on homeownership rates, "The Below-Median Income Homeownership Rate is Surging."
Footnotes
- Aruoba, S.B., Diebold, F.X., Nalewaik, J., Schorfheide, F. and Song, D., 2016. Improving GDP measurement: A measurement-error perspective. Journal of Econometrics, 191(2), pp.384-397.
- Jordà, Ò., Singh, S. R., & Taylor, A. M. (2020). The long-run effects of monetary policy (No. w26666). National Bureau of Economic Research., and Meier, M. and Reinelt, T., 2022. Monetary policy, markup dispersion, and aggregate TFP. Review of Economics and Statistics, pp.1-45.
Prepared by the Economic & Housing Research group
Sam Khater, Chief Economist
Len Kiefer, Deputy Chief Economist
Rama Yanamandra, Macro & Housing Economics Manager
Ajita Atreya, Macro & Housing Economics Manager
Penka Trentcheva, Macro & Housing Economics Senior
Genaro Villa, Macro & Housing Economics Professional
Brandon Recto, Analyst