Economic, Housing and Mortgage Market Outlook – September 2023
Key observations
- While overall economic growth has been resilient, the labor market shows signs of cooling off, with job openings down and job growth softening. The labor market slowdown may help reduce inflationary pressures. MORE ON THE U.S. ECONOMY
- Mortgage rates have been on the rise again and have reached levels not seen since 2001. MORE ON THE HOUSING MARKET
Recent developments in the U.S. economy
According to the U.S. Bureau of Economic Analysis, economic growth remained firm despite the slight downward revision of second quarter 2023 GDP growth from 2.4% to 2.1%. The GDP revision reflected downward revisions to private inventory investment and nonresidential fixed investment. However, consumption spending was revised slightly up from an annualized rate of 1.6% to 1.7%. The positive GDP growth defied earlier recession predictions from some analysts.1
However, there also have been recent downward revisions to the labor market. According to the latest employment report from the Bureau of Labor Statistics (BLS), the U.S. economy added 187,000 jobs in August 2023, led by health care, leisure and hospitality, social assistance, and construction. Nonfarm payroll growth was revised down by 104,000 for June and 58,000 for May 2023 (Exhibit 1). In the second estimate for July 2023, employment numbers were revised down by 30,000.
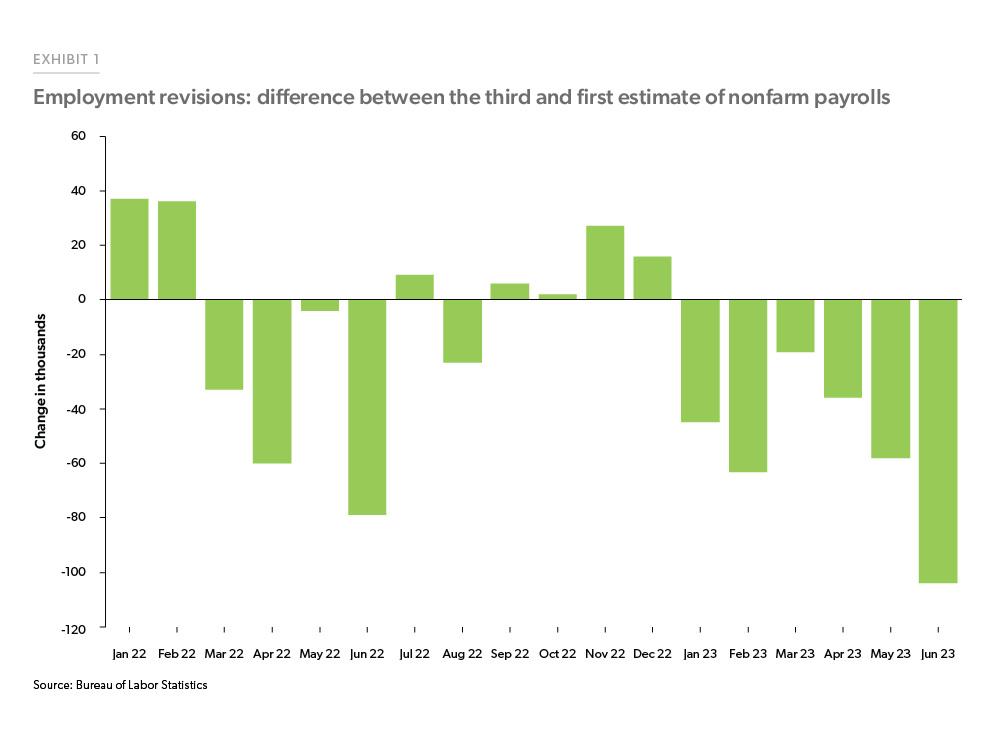
Every initial nonfarm payroll employment report through June of this year has been revised down, and the cumulative change in nonfarm payrolls is approximately 325,000 fewer than originally reported. However, even with these revisions, the economy has still added 1.5 million nonfarm payroll jobs through the first six months of the year. This is a slowdown compared to the blistering pace in 2021 and 2022, but well above the pace of job growth for years prior to 2020.2
Along with the downward revisions to, and slowdown in, nonfarm payroll employment growth, the unemployment rate increased to 3.8%—but that’s largely attributed to the increase in the labor force participation rate. Job openings have also fallen to the lowest level since early 2021, per the BLS. Despite this decrease, the ratio of job openings to unemployed workers remains high at 1.5.
On the inflation front, signals have been mixed. Inflation has decelerated significantly from last year, but some indicators of inflation remain high. Core inflation, excluding food and energy, ticked up by 0.2% as measured by the U.S. Bureau of Economic Analysis’ price index for personal consumption expenditures (PCE). Year-over-year core PCE price inflation was 4.2%. The price of goods fell month-over-month in July by 0.3% (0.5% year-over-year). The price for services, however, increased from June, with 0.4% month-over-month increase in July and a 5.2% increase from a year earlier. Services excluding energy and housing, the “super core” measure that the Federal Reserve has been tracking, rose again in July to 0.5% month-over-month and was up 4.7% year-over-year.
Recent developments in the U.S. housing market
Housing continues to reel under the impact of high mortgage rates. Total home sales for July were down 1.2% over the month and 11.8% over the year. Existing home sales continue to decrease, down 2.2% in July and down 16.6% as compared to July 2022, according to the National Association of Realtors. The median selling price for existing homes in July was approximately $407,000, a 1.9% increase from a year ago.
On the other hand, new home sales rose over the month with 714,000 homes sold (seasonally adjusted annual rate), according to U.S. Census Bureau and Department of Housing and Urban Development. New home sales were up 4.4% in July compared to June and were up 31.5% as compared to July 2022. Sales of new homes now account for a larger than normal percentage of total home sales at around 15%, four percentage points higher than the historical average. The inventory of existing homes for sale stands at 1.1 million units, an increase of 3.7% month-over-month. But, this is a decrease of around 15% from last July and represents a supply of just 3.3 months at the current pace of sales. While existing homeowners continue to remain locked into their low mortgage rates, homebuyers are turning to the new homes market and exerting upward pressure on prices. As a result, the median sale price of new homes was up 4.8% over the month of July to just under $437,000. The inventory of new homes is at 437,000 units, a 2.1% increase from June 2023 but a 4.8% decrease from last July. At the current sales rate, the inventory of new homes represents a supply of 7.3 months.
The NAHB / Wells Fargo Housing Market Index for builders’ confidence decreased six points to 50 in August, falling after seven months of consecutive increases.3 This decline can be attributed to mortgage rates surpassing the 7% mark, decreasing future sales expectations and buyer traffic. Despite this decrease in confidence, total housing starts as measured by the U.S. Census Bureau were up 3.9% in July from June and were up 5.9% over the year. The pending homes sales index, as published by the National Association of Realtors, which gives a forward-looking view of home sales, increased 0.9% in July indicating that home sales in the coming months will slightly increase. Compared to July 2022, the index is down 14%, showing that the number of contracts was lower than the previous year.
House prices continue to remain firm despite higher interest rates. While rising interest rates have reduced affordability—and therefore demand—they have also reduced supply through the mortgage rate lock-in effect. Overall, it appears the reduction in supply has outweighed the decrease in demand, thus house prices have started to increase even as sales have fallen. House prices, as measured by the Federal Housing Finance Agency House Price Index were up 0.3% in June as compared to May and were up 3.1% over the year as of June.
Recent developments in the U.S. mortgage market
The balance of economic news has favored the “higher for longer” narrative around interest rates and led to higher Treasury yields and mortgage rates. The U.S. average 30-year fixed mortgage rate as measured by Freddie Mac’s Primary Mortgage Market Survey® increased in August, reaching a high of 7.23%, a level not seen since June 2001. Higher rates have reduced mortgage demand. According to the Mortgage Bankers Association’s Weekly Applications Survey, both the total mortgage application index and the purchase index were down 27% over the year during the third week of August, while the refinance index was down 28%.
According to the New York Fed Consumer Credit Panel, total household debt rose by $16 billion to reach $17.06 trillion in the second quarter of 2023, led by credit card debt, which increased by $45 billion to a historical high of $1.03 trillion. In terms of delinquency rates, for credit card debt, the share of balances transitioning into 30 or more days delinquent increased to 7.2%, which is the highest since the first quarter of 2012. Auto debt transitioning into 30 or more days delinquency increased to 7.3%, which is at levels not seen since the first quarter of 2018. However, in terms of the serious delinquencies, these rates continue to decline over the quarter with 8% of credit card debt and 3.8% of auto debt transitioning into 90+ days delinquent. Mortgages that are seriously delinquent remained low at 0.46%.
The outlook
The macroeconomic outlook hinges on the balance between reducing inflation and slower economic growth. So far, the economic growth outlook has exceeded expectations, while inflation appears to be cooling. The prospects of a soft landing, where the economy gradually slows but avoids recession and inflation settles back in around the long-run policy goal of 2%, appear much better than earlier this year. However, caution is still warranted as soft landings have been rare historically and the effects of interest rate increases are widely seen to operate with “long and variable lags.”4
Economy
Our view on the economy is that it will continue its current trajectory, with growth slowing, the labor market cooling, inflation gradually falling and interest rates remaining high. Consumer spending plays an outsized role in the U.S. economy with almost 70% of the GDP coming from household spending. Consumer spending likely will continue to slow as households exhaust their pandemic-related excess savings and start to feel the bite of higher interest rates on credit cards and other variable rate debt. Fortunately, however, most homeowners have locked in a low interest rate via a fixed-rate mortgage, thus are not as sensitive to interest rates as they might have been in past.
Weak home sales will also play a role in overall economic growth. People who buy homes are not just spending money on the house, but also on alterations, furnishing, household items, etc., all of which contribute to economic growth. Because of these headwinds, we expect the economy to slow down through the rest of the year.
Housing market
We expect mortgage rates to remain above 6% for the rest of the year which will keep sales volume low. While there is still demand in the housing market from a large cohort of Millennial first-time homebuyers, the shortage of housing will keep sales volume muted through this year. As more new homes hit the market and the mortgage rate lock-in effect wanes, we may see sales pick up next year, but any increases would be modest.
Our forecast for the next twelve months has house prices rising by 0.8% and an additional 0.9% over the following twelve months. We expect home price growth to continue due to a combination of housing supply shortage and demographic-driven demand relative to supply.
Mortgage market
While there has been a rebound in prices, sales volumes are low, which will keep purchase mortgage originations flat through the year. High mortgage rates have negatively impacted refinance volumes, and we expect that to continue as mortgage rates remain high. Together, we expect total mortgage originations to remain flat for the rest of the year.
Footnotes
- For example, in July 2022 49% of respondents to the Wall Street Journal Economic Forecasting Survey predicted that a recession would begin within 1 year.
- Nonfarm payroll employment growth from Jan-Jun averaged 1.16 million from 2010 through 2019.
- The Housing Market Index is a diffusion index normalized so that a value of 50 indicates sentiment balanced between positive and negative. Any value above (below) 50 indicates that on average survey respondents have a positive (negative) sentiment. For more information on the index see https://www.nahb.org/news-and-economics/housing-economics/indices/housing-market-index.
- See this report from the St Louis Federal Reserve for a note on the history of long and variable lags: https://www.stlouisfed.org/publications/regional-economist/2023/may/examining-long-variable-lags-monetary-policy.
Prepared by the Economic & Housing Research group
Sam Khater, Chief Economist
Len Kiefer, Deputy Chief Economist
Ajita Atreya, Macro & Housing Economics Manager
Rama Yanamandra, Macro & Housing Economics Manager
Penka Trentcheva, Macro & Housing Economics Senior
Genaro Villa, Macro & Housing Economics Senior
Lalith Manukonda, Finance Analyst