Economic, Housing and Mortgage Market Outlook – April 2024
In this Issue
- While economic growth has moderated slightly, the labor market remains resilient with the unemployment rate remaining below 4% for the 26th consecutive month, the longest streak since the 1960s.
- Housing demand is on the rebound, but with mortgage rates still averaging 6.8%, many prospective homebuyers continue to be priced out of the market.
Recent developments
U.S. economy: The U.S. economy continued to grow at a seasonally adjusted annual rate (SAAR) of 3.4% in Q4 2023 as per the third and final estimate of the Real Gross Domestic Product (GDP) closing out 2023 at 2.5% SAAR compared to the 2022 annual levels.1 While growth in Q4 2023 softened compared to the 4.9% growth in Q3 2023, it remains above estimates of long-term potential growth. The upward revisions to the third estimate for Q4 2023 predominately reflect an increase in consumption spending, which contributed 2.2 percentage points to overall growth. While government spending increased 4.6% in the third estimate compared to 4.2% in the second estimate for Q4 2023, government spending is moderating compared to the 5.8% increase in Q3 2023.
Private investment increased 0.7% over Q4 compared to the 10.0% increase in Q3. Residential investment remained positive but slowed down from the 6.7% increase in Q3 2023 to 2.8% in Q4 2023. Private Domestic Final Consumption ticked down in Q4 2023 to 3.5% compared to the 3.6% growth rate in Q3 2023. Overall, growth is moderating and is expected to continue to trend downward through 2024.
With the third estimate of Real GDP, the Bureau of Economic Analysis also releases the Gross Domestic Income (GDI) data. Real GDI increased 4.8% in Q4 compared to 1.9% in Q3 2023. The average of GDP and GDI is often considered a supplemental measure of U.S. economic activity, and as per that measure, growth increased 4.1% in Q4 as compared to the 3.4% growth in Q3 2023.
The labor market remained robust with nonfarm payroll employment increasing by 303,000 in March 2024, per the Bureau of Labor Statistics (BLS). Employment for January and February was revised up by a combined 22,000. The unemployment rate inched down from 3.9% in February to 3.8% in March, with decreases in Asian and Hispanic unemployment rate over the month. Unemployment remains below 4% for the 26th consecutive month, the longest streak since the 1960s. Average hourly earnings for all employees on private nonfarm payrolls rose 0.3% month-over-month, and compared to a year ago, average hourly earnings increased 4.1%. Overall, the jobs report is indicative of a resilient labor market signaling the likelihood of continued support for consumption spending and thereby, for economic growth.
Job openings remained steady at around 8.8 million in February 2024, according to the BLS Job Openings and Labor Turnover Survey (JOLTS). The ratio of job openings to unemployed, a metric that the Federal Reserve has been tracking to gauge the strength of the labor market, declined slightly to 1.36 in February from a revised reading of 1.43 in January, indicating fewer job openings per unemployed. While on average there are more job openings than unemployed at the national level, there is substantial variation in this ratio across the states. For example, as of January, the latest available state-level data, California, Arizona, New Jersey, and Washington, had more unemployed than job openings while states such as Maryland and North Dakota had more than three jobs per unemployed person in the state.
Inflation as measured by the price index for Personal Consumption Expenditures (PCE) excluding food and energy came in below consensus expectations, increasing 0.3%. This brought the annual core PCE rate down to 2.8% from 2.9% in February. However, the overall level of inflation remains above the Federal Reserve target of 2.0% with significant upside risks. With inflation remaining above the target, the likelihood of the Federal Reserve cutting the federal fund rates is pushed further out to the second half of the year. Following the March CPI report, market expectations of the federal fund rate cuts also fell significantly.2
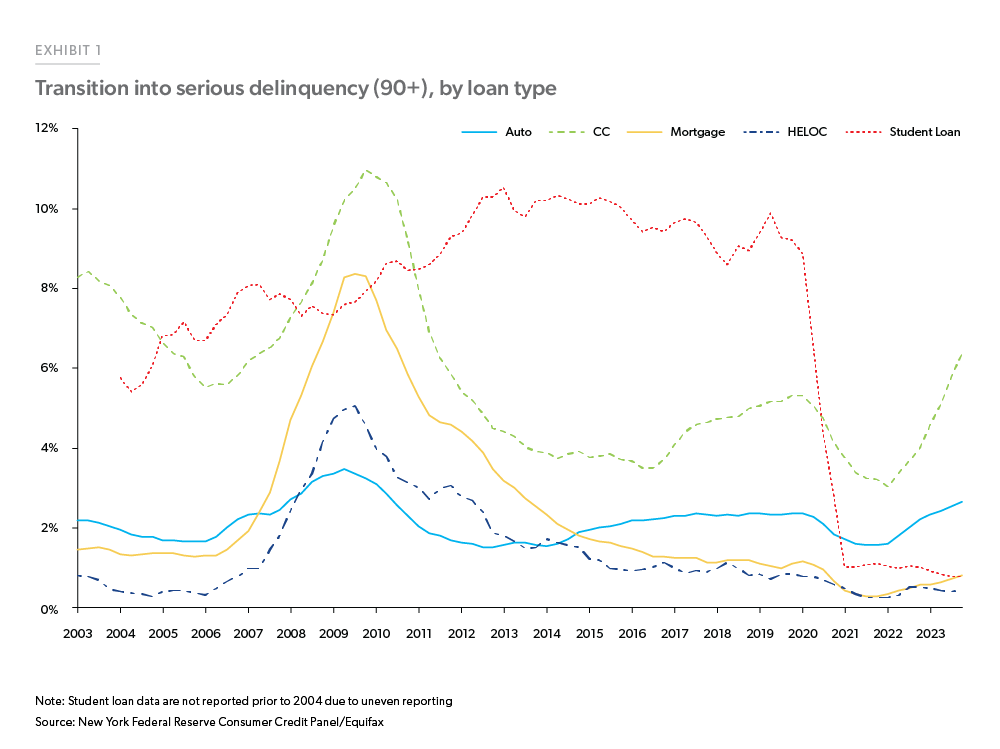
The higher interest rates are impacting consumer credit performance. While serious delinquency rates for credit cards and autos are increasing, mortgage performance has remained better than the other sectors (Exhibit 1). Credit cards have had the highest increase in transitions into serious delinquency, followed by auto loans. As a result of higher for longer rates and sticky inflation, consumers are relying more on credit card debt and consequently, transitions into delinquency are above levels seen prior to the pandemic.
In summary, the U.S. economy has changed little in recent months and remains resilient. Economic growth has moderated but remains robust, the labor market continues to exhibit strength, and inflation remains elevated relative to the Federal Reserve’s long-run target.
U.S. housing and mortgage market: As we enter the spring homebuying season, there is renewed attention on the housing market as this season largely determines how the year will turn out for the housing market. On average, since 1999, around 36% of the total home sales in a year happen between the months of March to June. Warmer weather and the end of the school year prompt many to make the home purchase move during this period as compared to any other time of the year. With affordability at a near 30-year low, heightened mortgage rates, and no March rate cut, what does this mean for the 2024 spring home buying season? We will explore more forward-looking data in the spotlight section below.
Leading up to the spring homebuying season, total (existing + new) home sales for the month of February 2024 moved up by 8.1% from January 2024, but were down 2.2% from a year ago. Existing home sales grew 9.5% from January to 4.38 million in February and accounted for about 87% of total home sales. Despite the month-over-month gains, existing sales are still 3.3% below the levels of February 2023. New home sales for February 2024 were at 662,000, 0.3% below January sales, but 5.9% higher than last February. As the supply of existing homes for sale remains low and home prices continue to rise, more buyers are choosing to purchase new homes than in previous years.
The FHFA Purchase-Only Home Price Index for January ticked down by 0.1% month-over-month compared to an increase of 0.1% in December 2023. However, with housing demand on the rebound, year-over-year, house price growth remained strong at 6.3% for January.
New residential construction bounced back in February with total starts increasing 10.7% in February, the largest monthly increase since May 2023. Single-family housing starts were up 35.2% year-over-year in February with single-family housing permits increasing 29.5% over the same period.3 As demand for new homes continues to increase, builders reap the benefits. According to the National Association of Home Builders’ Housing Market Index, homebuilder confidence continued its upward trend in March with the index coming in at 51. This is the highest reading since July 2023 and is above the threshold of 50, indicating positive building conditions.4
Mortgage rates remained steady in March and averaged 6.8% for the month, as measured by Freddie Mac’s Primary Mortgage Market Survey®. According to the Mortgage Bankers Association (MBA), mortgage activity increased over the month despite these higher rates. Overall mortgage activity was up 3.9% month-over-month but was down by 10.2% year-over-year at the end of March. Refinance activity for March was up 5.9% as compared to February, and purchase applications were up 3.2% month-over-month.
While the overall impact of higher interest rates on mortgages has been lower than on consumer credit, we see a slight uptick in mortgage delinquency rates. Even with this increase, the delinquency rates remain lower than historical averages for most loan types. Total mortgage delinquency rates increased in Q4 2023 to 3.9%, up 26 basis points from Q3 2023. According to the Mortgage Bankers Association (MBA), there has been an uptick in the pace of new mortgage loans entering delinquency coupled with other mortgage loans moving into later stages of delinquency. The delinquency rate on conventional mortgages increased from 2.5% in Q3 2023 to 2.6% in Q4 2023. The delinquency rate on FHA loans increased from 9.5% in Q3 2023 to 10.8% in Q4 2023. The delinquency rate on VA loans had the largest increase, up 31 basis points to a rate of 4.1% in Q4 2023.
Overall, tight inventory is still a key barrier to home sale volumes. Purchase demand is improving, but with mortgage rates still averaging 6.8%, many prospective homebuyers are being priced out of the housing market.
Outlook
Our view on the economy holds steady as we step into Q2 2024. We expect the U.S. economy to realize a slow growth this year. Households accumulated a considerable amount of pandemic-related excess savings which helped them withstand the high inflationary environment of the last couple of years. While we expect inflation to moderate eventually, substantial savings are already drawn down, which could lead to a softening of the spending momentum, slowing the economy and the labor market. While a lot of headway towards the 2% inflation target has been made, the Federal Reserve is in a “wait and see” mode before they start cutting the federal fund rates. We therefore expect mortgage rates to remain elevated for longer.
Under our baseline scenario, our housing outlook, particularly for home sales, remains subdued. While housing demand is solid due to a large share of Millennial first-time homebuyers looking to buy homes, they are challenged by high mortgage rates and a lack of homes available for sale. We expect these challenges to persist in 2024 mainly in the absence of significant rate cuts, which will keep the rate-lock effect in place and keep total home sales volume below five million in 2024. Due to solid housing demand but lean inventory, we expect upward home price pressure and forecast home prices to increase 0.5% in 2024 and in 2025.
In the mortgage market, we expect to see some increase in dollar volumes of mortgage origination in 2024 largely driven by higher home prices. However, subdued home sales will limit the purchase origination dollar volumes. Additionally, a high share of cash purchases will also impede purchase origination volumes. On the refinance side, unless the mortgage rates drop significantly and unlock rate-locked homeowners, refinance volumes will remain low. Since we do not expect mortgage rates to fall significantly this year, refinance activity will remain constrained, keeping total originations low for 2024.
Overall, our outlook remains positive. However, as inflation remains a fundamental piece in halting the Federal Reserve’s rate cuts, risks are weighted to the downside. Consumers have started to feel the brunt of high rates as indicated by deteriorating credit performance, particularly in auto and credit card segments. In the absence of rate cuts, the weakening in non-mortgage performance will continue and might spill over to mortgage performance. However, under our baseline, we do not expect this scenario to occur.
See the April 2024 spotlight on the spring homebuying season “The 2024 Spring Homebuying Season: An Early Preview Using Mortgage Application Data.”
Footnotes
- Bureau of Economic Analysis (BEA)
- CME FedWatch Tool - CME Group: https://www.cmegroup.com/markets/interest-rates/cme-fedwatch-tool.html
- https://www.census.gov/
- https://www.nahb.org/
Prepared by the Economic & Housing Research group
Sam Khater, Chief Economist
Len Kiefer, Deputy Chief Economist
Ajita Atreya, Macro & Housing Economics Manager
Rama Yanamandra, Macro & Housing Economics Manager
Penka Trentcheva, Macro & Housing Economics Senior
Genaro Villa, Macro & Housing Economics Senior
Jessica Donadio, Finance Analyst