Granny Flats, Garage Apartments, In-Law Suites: Identifying Accessory Dwelling Units from Real Estate Listing Descriptions Using Text Mining
As the nation’s affordable housing crisis intensifies, there is a growing movement in high-cost areas for the legalization and expansion of accessory dwelling units (ADUs)—also referred to as granny flats, garage apartments, and in-law suites. The concept of ADUs infilling housing in established neighborhoods is not new. ADUs, such as Fonzie’s above-garage apartment in the 1974 to 1984 television sitcom Happy Days, and Jesse and Rebecca’s attic conversion in the 1987 to 1995 television sitcom Full House, have been making appearances in pop culture television shows for decades.
The rise of accessory dwelling units
Since the 1950s, as a result of exclusionary zoning laws passed during the postwar rise of suburbs, construction of higher-density residential structures has been banned by many communities across the country (Quigley and Rosenthal 2015). Given the historical prevalence of ADUs built against city ordinances, without required permits, little research literature was published on them in the 1980s and 1990s (Wegmann and Nemirow 2011). Since then, a small number of survey reports have been released, focusing on the responses of ADU homeowners in a handful of jurisdictions (Wegmann and Chapple 2012). An article was also published in 2012 examining data on 50 candidate properties featuring ADUs in Portland, Oregon (Brown and Watkins 2012); it described a data collection method much like the methods that will be discussed in this paper. To the best of the author’s knowledge, these are the only studies using data collected on both permitted and illegal units in the United States.
The previous studies on ADUs were all small in scale and based mainly on limited data. In this Insight, we address the gaps in data by leveraging property descriptions posted by real estate agents on Multiple Listing Service (MLS) boards. We also present an analysis of the fastest growing areas for ADUs nationwide over the last decade, examine various structural types of ADUs in use (both permitted and illegal), and discuss the measurable benefits of having ADUs in our communities.
Methodology
The biggest challenge of collecting ADU data from MLS unstructured text was understanding the multitude of terminology and physical forms applicable to ADUs in different locales. ADUs are broadly defined as secondary, self-contained housing units located on the same lots as the primary single-family home. Size and structural form vary, but in most cases, ADUs include the following amenities: a bathroom, kitchenette, living area, and separate entrance (Brown and Watkins 2012). Exhibit 1 displays a pictogram of the many terms that appear in MLS listings, and the frequency they are used.
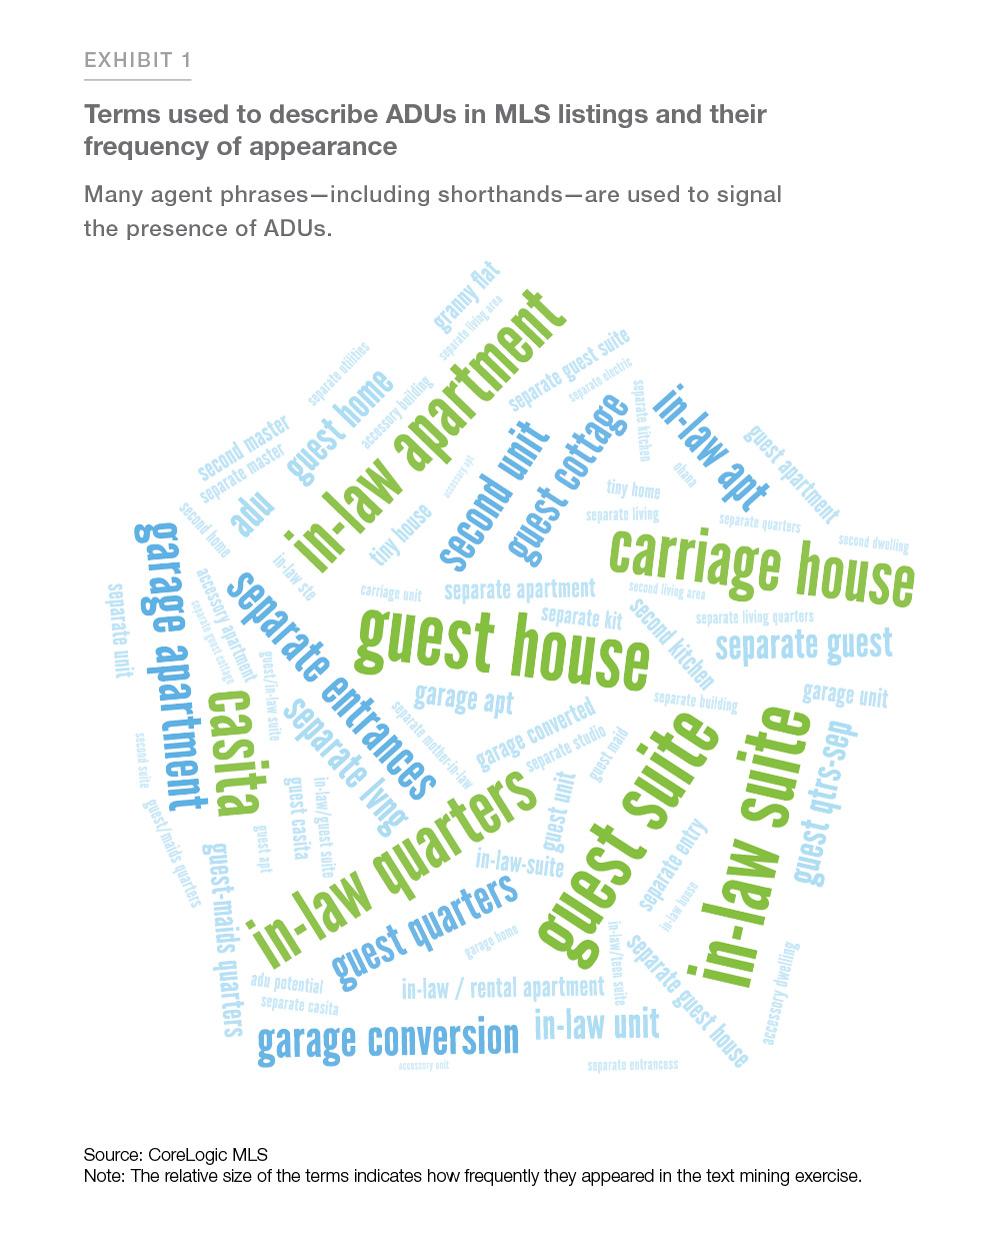
Employing a national-level dataset of 600 million MLS transactions dating back to the late 1990s, information on ADU listings was extracted from unstructured description text.1 In order to do this, we first had to discover and compile a list of the most common agent phrases—including shorthands—used to describe ADUs. This important step was carried out through the process of text mining, parsing sentences into different parts of speech, creating word frequency distributions, and matching patterns and key-phrases. A total of 1.4 million distinct single-family properties with accessory dwellings were identified in our final population.
A different way to measure ADU production
Analysis of past and current ADU development trends can help researchers better understand ADU’s role in the broader discussions taking place of ways to tackle the country’s inadequate housing supply. Prior studies on the number of newly built ADUs have typically relied on building permits data collected from local city permit offices. Conclusions on these results should be read with caution because the data is a recording of permits issued, not actual completions. Another downside regarding permits data is that illegal units—also called “shadow housing”—will not be represented in the data. Most studies seem to agree on the prevalence of unpermitted ADUs in neighborhoods that lack affordable housing. For example, a 2009 field survey of three neighborhoods in Los Angeles with high numbers of foreclosures revealed that 34% to 80% of single-family housing units in these areas were likely to have illegal ADUs (Cuff, Higgins, and Dahl 2010). In 2011, researchers surveyed homeowners in the San Francisco Bay Area and found that more than 90% of secondary units lacked required building permits (Chapple and others 2012).
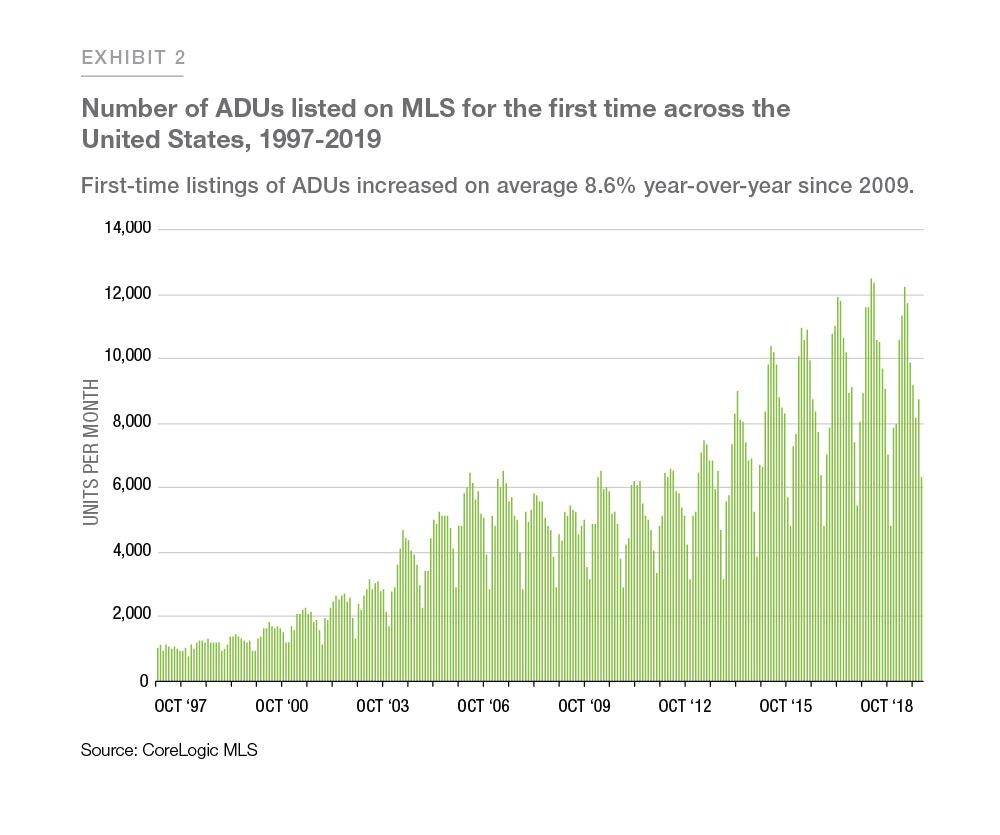
To shed more light on the completion numbers of permitted and unpermitted units, we propose a supplemental measurement for ADU production, using historical MLS data.2 By analyzing the flow rate of properties with listings mentioning ADUs for the first time—removing subsequent listings on properties already observed—we estimated the levels of change in new accessory units entering the market. The data shows an impressive national growth rate for ADUs (Exhibit 2). Between 2009 and 2019, the number of first-time listings of ADUs grew on average 8.6% year-over-year.
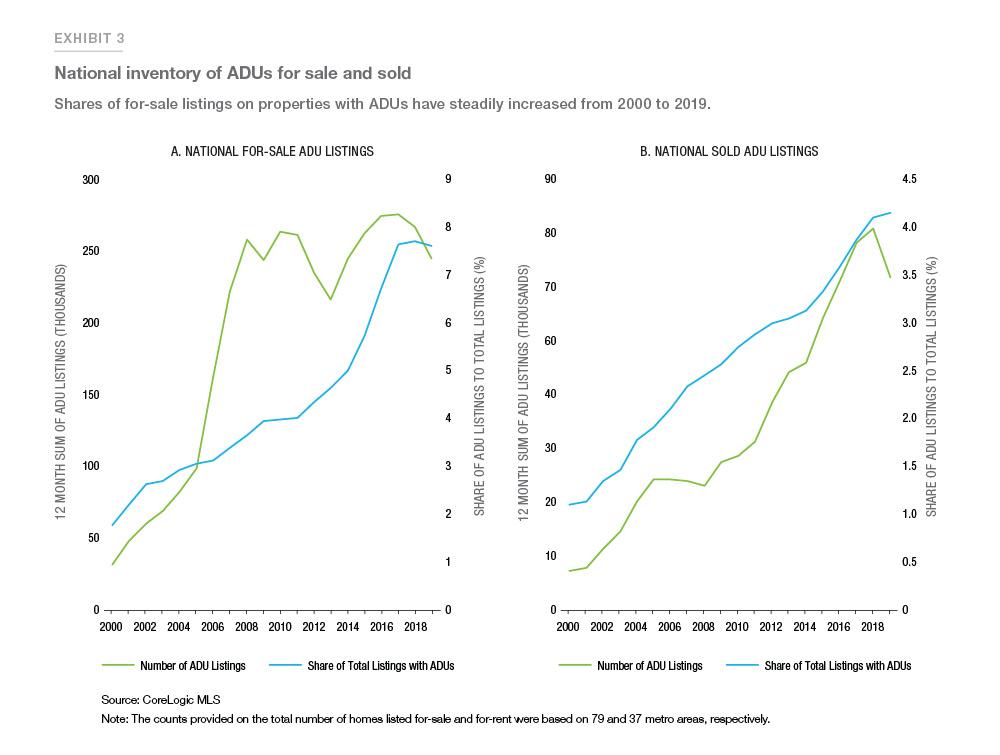
We also find additional evidence supporting a rise in the supply and demand of ADUs by examining changes in their percentages of total homes active and closed. In 2000, 1.6% of active for-sale listings had ADUs. By 2019, the share of active for-sale listings with ADUs had grown to 6.8% (Exhibit 3a). In terms of numbers sold, less than 9 thousand or 1.1% of homes sold on MLS in 2000 had ADUs. By 2019, sales of homes with ADUs grew to nearly 70 thousand or 4.2% of homes sold on MLS (Exhibit 3b).
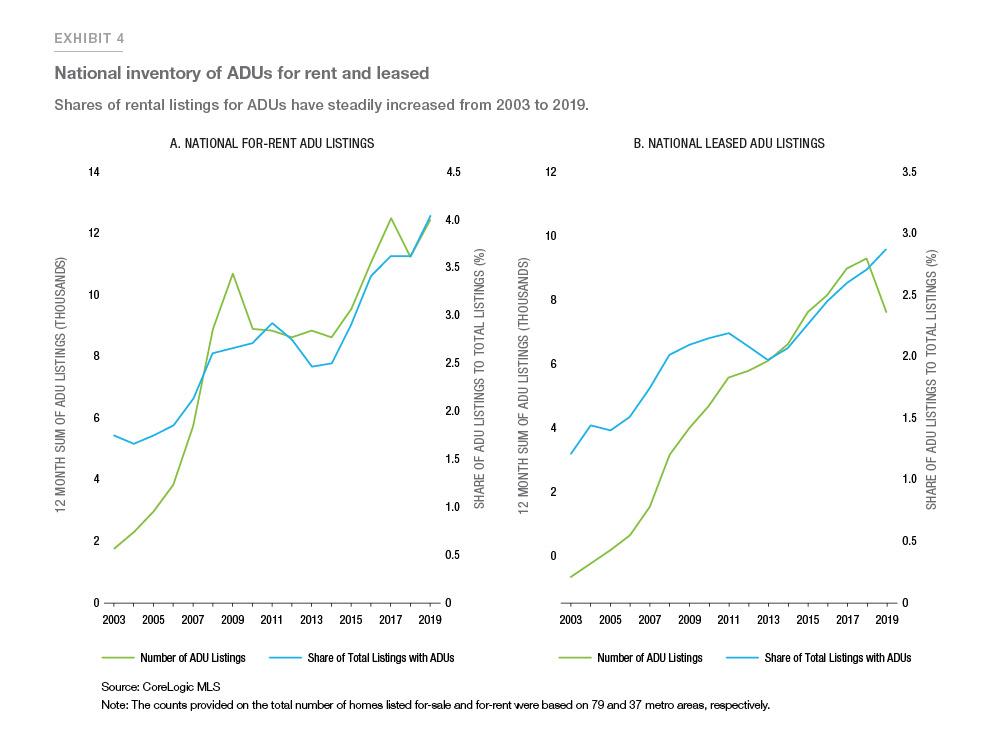
From 2003 to 2019, the percentage of rental ADUs also increased; the number of active rental listings increased from 1.8% to 4.1% (Exhibit 4a) and the number of leased rental listings increased from 1.2% to 2.9% (Exhibit 4b).
Under these methods, a few sources of errors must be considered. After construction is completed, ADU homeowners have the following options: rent out the unit, sell the entire property with the ADU, or hold on to the unit. Understatement bias will occur in the following events: owners hold on to their units; rental or sale transactions occur outside of MLS—includes pocket listings, for-sale-by-owner, online rental sites, and/or referrals; or listing descriptions do not match ADU key-phrases.
Overstatement bias will occur when existing, older units are listed for the first time on MLS. Despite these concerns, our observed multiyear expansion trend is backed by building permits data across numerous ADU-reformed cities (Chapple and others 2017).
ADU growth by region
The scarcity of affordable housing in high-cost areas of the country has resulted in the passing of ordinances aimed at reducing restrictive zoning in some jurisdictions. These cities have adopted ADU-friendly legislation, making units legal in many neighborhoods.
We have provided evidence of a growing national market for ADUs. We turn now to a more in-depth look at what parts of the nation have responded most to their needs of affordable housing through ADU development.
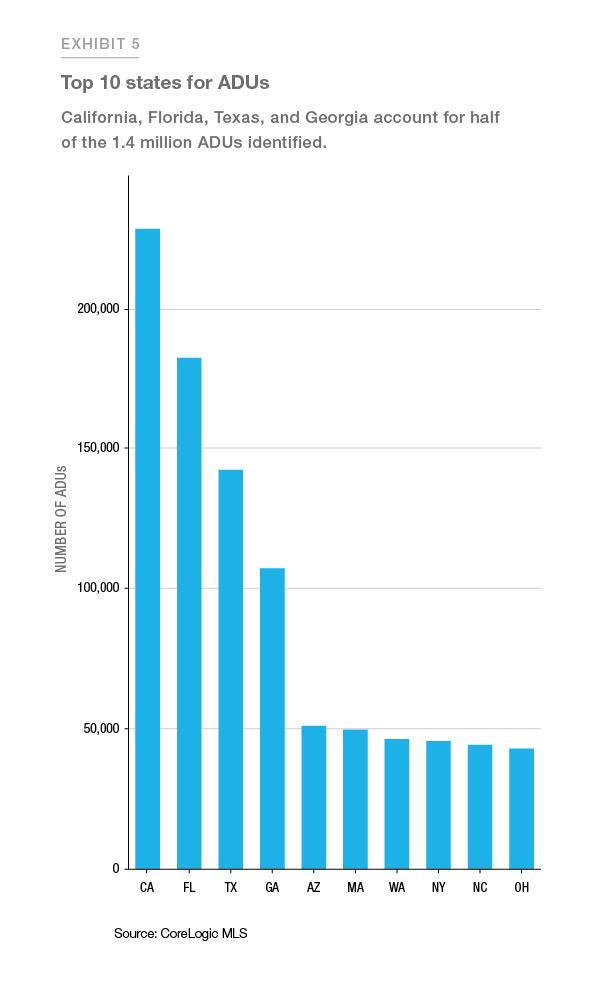
The data collected supports the finding that the demand for accessory dwellings is highest in the fastest growing regions of the country. Population growth, in terms of both absolute numbers and percent, has been overwhelmingly higher in two regions: the South (11 million net increase; 9.6% growth) and the West (6.4 million net increase; 8.9% growth) regions, according to 2010 through 2019 population estimates reported by the U.S. Census Bureau.3 Correspondingly, half of our total 1.4 million ADUs are located in the Sun Belt states of California, Florida, Texas, and Georgia (Exhibit 5).
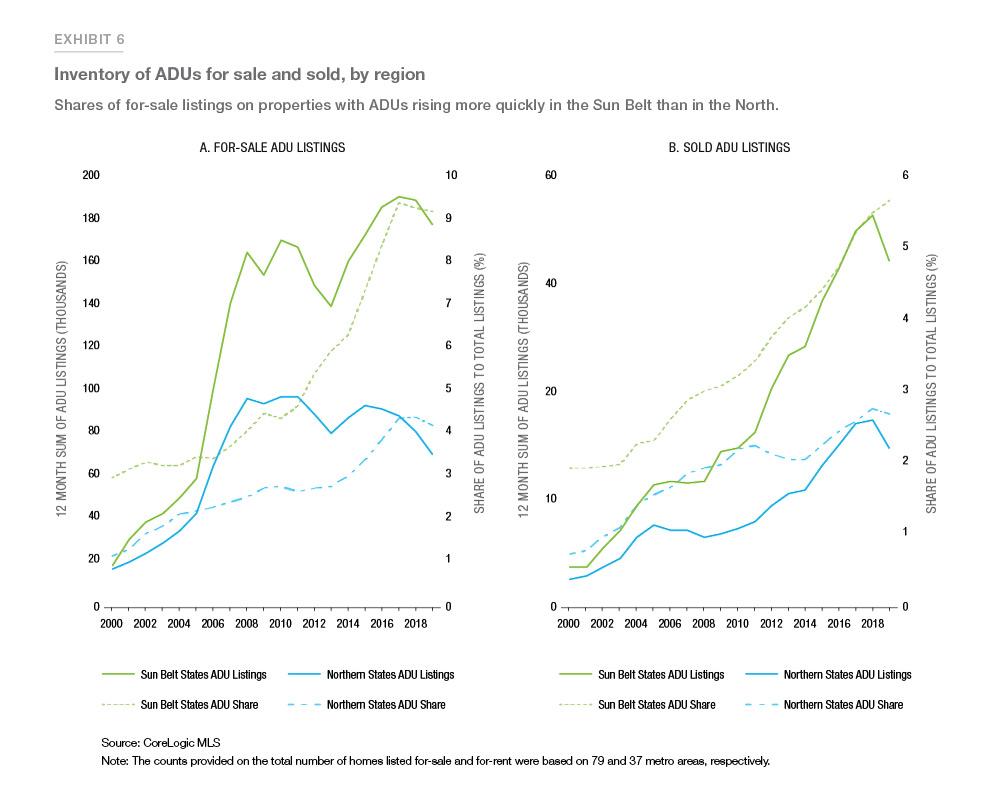
The number of for-sale listings that mention ADUs has also risen more rapidly in the Sun Belt than in the North. Shares of active listings for homes with ADUs in Sun Belt states rose from 4.3% in 2010 to 9.2% in 2019, while shares in Northern states rose from 2.7% to 4.1% (Exhibit 6a). Similarly, shares of sold listings for homes with ADUs in Sun Belt states rose from 3.2% in 2010 to 5.6% in 2019, while shares in Northern states rose from 2.2% to 2.6% (Exhibit 6b).
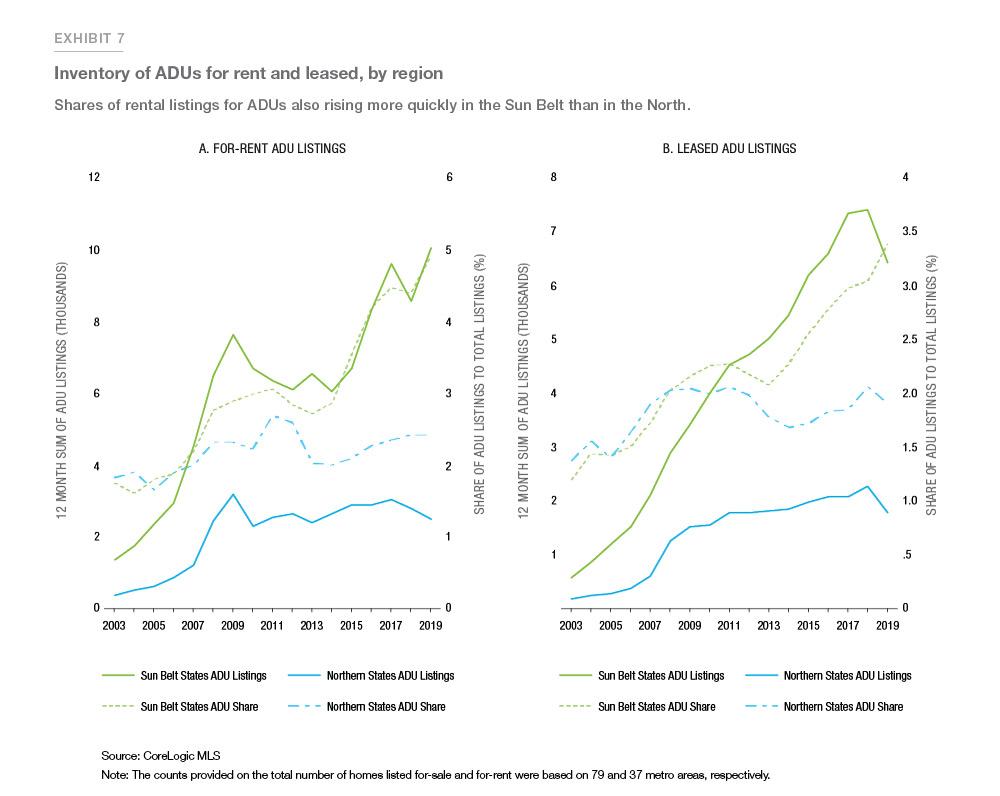
The same trend is also observed in rental listings. Shares of active rental listings for ADUs in Sun Belt states rose from 3.0% in 2010 to 4.9% in 2019, while shares in Northern states rose from 2.2% to 2.4% (Exhibit 7a). Similarly, shares of leased rental listings for ADUs in Sun Belt states rose from 2.3% in 2010 to 3.4% in 2019, while shares in Northern states dropped from 2.0% to 1.9% (Exhibit 7b).
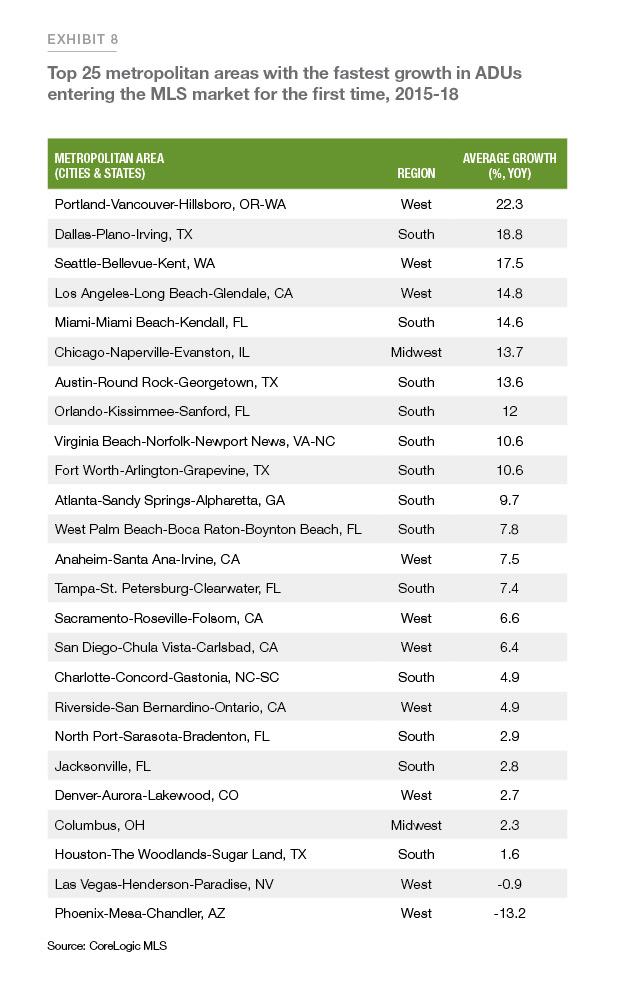
Drilling down to metropolitan-level detail, we found that 23 of the top 25 metro areas with the highest number of first-time ADU listings, occurring between 2015 and 2018, are located in the South and West regions. Portland, Dallas, and Seattle metro areas rank highest in terms of year-over-year growth (Exhibit 8).
Design variations in ADU housing stock
In addition to measuring growth, we examined how ADUs are produced in different regions across the country. ADUs can be attached or detached, depending on their location relative to the primary residence. Attached ADUs are either carved out of interior spaces or connected to the main structure—think of basement conversions or granny flats above an attached garage. Detached ADUs, such as guest cottages, garden suites, and carriage houses, are built free-standing from the main structure and are typically located in the backyard or over a detached carport.
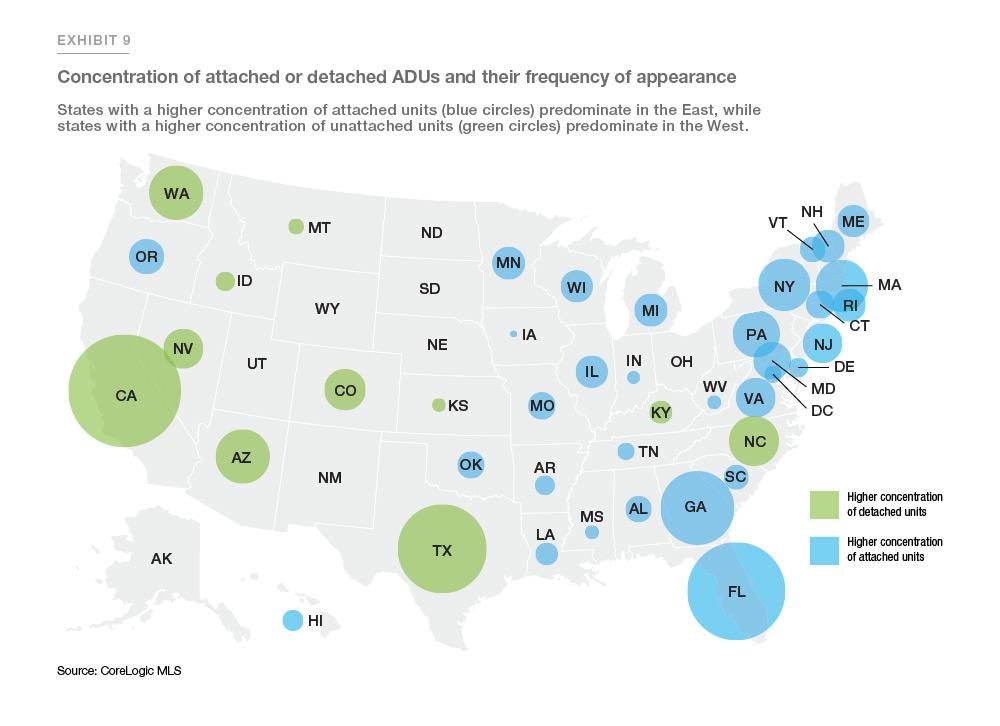
Using geographic data from our identified population of 1.4 million ADUs, we plotted each point onto a map to display the spatial distribution of accessory dwellings in the United States.4 Next, we aggregated counts by state and compared the percentages between detached and attached ADUs. In Exhibit 9, states with green-shaded circles have higher shares of detached ADUs, while states with blue-shaded circles have higher shares of attached ADUs. The highest concentrations of accessory dwellings, as noted by the size of the circles on the map, are located mainly in coastal regions, where most of U.S. households reside. As expected, detached ADU housing stock occurs more prevalently in sprawling western cities, characterized by large, low-density lots and plenty of open space A source of error in our estimates of accessory housing stock is we do not account for the demolition or permanent loss of older units(Quigley and Rosenthal 2015). Homeowners living in older, denser industrial cities along the East Coast, by contrast, are more land-constrained. Instead of building ADUs in big backyards, additional living spaces are more often created through conversion of existing ancillary spaces, such as basements, attics, or garages.
Alternative, affordable housing supply
Opponents of ADU development question whether these dwellings mainly serve as extra living spaces, offices, or sources of short-term rental income for the owners, rather than providing long-term housing for additional families. The 2013 survey of permitted ADU owners in Portland conducted by the Oregon Department of Environmental Quality (DEQ) indicates that nearly 80% of ADUs are used as long-term residences (Brown and Palmeri 2014). Construction costs to build an ADU are also significantly cheaper than that of traditional single-family housing because no extra land must be purchased. The Portland survey reported the median cost of attached units was $45,500 and the median cost of detached units was $90,000 (Brown and Palmeri 2014). We calculated Portland’s median home price at $290,000, using MLS sold listings in 2013.5 The calculations indicate that at less than one-third of the price of traditional primary residences, ADUs are an affordable alternative for families wishing to provide independent living spaces close by for their family members who are elderly, young adults, or single.
To test whether the high occurrence of long-term residential use in Portland holds true for other locales, we examined repeat rental listings from our ADU dataset on properties listed more than once. Between 2015 and 2018, approximately 40 thousand pairs of transactions were identified, with three quarters of the sample located in Texas, California, Florida, Georgia, and Arizona. The median number of days between paired listings in these 5 states ranged from 262 days to 371 days, and shares of short-term rentals—defined as properties reposted in less than 30 days—ranged from 7% to 15%. An apparent limitation of this approach is these estimates do not account for properties that are solely posted on short-term rental sites. Nonetheless, the results support the view that ADUs are helping to fill the gaps in long-term affordable rentals.
Conclusion
Unlike previously published reports on ADUs using homeowner surveys and building permit data, this paper addresses both legal and illegal units across the United States. By efficiently text-mining listing data, we identified 1.4 million unique properties with ADUs. While accessory dwellings have existed in high-cost areas of the country long before cities began to relax zoning laws, our research shows first-time ADU listings increased more rapidly from 2009 to 2019, growing at an average annual rate of 8.6%. Over this ten-year period, ADU listings as a percentage of total active listings rose from 3.5% to 6.6%. In 2019, 78,000 accessory units were either sold or rented, up from 36,000 units in 2009.6 The South and West regions, where population growth has been strongest, outpaced other regions in terms of ADU expansion over the last decade. By turning qualitative description data into quantitative measures, researchers can better understand the characteristics of ADU markets across the country.
References
Brown, Martin John, and Jordan Palmeri. 2014. Accessory Dwelling Units in Portland, Oregon: Evaluation and Interpretation of a Survey of ADU Owners. Portland, OR: Department of Environmental Quality, June.
Brown, Martin John, and Taylor Watkins. 2012. “Understanding and Appraising Properties with Accessory Dwelling Units.” The Appraisal Journal (Fall): 297–309.
Chapple, Karen, Jake Wegmann, Alison Nemirow, and Colin Dentel-Post. 2012. Yes in My Backyard: Mobilizing the Market for Secondary Units. Berkeley, CA: Center for Community Innovation, University of California, June.
Chapple, Karen, Jake Wegmann, Farzad Mashhood, and Rebecca Coleman. 2017. Jumpstarting the Market for Accessory Dwelling Units: Lessons Learned from Portland, Seattle, and Vancouver. Berkeley, CA: Terner Center for Housing Innovation, University of California, Berkeley.
Cuff, Dana, Tim Higgins, and Per-Johan Dahl, editors. 2010. Backyard Homes LA. Los Angeles, CA: cityLAB, UCLA Department of Design + Urban Architecture.
Quigley, John M., and Larry A. Rosenthal. 2015. “The Effects of Land Use Regulation on the Price of Housing.” Cityscape: A Journal of Policy Development and Research 8 (1): 69–137.
Wegmann, Jake, and Karen Chapple. 2012. “Understanding the Market for Secondary Units in the East Bay.” Working Paper 2012-03, Institute of Urban and Regional Development, University of California, Berkeley, October.
Wegmann, Jake, and Alison Nemirow. 2011. “Secondary Units and Urban Infill: A Literature Review.” Working Paper 2011-02, Institute of Urban and Regional Development, University of California, Berkeley, February.
Footnotes
- The MLS-licensed dataset was acquired from CoreLogic, Inc.
- The MLS dataset includes both for-sale and for-rent listings.
- U.S. Census Bureau, “Annual Estimates of the Resident Population for the United States, Regions,
States, and Puerto Rico: April 1, 2010 to July 1, 2019 (NST-EST2019-alldata),” accessed January 2020,
https://www2.census.gov/programs-surveys/popest/tables/2010-2019/state/totals/nst-est2019-01.xlsx. xls - A source of error in our estimates of accessory housing stock is we do not account for the demolition or permanent loss of older units
- The calculation of median sale price excluded listings on properties identified with ADUs.
- The counts provided on the total number of homes listed for-sale and for-rent were based on 79 and 37 metro areas, respectively.
PREPARED BY THE ECONOMIC & HOUSING RESEARCH GROUP
Sam Khater, Chief Economist
Kristine Yao, Macro Housing Economics Director