Unravelling Perceptions of Flood Risk: Examining Changes in Home Prices in Harris County, Texas in the Aftermath of Hurricane Harvey
If you want to buy a home, is living near the water on your wish list? If so, how much do you worry about flooding?
When searching for a home, it is very common to have a wish list and a home near water is a dream for many. But everyone dreads floods impacting their yard and/or house and in recent years, floods have become more frequent (Mallakpour and Villarini 2015).
Prospective homebuyers decide about whether to buy a property in an area at risk for flooding based on how they perceive the risk. Therefore, knowledge about the location of a property in a floodplain and a flooding event should influence the price that an individual is willing to pay for a house in a risky area.
The objective risk of flooding is determined in the United States by the Federal Emergency Management Agency (FEMA), which ascertains whether a property is in a floodplain. In a 100-year floodplain, there is 1% chance each year that the property will be flooded. Over the 30-year life of a typical mortgage, this translates into a 26% chance of flooding.1 Homeowners with a mortgage in a 100-year floodplain—or a special flood hazard area (SFHA)2—are required to buy flood insurance and maintain it throughout the life of their loan.
A number of studies indicate that properties in a floodplain sell for less after a flood due to heightened perceptions of flood risk (Bin and Polasky 2004; Kousky 2010; Atreya, Ferreira, and Kriesel 2013).
In coastal areas, however, the riskiest properties are also the most desirable due to their amenity value and therefore command a price premium. That price premium decreases after a flooding event (Atreya and Czajkowski 2016). But there are also cases where individuals underestimate flood risk.
This is a major problem and a challenge to manage (Lecheowska 2018). Therefore, it is important to study individual floods and their impact on local markets.
In this Research Note, we examine whether individuals in Harris County, Texas and the City of Houston in Harris County had prior knowledge about flood risk and how their perception of flood risk changed after Hurricane Harvey flooded the area. We also examined how that changed perspective impacted home prices. To do so, we look at knowledge and perceptions as reflected in changes in property prices.
Hurricane Harvey: A lookback
In August/September 2017, three major hurricanes hit the Gulf of Mexico in rapid succession. Hurricanes Harvey, Irma, and Maria wrought widespread damage in Texas, Florida, and Georgia and leveled parts of Puerto Rico as well as other islands within the Caribbean. Hurricane Harvey stalled over the Gulf Coast of Texas, depositing as much as 50 inches of rain on the city of Houston in Harris County as well as its surrounding areas over several days. Moody's Analytics estimated the total economic loss from Harvey was $81.5 billion (in 2017 dollars).3 FEMA paid out almost 50,000 claims in Harris County following Hurricane Harvey.4
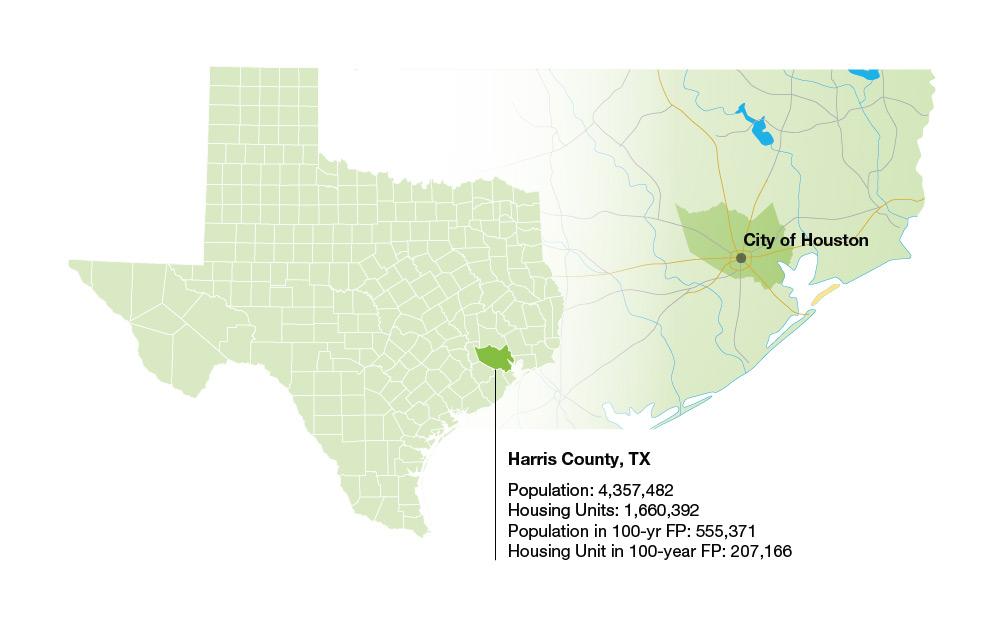
Approximately 26% of the housing units in Harris County lie in a floodplain (either a 100-year or 500-year floodplain) of which about 12% of the housing units lie in the 100-year floodplain, according to New York University’s Furman Center for Real Estate & Urban Policy.5
Harris County property sales data
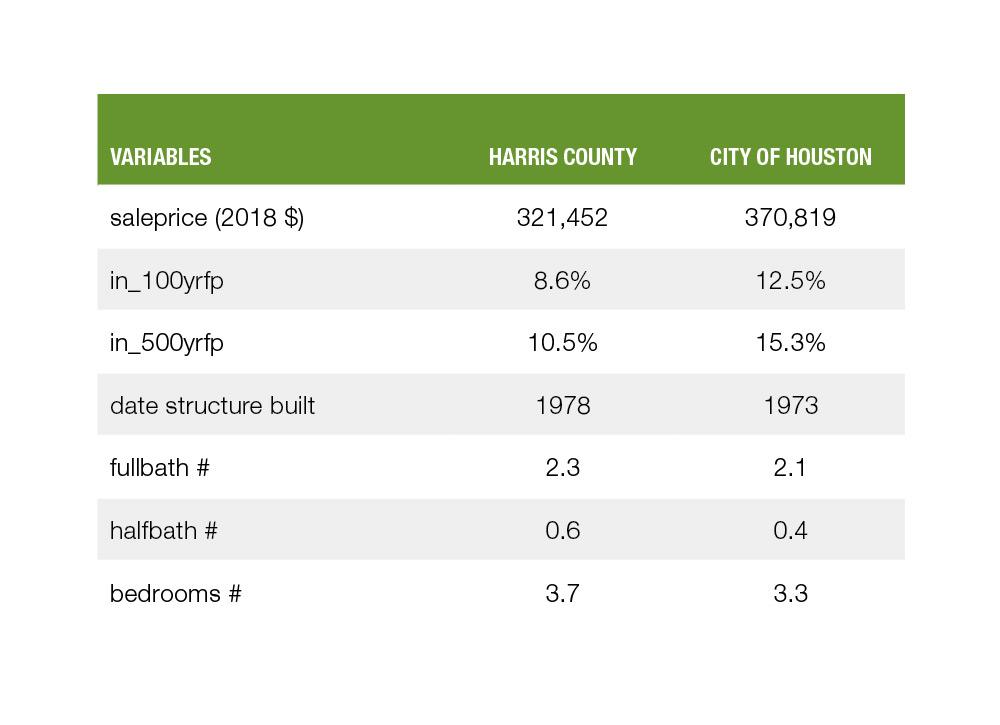
To determine the impact of Hurricane Harvey on home prices in Harris County, we used several data sources. First, we used single-family property transaction data from CoreLogic for properties sold between 2016 and 2018. During this study period, homes in Harris County sold for an average of $321,000, while in the City of Houston, homes sold for an average of $370,000. We compared the sale transaction data with the flood maps produced by FEMA. In Harris County, 8.6% of the homes sold during the study period lie in the 100-year floodplain, while the percentage climbs to 12.5% in the City of Houston. Most of these homes were built in the 1970s, and have an average of 4 bedroom, 3 full baths, and 1 half bath.
Second, we used U.S. Census data to determine the school districts and distance to highways and to lakes and rivers (Lake Houston, Galveston Bay, and San Jacinto River) for each home sold during that period.
Texas has several superfund sites that are highly contaminated locations requiring longer-term remedial investigation and remedial action. Previous studies (Kiel and Williams 2007; Reichert 1997) have shown that location near a superfund site has a significant negative impact on home prices.Therefore, we also determined the distance of each property to the nearest superfund site using superfund site data from the U.S. Geological Survey to control for the confounding impacts of superfund sites.6
How did Hurricane Harvey affect home prices in Harris County?
Homes in a floodplain sell for less even before a flood, and the reduction in the sales price was greater after Hurricane Harvey
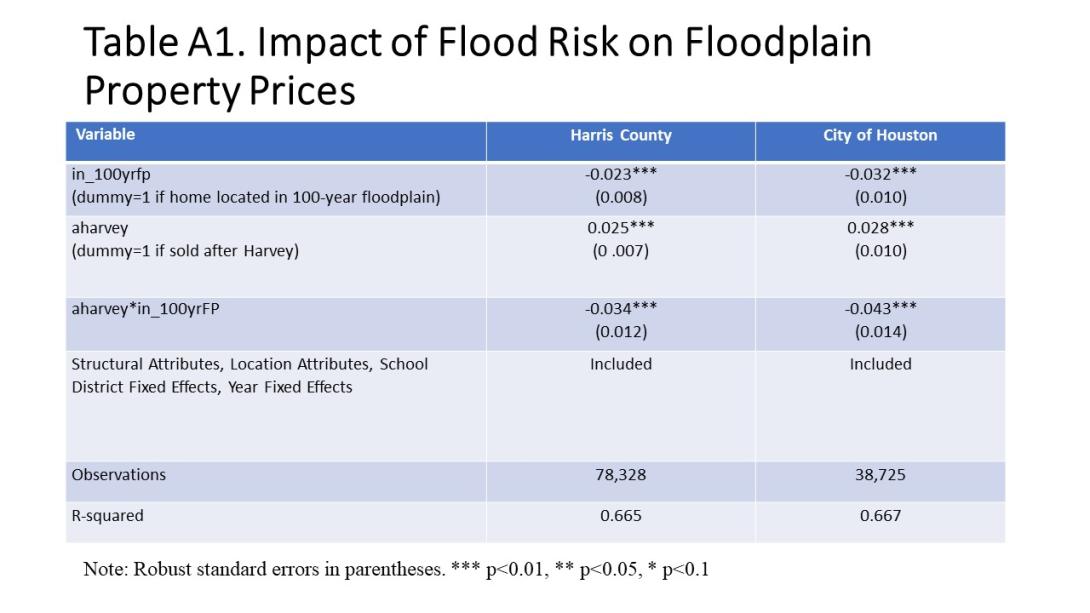
To determine how home prices were affected by Hurricane Harvey, we employ a hedonic model in a difference-in-difference framework (see the Appendix for details). All else equal, we find that homes in the 100-year floodplain sold for 2.3% less in Harris County even before Hurricane Harvey. This discount is equivalent to $7,309 for an average priced home in Harris County. This decrease can be attributed to an “information effect,” which indicates that people in Harris County were aware of flood risk and therefore discounted the prices of homes in the floodplain.7

Texas has strict real estate disclosure laws regarding flood risk (Hino & Burke 2020), and therefore, information about flood risk is readily available to homebuyers.8 Our estimate is consistent with Hino & Burke 2020 findings that in strict real estate disclosure law states, the estimated flood zone discount ranges from -0.7% to -7.3%.
Overall, home prices increased in Harris County by 2.5% even after Hurricane Harvey.9 However, as people updated their perception of flood risk, home prices in the 100-year floodplain fell further—selling for 3.1% less than other homes.10 This reduction in price is equivalent to almost $10,125 for an average priced home in Harris County (all else equal). The additional discount for location in the floodplain can be attributed to the impact of a heightened perception of flood risk after Hurricane Harvey.
What happened to prices in heavily impacted areas within Harris County?
Prices fell even more in heavily impacted areas
Not every area in Harris County was equally affected by Hurricane Harvey. For example, the City of Houston was impacted more than other areas. The City of Houston has been hit by hurricanes in the past, so we can expect the residents to be more aware of the flood risk in the city. As expected, we find that prices for homes in the 100-year floodplain were 3.1% lower than prices of similar homes outside of the 100-year floodplain before Hurricane Harvey.
After the hurricane hit, home prices fell even more in the 100-year floodplain in the City of Houston. On average, prices fell by 4.6%, or almost $17,000, for homes in the 100-year floodplain, compared to similar homes outside of the 100-year floodplain.11 Prior studies have shown that home prices return to normal after a few years of decline in the absence of additional flooding.
Conclusion
We find that the prices of homes located in the floodplain were already discounted by 2.3% or $7,300 in Harris County prior to Hurricane Harvey. After the hurricane, the discount rose to 5.5% or $17,800— a $10,500 increase in the discount. The finding that home prices in the 100-year floodplain were discounted in Harris County even before Hurricane Harvey captures the impact of the information embedded in the floodplain maps on homebuyer risk perception. The discount is a signal that the market perceives the incremental flood risk prior to a hurricane and prices that risk accordingly. After a hurricane, homebuyers update their flood risk perception and the discount rises relative to the pre-hurricane discount. These results indicate that a recent experience with flooding leads to a perception of increased flood risk. In states where real estate laws requiring disclosures of flood risk are strict and in case of conventional loans, buyers can make an informed decision and include the risk of flood-related loss in pricing a home located in a floodplain, which in turn minimizes wealth loss from future flooding.
Through research like this, risk modeling and third- party analysis, Freddie Mac actively monitors the risks to our mortgage portfolio from natural disasters as well as to the broader housing and mortgage markets. This risk is reviewed at the highest levels of management.
Freddie Mac’s Approach
Some of the ways Freddie Mac mitigates losses from natural disasters includes requiring all homes collateralizing single- family mortgages in our portfolio to have homeowner insurance coverage in amounts equal to the Unpaid Principal Balance of the mortgage or 80% of the replacement cost of the property improvements, whichever is higher. This protects both Freddie Mac and homeowners by ensuring the coverage will always be enough to cover the balance of the mortgage obligation should a property become a total loss. Coverage must be provided by a licensed insurance company that meets certain financial strength ratings.
Additionally, for homes located in Special Hazard Flood Areas (SFHAs) designated by FEMA, the borrowers must have flood insurance coverage, which is not included in homeowner insurance policies. This includes ensuring that flood insurance coverage exists at the time the loan is sold to Freddie Mac, is maintained throughout the life of the loan, and is in amounts needed to comply with federal government and Freddie Mac requirements. In the event a borrower fails to obtain and maintain required homeowner or flood coverage, Freddie Mac requires servicers to directly place coverage.
Freddie Mac also requires that all properties collateralizing multifamily loans purchased by Freddie Mac be fully insured for all relevant perils, including fire, wind, tornadoes, hurricanes and (if located in a SFHA) floods. Insurance must be in place to cover losses for both buildings and business income associated with multifamily loans. Furthermore, Freddie Mac requires earthquake coverage for properties in areas at elevated risk for such events. These coverage requirements are in line with those required by institutional commercial/multifamily real estate lenders.
Freddie Mac loss exposure from natural disasters is further limited by:
- The geographic diversity of its mortgage portfolio. This limits the impact of any single natural disaster event to the subset of loans secured by homes located in the affected area.
- High levels of borrower equity. Freddie Mac's overall single- family mortgage guarantee portfolio currently has a loan to value (LTV) ratio of near 60%, while the LTV ratio of the multifamily guarantee portfolio is 47%. These high levels of equity provide substantial incentives for borrowers to protect and maintain their properties, both before and after a natural disaster.
- Relief options for borrowers affected by natural disasters. These include forbearance programs for both single-family and multifamily borrowers, and additional options for single- family borrowers (loan modifications, short sales and deeds in lieu of foreclosure). This reduces the numbers of borrower defaults and foreclosures.
For these reasons, Freddie Mac’s defaults and subsequent losses from past natural disasters such as Hurricane Katrina, Super Storm Sandy, and the 2017 Harvey, Irma, and Maria hurricanes, have not resulted in significant economic losses to the company.
To better manage flood risk in its single-family business, Freddie Mac also reviews alternative flood models and maps in addition to FEMA’s maps. These third-party sources help us assess the impact of rising sea levels that identify coastal communities that face chronic inundation, which helps us evaluate our potential exposure in these areas. Additionally, in our multifamily business we supplement our reliance on FEMA maps with property surveys and the use of virtual maps to identify buildings that might be located in areas where flood insurance is required.
Appendix
Data Sources
- CoreLogic Public records
- Federal Emergency Management Agency (FEMA) flood maps for flood risk
- U.S. Census TIGER files for school districts and distance to highways
- U.S. Census Bureau Area Hydrography data for distance to Lake Houston, distance to Galveston Bay, distance to San Jacinto River
- United States Geological Survey (USGS) data for superfund sites
Study Area
Methodology
Hedonic Model with a Difference-in-Difference Framework

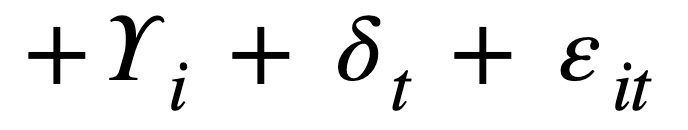 where
where  is the structural attributes;
  is the location attribute;
  is the risk variable, which is the location of a property in the floodplain (equal to 1 if the property is inside the 100-year floodplain and 0 otherwise). The variable
  is a dummy equal to 1 if the property was sold after Hurricane Harvey and 0 otherwise.
  and
and  are school district and year fixed effects, respectively. Our variable of interest is
  , which is the difference-in-difference estimate controlling for the unobservables.
References
Atreya, A., and J. Czajkowski. 2016. “Graduated Flood Risks and Property Prices in Galveston County.” Real Estate Economics. Advance online publication. doi: 10.1111/1540-6229.12163.
Atreya, A., S. Ferreira, and W. P. Kriesel. 2013. “Forgetting the Flood? An Analysis of the Flood Risk Discount over Time.” Land Economics 89 (4): 577–96.
Bin, O., and C. E. Landry. 2012. “Changes in Implicit Flood Risk Premiums: Empirical Evidence from the Housing Market.” Journal of Environmental Economics and Management 65 (3): 361–76.
Bin, O. and Polasky, S. 2004. "Effects of Flood Hazards on Property Values: Evidence Before and After Hurricane Floyd." Land Economics 80, 490–500.
Botzen, W. J. W., J. C. J. H. Aerts, and J. C. J. M. Van Den Bergh. 2009. “Dependence of Flood Risk Perceptions on Socioeconomic and Objective Risk Factors.” Water Resources Research 45 (10). https://doi.org/10.1029/2009WR007743.
Działek J, Biernacki W, Bokwa A. 2013. Impact of social capital on local communities’ response to floods in southern Poland. In: Neef A, Shaw R (eds) Risks and conflicts: local responses to natural disasters. Community, environment and disaster risk management, vol 14. Bingley, Emereland, pp 195–205
Kiel, K. A., and M. Williams. 2007. “The Impact of Superfund Sites on Local Property Values: Are All Sites the Same?” Journal of Urban Economics 61 (1): 170–92.
Kousky, C. 2010. “Learning from Extreme Events: Risk Perceptions after the Flood.” Land Economics 86 (3): 395–422.
Lechowska, E. 2018. “What Determines Flood Risk Perception? A Review of Factors of
Flood Risk Perception and Relations between Its Basic Elements.” Natural Hazards 94: 1341–66.
https://doi.org/10.1007/s11069-018-3480-z.
Mallakpour, I., and G. Villarini. 2015. “The Changing Nature of Flooding across the Central United States.” Nature Climate Change, February. https://www.nature.com/articles/nclimate2516.
Messner, F., and V. Meyer. 2006. “Flood Damage, Vulnerability and Risk Perception—Challenges for Flood Damage Research.” In Flood Risk Management—Hazards, Vulnerability, and Mitigation Measures, edited by J. Schanze, E. Zeman, and J. Marsalek, 149–67. Nato Science Series IV, Volume 67. Springer.
New York University Furman Center 2017 FloodZoneData.us http://floodzonedata.us.
Raaijmakers, R., J. Krywkow, and A. van der Veen. 2008. “Flood Risk Perceptions and Spatial
Multi-Criteria Analysis: An Exploratory Research for Hazard Mitigation.” Natural Hazards 46: 307–22.
Reichert, Alan K. 1997. “Impact of a Toxic Waste Superfund Site on Property Values.”
The Appraisal Journal October: 381–92.
Wachinger, G., O. Renn, C. Begg, and C. Kuhlicke. 2013. “The Risk Perception Paradox— Implications for Governance and Communication of Natural Hazards.” RiskAnalysis33 (6): 1049–65.
Footnotes
- The 26% probability is calculated as 1-(1-0.01) ^30.
- The SFHA is the area where the National Flood Insurance Program's (NFIP's) floodplain management regulations must be enforced and the area where the mandatory purchase of flood insurance applies. The SFHA includes Zones A, AO, AH, A1-30, AE, A99, AR, AR/A1-30, AR/AE, AR/AO, AR/AH, AR/A, VO, V1-30, VE, and V.
- https://www.economy.com/dismal/analysis/298203
- Federal Insurance and Mitigation Administration National Flood Insurance Program (FIMA NFIP) Redacted Claims Dataset. https://www.fema.gov/media-library/assets/documents/180374.
- https://furmancenter.org/floodzonedata/data/texas.
- The superfund site data layer contains all sites in Harris County in the State of Texas that have been designated as Superfund cleanup sites; it includes both Federal and State sites. Federal Superfund sites are placed on the U.S. Environmental Protection Agency (US-EPA) National Priorities List (NPL). The Superfund web URL for Harris County is https://www.tceq.texas.gov/remediation/superfund/sites/county/harris.html
- The discount can also be attributed to cost of mandatory periodic flood insurance premiums in the 100-year floodplain being capitalized into home prices.
- In case of conventional loans, buyers looking to buy a property in SFHA are informed in advance by their loan officer and real estate agent that they need to obtain flood insurance coverage.
- As suggested by positive and significant post Harvey variable (see aharvey variable regression results).
- Calculated as exp (0.023+0.0251+0.034)-1=0.031 or 3.1%.
- Calculated as exp (0.032+0.028+0.043) =0.046 or 4.6%
PREPARED BY THE ECONOMIC & HOUSING RESEARCH GROUP
Sam Khater, Chief Economist
Len Kiefer, Deputy Chief Economist
Ajita Atreya, Senior Macroeconomic Housing Economist