Mortgage Forbearance and Performance during the Early Months of the COVID-19 Pandemic
During the COVID-19 crisis, mortgage forbearance plans have played an important role in helping households manage their finances by providing short-term liquidity to mortgage borrowers. Mortgage forbearance plans temporarily remove the obligation of borrowers to make their monthly mortgage payment.1 Forbearance plans are typically used by borrowers who experienced a hardship such as a sudden loss of employment, a reduction in income, or a natural disaster. However, on March 18, 2020, Freddie Mac extended broad mortgage relief to borrowers unable to make their mortgage payments because of COVID-19, regardless of whether or not they have contracted the virus.2 Included among these relief options were forbearance plans that could provide borrowers with payment relief for up to twelve months, while suspending borrower late charges and penalties. Mortgage forbearance peaked in May 2020, with more than 4 million U.S. mortgages in forbearance, which represents about 8% of outstanding mortgages and $1 trillion in mortgage debt.3
Freddie Mac's November 2020 Insight explored the incidence of forbearances. A natural extension of this line of investigation is to examine what happens to these mortgages after entering a forbearance plan. We find that the payment behavior of borrowers once they enter forbearance during the COVID-19 period is complex. While many borrowers stop making payments altogether, many others continue to make mortgage payments even after entering forbearance and some make intermittent payments. Some borrowers enter forbearance and then payoff their mortgage balances, either from a sale of the property or by refinancing their mortgage. This Research Note illustrates some aspects of the payment patterns of Freddie Mac funded mortgages in forbearance during the current crisis.
Data
We analyze the performance for a sample of 446,610 Freddie Mac loans that entered forbearance in the six month period from March 2020 through August 2020.4 About 87% of loans in this sample entered forbearance in March, April, or May 2020. April was by far the biggest month, accounting for 58% of the sample. This increase in new forbearances at the start of the COVID-19 period tapered considerably by the summer of 2020, although monthly new forbearances remained at an elevated level. From servicing data, we observe loan payments through October 2020, which permits at least three months of performance to be observed for each loan. For the small fraction of loans that terminate because of payoffs, we include the performance for the months they are active and the month that the loan was paid off. Note that we do not track forbearance exits in this analysis, so some of these borrowers making payments may have exited forbearance. This allows us to circumvent any definitional issues arising from gaps or lags in loan servicer reporting of forbearance plans.
Analysis
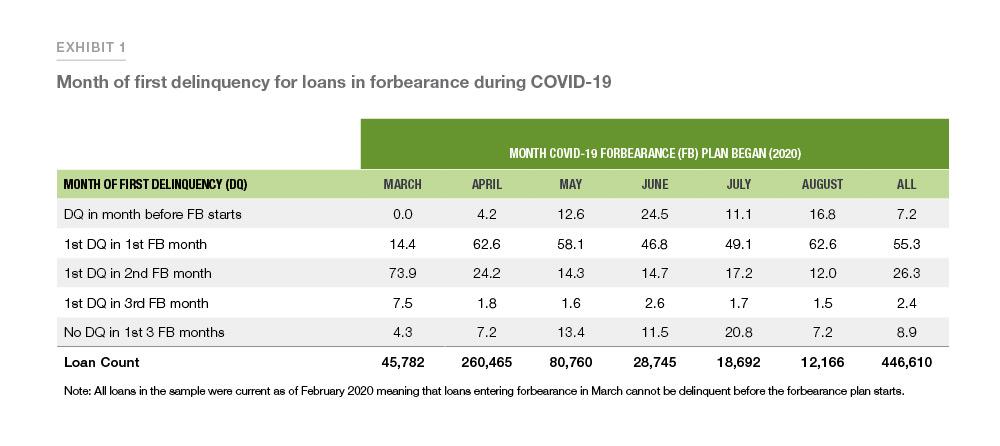
For each loan, we identify the month of first delinquency for loans in forbearance starting with the month prior to the start of the forbearance plan. Exhibit 1 displays the share for each month of first delinquency by the month they entered forbearance and for all months. The first row shows the share that were delinquent in the month before entering forbearance. The second through fourth rows show the share that were first delinquent within three months of entering a forbearance plan. The fifth row shows the share that were current both in the month before and the first three months after entering forbearance. Focusing on the right-most column, which reports on all loans in the sample, 55.3% of borrowers miss their first payment in the first month of forbearance. Further, only 8.9% of loans remain current through the first three month in forbearance: that is, 91.1% missed a payment in the first three months or were delinquent before their forbearance plan began.5 Looking at the columns by forbearance start date, we see that the month of first delinquency peaks in the first month of forbearance, except for March, where delinquency peaks in the second month. The March cohort has a slightly delayed peak because the unemployment impact of the COVID-19 crisis started in the second half of March, when many borrowers would have already made that month’s mortgage payment.
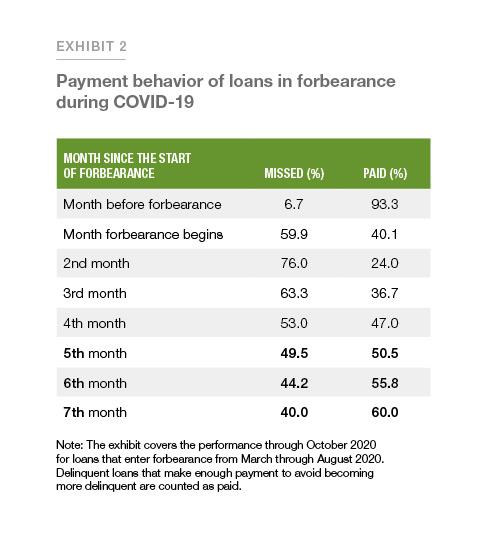
The next exercise examines the average payment behavior for a loan entering forbearance in the COVID-19 period. Exhibit 2 shows the share of borrowers who made payments at each month since entering forbearance. A borrower is considered to have made a payment if they are current in that month, paid off in that month, or the number of months delinquent is unchanged from the previous month. We find 40.1% of borrowers continue to make their mortgage payment in the first month of their forbearance. In the second month, only 24.0% of borrowers make their payment. In the third month, the number of borrowers making payments increases to 36.7% and continues to rise through the seventh month to a level of 60.0%.6.4
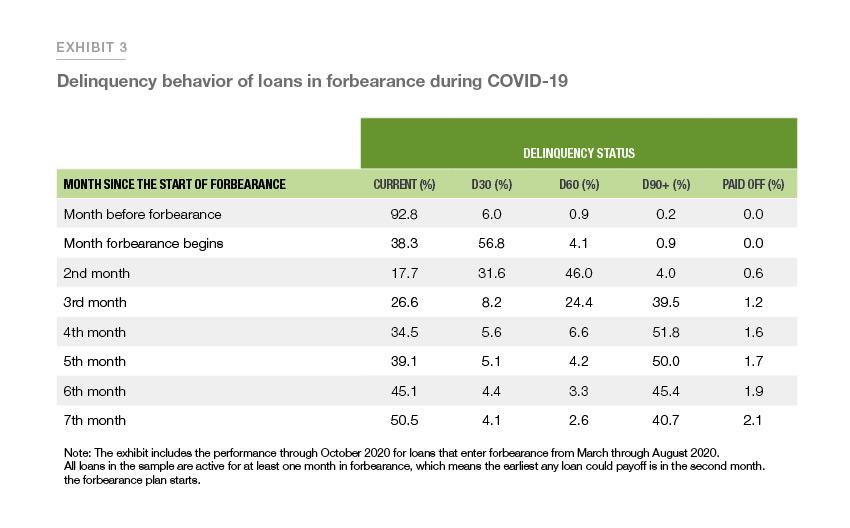
The next exhibit suggests that most borrowers who enter forbearance can be classified into one of two types: those who are current within six months of entering forbearance and those that remain at least 90 days delinquent after six months. Some of these loans may have become current by entering a repayment plan or modification. In Exhibit 3, we present the share of borrowers by delinquency status at each month since entering forbearance. As shown in the first column, 92.8% of the borrowers are still current in the month before entering forbearance, 38.3% are current in their first month of forbearance, and only 17.7% are current in the second month of their forbearance plan. Subsequently, the fraction of current borrowers increases, and by the seventh month since entering forbearance, more than 50% of the loans have become current. We can also track loans that are making no payments by examining the diagonal entries in the table: 56.8% of loans are D30 in the first month of forbearance; 46% are D60 in the second month, and 39.5% are D90+ by the third month.
Conclusion
Mortgage forbearance has played an important role in protecting borrowers affected by the COVID-19 pandemic. Millions of families have been able to stay in their homes with the help of financial relief provided by Freddie Mac, including mortgage forbearance. Without this relief, many of these households would have been forced to sell their homes or would have defaulted on their mortgages, which, in turn, could have depressed the housing market, leading to further defaults in a vicious cycle.
We have examined the payment behavior of borrowers who entered forbearance during the early months of the COVID-19 crisis. We have shown that almost all (91.1%) of mortgages in forbearance missed at least one payment within the first three months or were delinquent when entering forbearance. However, by the seventh month, a majority (60%) of forbearances have made some payments. Finally, we have shown that by the seventh month after entry into forbearance, about half of the mortgages are current whereas about 40.7% are D90+. When combined with the large number of mortgages entering forbearance in April 2020, this suggests that there could be a large number of borrowers who will need to negotiate repayment plans, loan modifications, or short sales as the forbearance plans come to an end.
Appendix
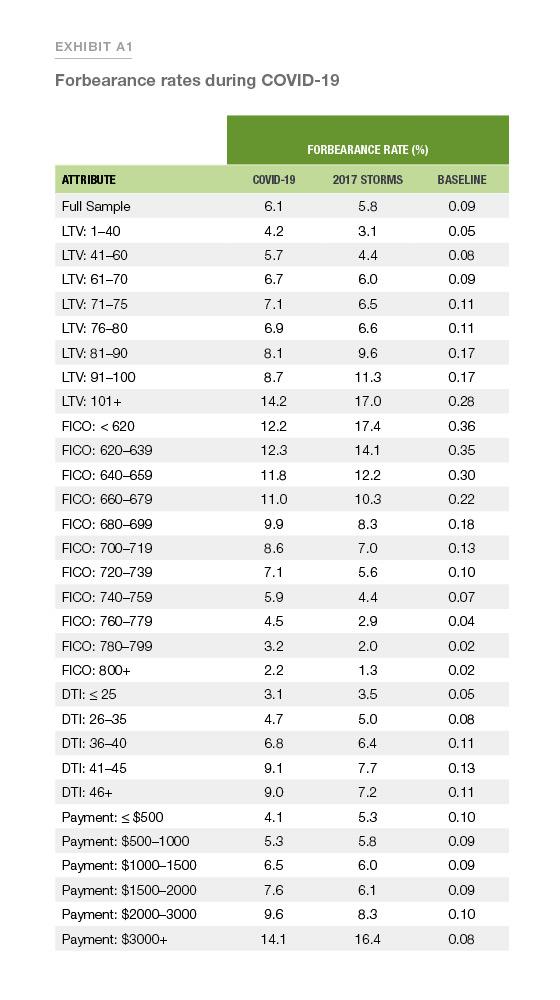
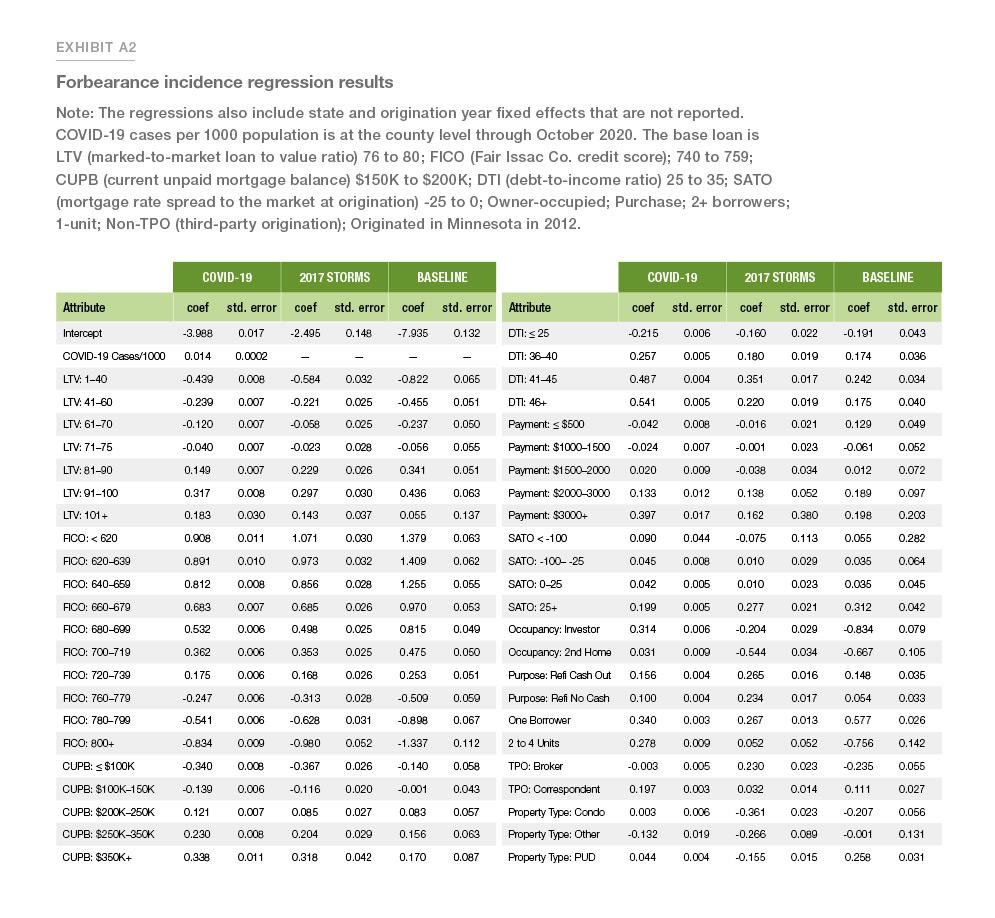
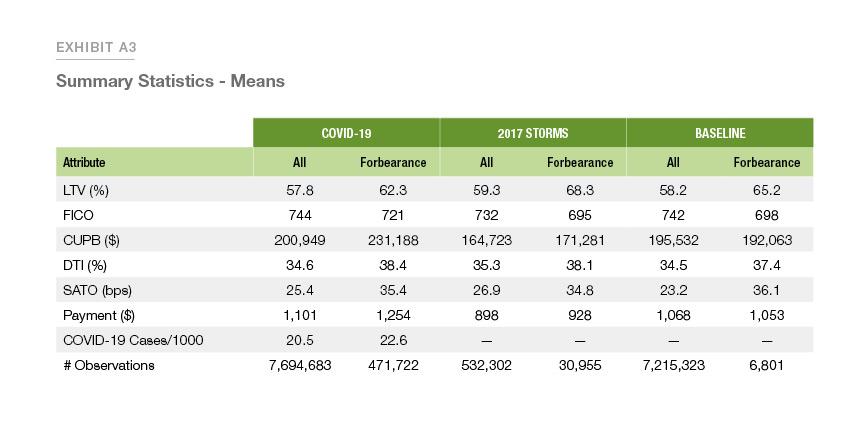
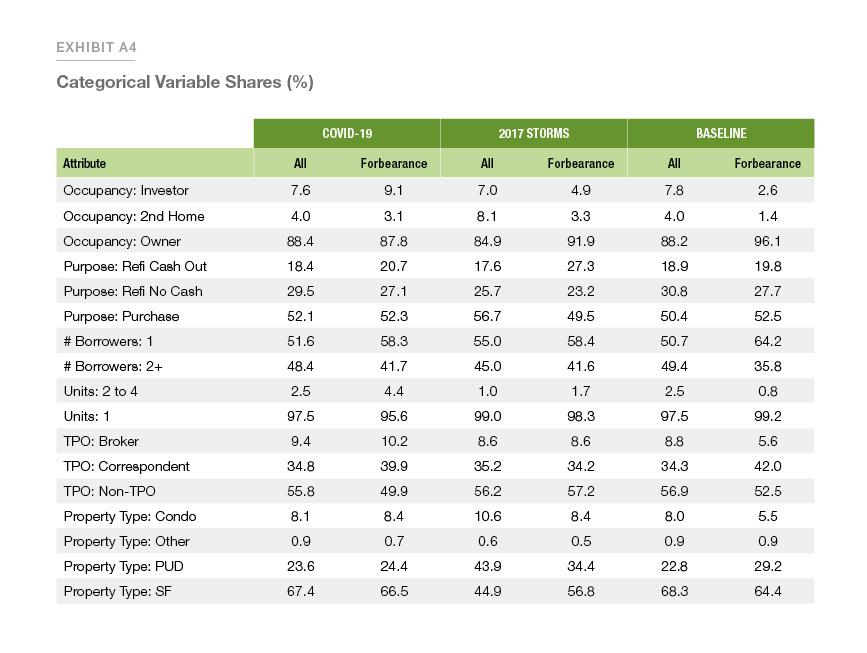
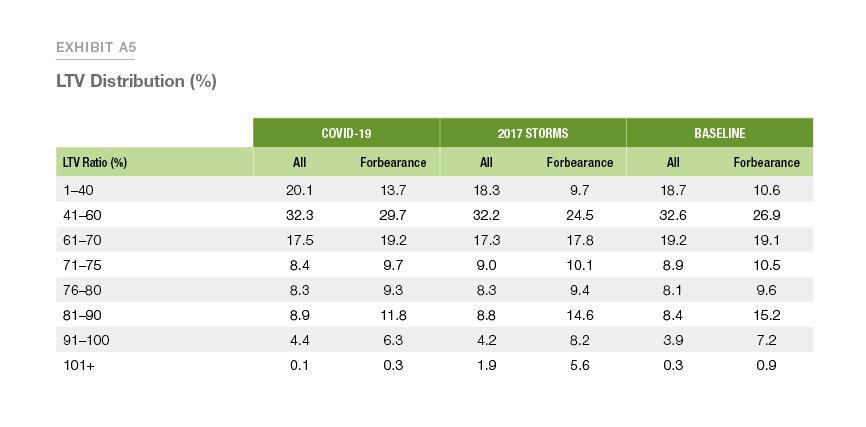
The following exhibits provide an update to the November 17th Insight ‘Mortgage Forbearance Incidence during the COVID-19 Crisis’ using data through October 2020. This updated analysis provides a larger context of which loans enter forbearance and helps frame the payment behavior analysis presented in this note. The data include loan-level servicing information for Freddie Mac mortgages over three different observation periods: the 2017 Storms period (August 2017 to December 2017 for disaster areas); the Baseline period (January 2019 to February 2020); and the COVID-19 period (March 2020 to October 2020). The data includes 30-year fixed-rate mortgages that were current and not in forbearance the month before the start of the observation period. For the 2017 Storms period, we consider the forbearance rate only among those loans eligible for disaster-related forbearance programs. Exhibit A1 displays the rate of forbearance in each sample as a whole and by loan characteristics. Exhibit A2 displays the regression results of a logistic regression of forbearance incidence for each period. In the COVID-19 regression, the cumulative confirmed cases in each county as of the end of September is included as a measure of the severity of the pandemic. Exhibits A3 and A4 display the summary statistics for continuous and categorical variables, respectively. Exhibit A5 contains the share in each LTV category for each period and the loans that enter forbearance. Note that loan modifications are disproportionately represented in the 101+ LTV category.
References
- This differs from mortgage principal forbearance as a component of loan modifications, whereby borrowers do not have to pay interest on a portion of the unpaid balance.
- At the same time, Freddie Mac announced a moratorium on foreclosure sales. See https://freddiemac.gcs-web.com/news-releases/news-release-details/freddie-mac-announces-enhanced-relief-borrowers-impacted-covid.
- The Mortgage Bankers Association estimates that 4.2 million U.S. mortgages (8.36%) were in forbearance in May.
- This sample is restricted to borrowers who were current and not already in forbearance as of February 2020 and includes only 30- year fixed-rate loans at origination. Note around 5% of loans in this sample have undergone a modification since origination.
- It should be noted that reporting of current loans in forbearance was not required of servicers until the September servicing cycle. It is possible that these always current forbearances are underreported in our data for this reason. However, we find only slightly higher rates of always current forbearances if we restrict our analysis to a subset of large servicers that reported on current forbearances throughout the COVID-19 period.
- In our sample, in the early months of the COVID-19 crisis about half of borrowers in forbearance continued to make payment when calculated by calendar month instead of by the months since the start of forbearance.
PREPARED BY THE ECONOMIC & HOUSING RESEARCH GROUP
Sam Khater, Chief Economist
Doug McManus, Director of Financial Research
Elias Yannopoulos, Senior Macro Housing Economist