Trends in Mortgage Refinancing Activity
This Research Note covers recent developments in the U.S. mortgage market. We review trends in mortgage refinancing activity, including a detailed look at payment savings and equity extraction through cash-out refinances. We also examine recent trends in mortgage origination discount points and fees and close with a discussion of heterogeneity in the mortgage market.
Recent mortgage market trends
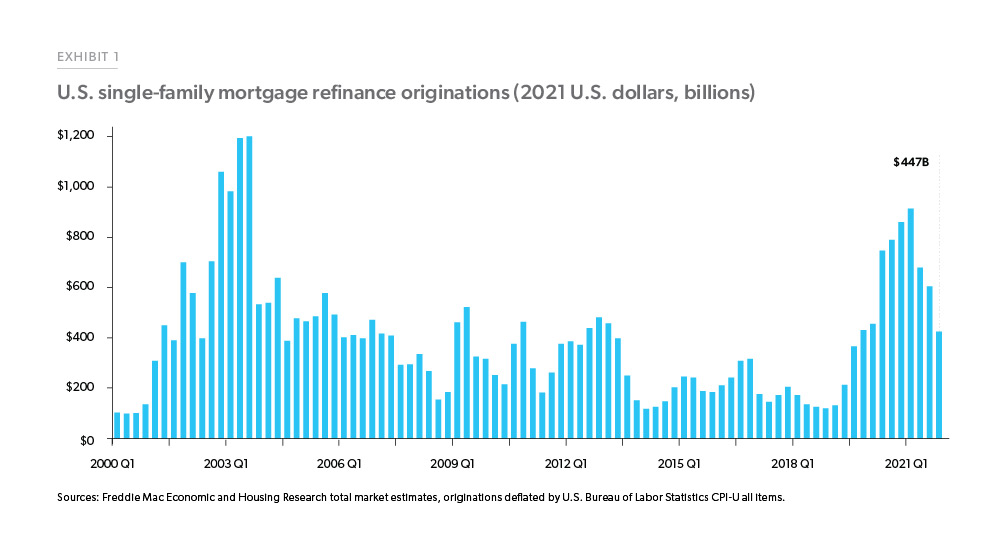
Low mortgage rates coupled with robust house price appreciation in 2021 contributed to a strong mortgage origination market. According to Freddie Mac’s Primary Market Mortgage Rate Survey® (PMMS), the 30-year fixed-rate mortgage averaged 3.0% in 2021. House prices rose 17.7% in 2021, compared to an 11.3% growth in 2020. Exhibit 1 shows first-lien refinance origination trends since 2000 in inflation-adjusted 2021 dollars. In 2021, there were about $2.8 trillion in first-lien refinance originations, a 7.6% decline from 2020. The strong refinance pace of the last two years is still lower than the pace registered during the refinance boom in 2003 when refi originations volume reached $4.1 trillion in 2021 dollars.
In 2021, borrowers continued to take advantage of the low mortgage rates and increased home equity by refinancing their properties, reducing their monthly payments and extracting equity through cash-out refinances.
Borrowers saved over $2,700 annually in mortgage payments by refinancing
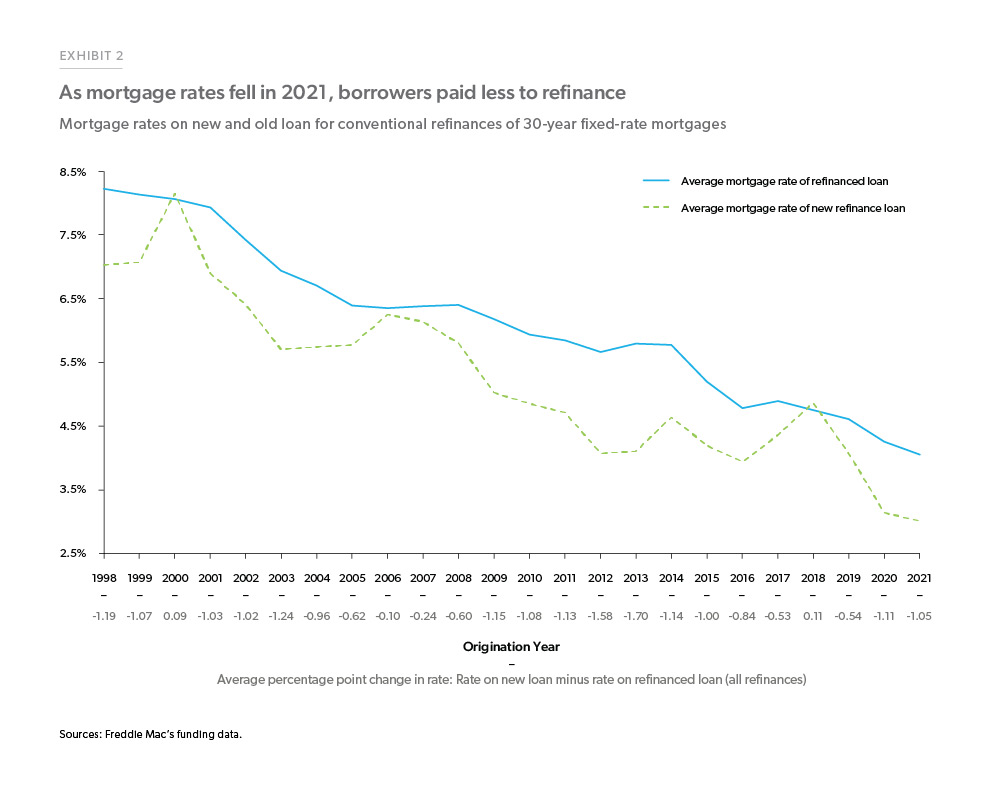
Refinance borrowers last year were able to save money on their payments and lock in lower rates. Borrowers who refinanced their first-lien conventional mortgages in 2021 lowered their mortgage rates on average by 1.15 percentage points. Exhibit 2 compares the average mortgage rate of the loans that were refinanced against the average mortgage rate of the new refinance loan starting from 1998 through 2021.
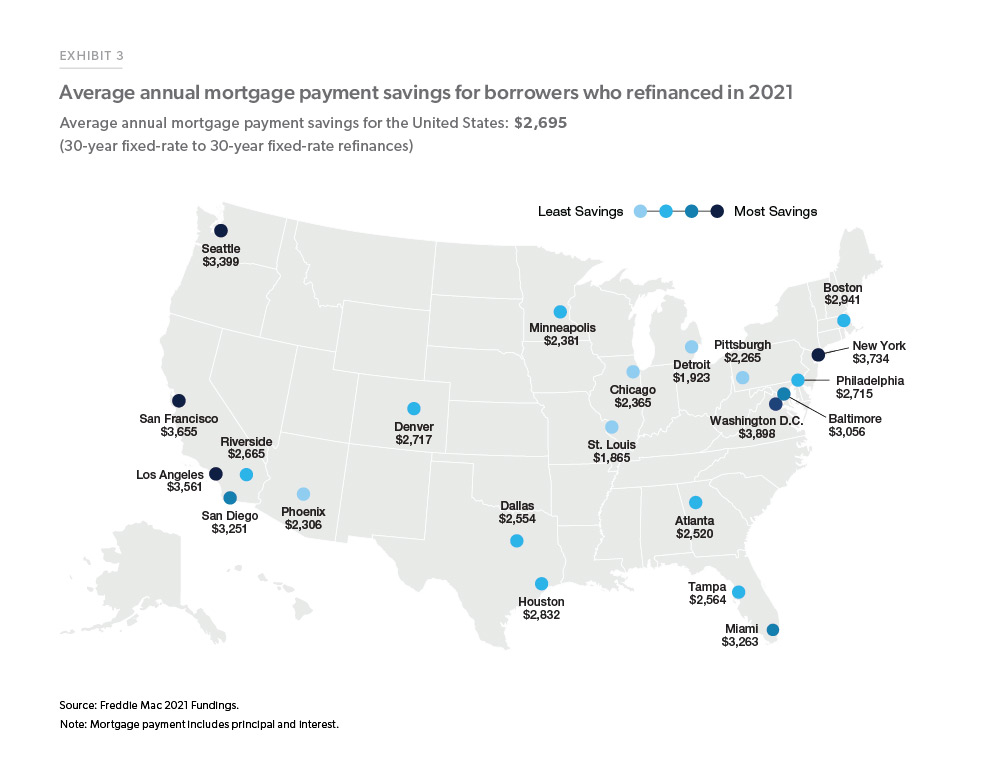
Borrowers who refinanced their 30-year fixed-rate mortgage into another 30-year fixed-rate mortgage during 2021 to lower their mortgage rate (non cash-out refinances) saved about $2,700 in mortgage payments (principal and interest) annually. Exhibit 3 shows the average mortgage payment savings from rate-refinances of a 30-year fixed-rate mortgage into another 30-year fixed-rate product for the largest metropolitan statistical areas, or MSAs. In general, borrowers in more expensive coastal markets were able to save more money (almost $4,000 a year in Washington, D.C., for example), primarily because house prices are generally higher in those areas, and thus mortgage balances are higher. But borrowers in lower-cost markets in the interior of the country still were able to save significantly. For example, borrowers in St. Louis saved over $1,800 a year on average.
Home equity and refinances
Due to increased mortgage rates, we expect aggregate refinance volume to decline. As rates move higher, borrowers find their potential savings from refinance diminished. However, borrowers do not only refinance to lower their rate; they also refinance to change terms or extract equity through a cash-out refinance. If rates continue to move higher, then cash-out refinances will occupy a larger share of refinance activity.
As rates increase, we expect refinance volumes to decline. However, as borrowers seek to extract equity from their homes, a large share of refinance activity is expected to be cash-out refinances.
According to the latest data available from the Federal Reserve’s Board Financial Accounts of the United States, aggregate homeowner equity was over $25 trillion as of the third quarter of 2021, up about 4.3% from the previous quarter, while mortgage debt has increased just 2.0% during the same time period. Therefore, the aggregate ratio of home equity to the value of housing stock has increased to about 69% in the third quarter of 2021.
Low mortgage rates and increasing home values in 2021 incented many homeowners to extract equity through cash-out refinances. Our data show an increase in both the number of cash-out refinances and the aggregate dollar amount that borrowers extracted from their home equity through cash-out refinances.
We analyze data of matched refinance transactions purchased by Freddie Mac from 1998 through 2021. These data give us insight into refinance trends over a variety of economic conditions and allow us to compare activity today to earlier years. Our dataset links a refinance transaction back to an earlier mortgage loan (both purchase and refinance) and lets us see how the borrower’s income, debt, equity, and house value have changed between transactions. By comparing the outstanding unpaid principal balance (“UPB”) of the refinanced original loan to the loan amount of the new mortgage loan, we can track the amount of equity that was extracted, either through cash or used to consolidate other debt such as second-lien mortgages.
First, we compute summary statistics over time presented in Table 1 (on the following page). For each year of origination, we compute the incidence of cash-out: the share of mortgages that involve a cash-out (defined here as a 5% or more increase in the UPB of the new loan relative to the outstanding UPB of the refinanced original loan). We also compute the extent of cash-out: how much equity was extracted through a cash-out refinance both in nominal dollars and as a percent of the property value.
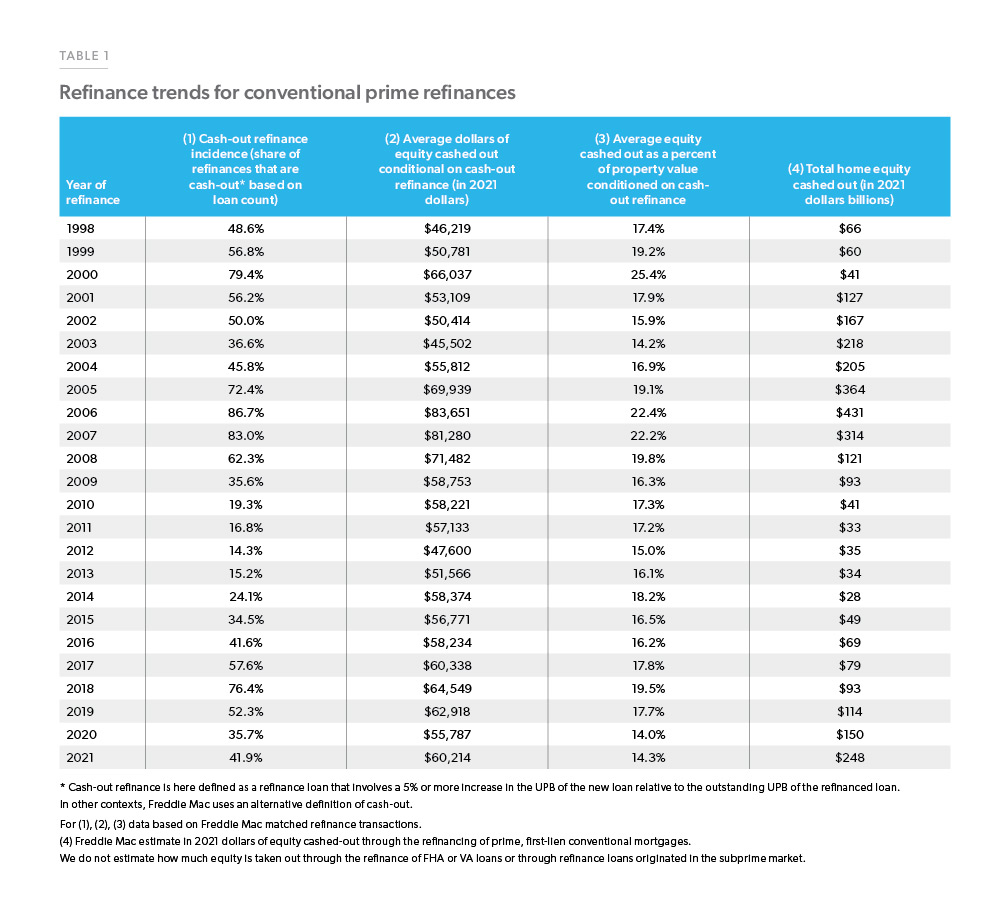
This table highlights some important trends. Column (1) shows that the share of refinance mortgages that were cash-out increased from 36% in 2020 to 42% in 2021. Columns (2) and (3) show that the amount of equity extracted, either in inflation-adjusted dollars (Column (2)) or as a percent of the property value (Column (3)), only increased modestly from 2020 to 2021. In 2021, cash-out refinance borrowers extracted on average an inflation-adjusted $60,214, or 14.3% of their property’s value. Contrast this to 2006, when cash-out borrowers extracted $87,630, or 22.4% of their property’s value. In the aggregate, Column (4) shows our estimate of the total amount of equity extracted via cash-out refinance (of conventional loans) was $248 billion in 2021. That is up nearly $100 billion from 2020, but still well below the $431 billion that was extracted in 2006.
As rates rise, will borrowers pay more points?
In recent years, with mortgage rates reaching multiple record lows, relatively few borrowers have opted to pay discount points. But as interest rates increase, borrowers may find paying discount points to lower their rate to be more attractive. With growing concern over inflation and interest rates moving higher, will borrowers start to use discount points to help lower interest payments?
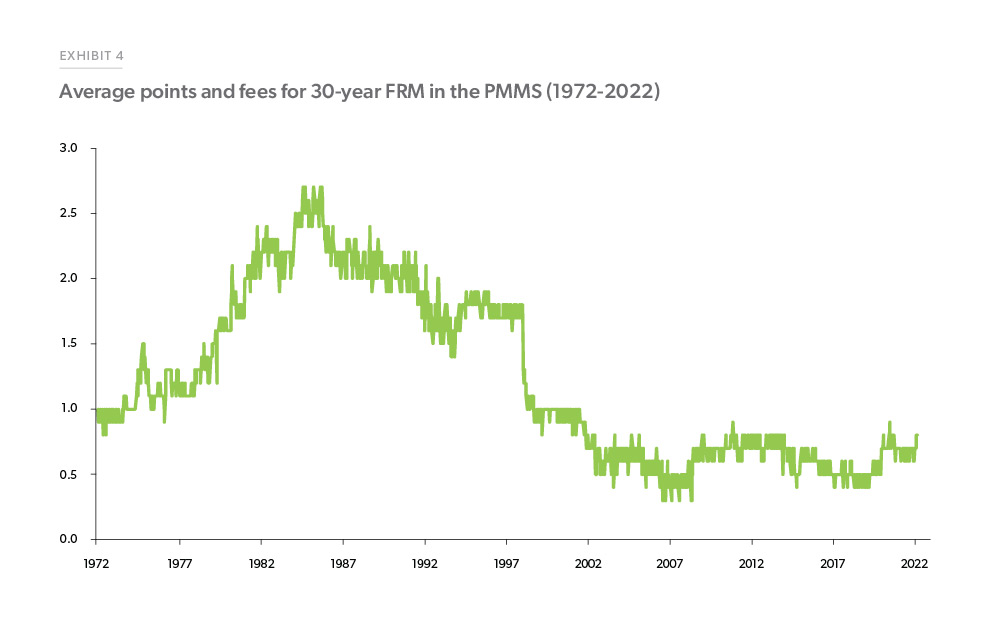
The PMMS has surveyed lenders on mortgage costs back to the early 1970s (Exhibit 4). Consistent estimates of average points and fees began in the PMMS in 1972 (weekly estimate of the average fixed 30 rate began in 1971, but points were initially only surveyed monthly until 1972). As interest rates increased throughout the 1970s and early 1980s, average points and fees increased until peaking at 2.7 percentage points during several weeks of 1984 and 1985.
With inflation recently reaching the highest levels since the early 1980s, it is worth considering whether borrowers will opt to pay more points going forward. When borrowers pay points, they may receive a lower rate, but what does the data show?
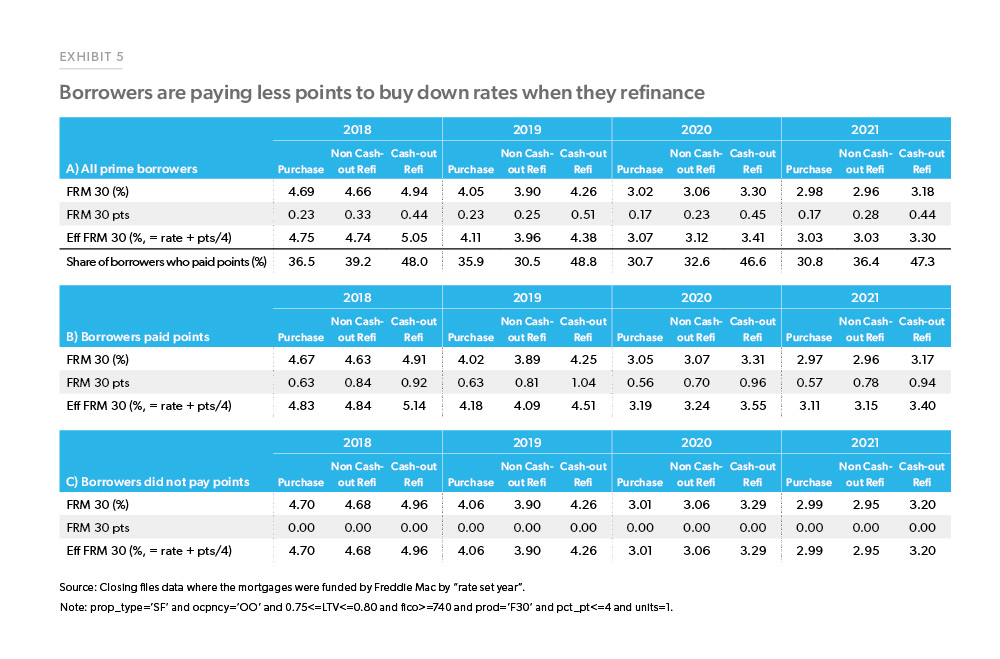
Using Freddie Mac closing data we can examine what happens to borrowers who do pay discount points in terms of the average interest rate they receive as compared to otherwise similar borrowers who do not pay discount points. Specifically, we looked at a narrow borrower profile that roughly matches our PMMS population: mortgage for a home purchase or refinance of a single-family owner-occupied property with a fully amortizing 30-year fixed mortgage. We further restricted our sample to borrowers with conforming loans, and with credit scores 740 or above and a Loan-to-Value ratio between 75 and 80 (inclusive).
We found that most borrowers did not pay discount points in recent years (Exhibit 5). Only 30.8% of purchase mortgage borrowers paid discount points in 2021. The share paying discount points was somewhat higher for non-cash-out and cash-out refinance borrowers, 36.4 and 47.3% respectively. Also, conditional on paying points, refinance borrowers tended to pay much higher points: 0.57 points for purchase borrowers compared to 0.78 and 0.94 points for non cash-out and cash-out refinance borrowers, respectively.
It is interesting to note however, that the interest rate differential between borrowers who pay discount points and those who do not pay discount points is very small. In 2021 the average rate on purchase loans for borrowers who did not pay discount points was 2.99% versus 2.97% for those who did pay.
The lack of a significant difference in rates between borrowers who pay discount points and those who do not is puzzling. Researchers who have examined points have found that from the borrowers’ perspective, points are often a negative net present value decision for many borrowers.1 There is also growing literature on the enormous heterogeneity in the mortgage markets. Many borrowers who share very similar attributes receive very different mortgage rates.
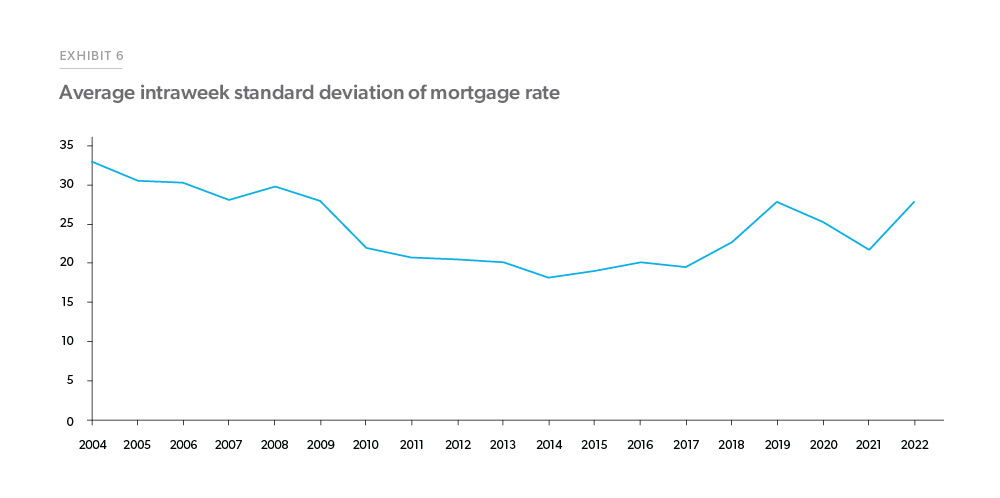
For example, when we look at the intraweek variation in mortgage rates for applications submitted to Freddie Mac’s Loan Product Advisor for borrowers meeting the PMMS profile, we see a lot of variation as displayed in Exhibit 6. For example, from January 2000 through February 2022, the intraweek standard deviation of mortgage rates for borrowers meeting the PMMS profile averages about 0.25 percentage points, and the intraweek range of quotes is 3 percentage points. That is an notable difference in rates, and even after accounting for possible outliers leaves sizable variation.2 Within a week rates may drift up or down, which can account for some of the variations we see, but the average absolute difference in average rate is only 0.05 percentage points, or 1/5th of the observed intraweek variation. The “extra” variation is due to some unobserved borrower heterogeneity.
At this point, we cannot say for sure what is the true source of the unobserved heterogeneity in borrowers that leads to such a wide dispersion in rates. The literature has suggested various causes, such as lack of sophistication on the part of borrowers or an unwillingness to shop around. Another explanation could be that important risks are not captured in the key variables we track but are observed by the lenders. There is also the possibility of discrimination in the market, either intentionally or unintentionally through loan officers’ unconscious bias.
References
1 See for example: Agarwal, S., Ben-David, I., & Yao, V. (2017). Systematic mistakes in the mortgage market and lack of financial sophistication. Journal of Financial Economics, 123(1), 42-58.
2 See also Bhutta, N., Fuster, A., & Hizmo, A. (2020). Paying too much? Price dispersion in the US mortgage market. In this research paper, the authors find that even after controlling for a wide variety of observable loan level attributes, the dispersion in mortgage rates remains very large, about one half of a percentage point between the 90th percentile and 10th percentile borrowers.
PREPARED BY THE ECONOMIC & HOUSING RESEARCH GROUP