What Drove Home Price Growth and Can it Continue?
Home prices, the best single indicator of whether market conditions favor buyers or sellers, jumped 33% nationally over the past two years. What is behind the strength of the housing market, and can it continue?
We believe the answer lies in understanding these four key housing market drivers:
- record low mortgage rates in 2020 and 2021, and the race to beat future rate increases;
- limited supply from underbuilding and below average distressed sales;
- an increase in first-time homebuyers due to favorable age demographics; and
- increased migration from high-cost cities to areas that already had a housing shortage.
What may surprise you is that investors don’t make our list of top drivers. To explain why, we present a never-before-published decomposition of demand by different types of investors.
We look at each driver in turn, emphasizing the increase in first-time homebuyers. We focus on these four while acknowledging that other factors also contributed to a strong housing market, including the pandemic — which increased demand for space for home offices — and government stimulus.
Understanding the key drivers of housing demand and supply provides a powerful framework for thinking about what may be in store for the housing market going forward. Therefore, we conclude by offering some speculation on where these key housing market drivers may be headed and present an estimate of the effect a 1% increase in mortgage rates would have on house prices and sales.
Record low mortgage rates
The pandemic resulted in the 30-year fixed-rate mortgage dropping from 4.6% at the end of 2018 to a record low of 2.7% at the end of 2020. Comparable declines relative to average rates from the prior three years are rare. That large of a drop in rates has only happened twice before in the past 20 years: in 2003 and after the housing bust in 2009. All three occurrences resulted in noticeably higher home price growth, shown in Exhibit 1.
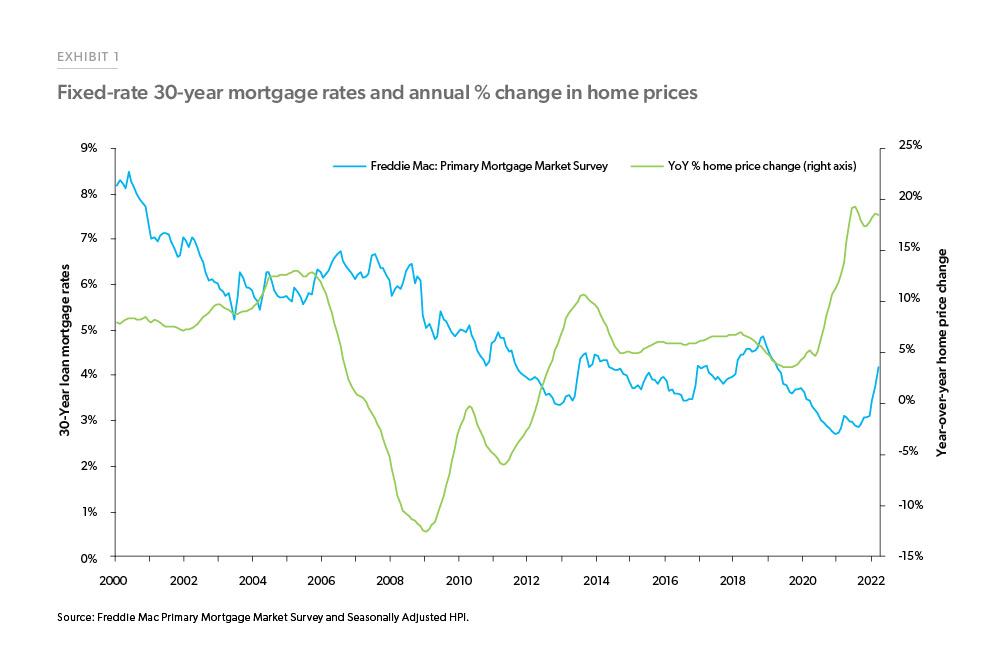
The unusually large decline in mortgage rates benefitted those who refinanced, but unfortunately it also added more demand to an already undersupplied market. Since it is preferable for long-term stability to have home prices increase at a modest pace, one could argue that higher mortgage rates were what we needed since that would have helped balance supply and demand.
The supply of homes for sale was already at record lows before the pandemic
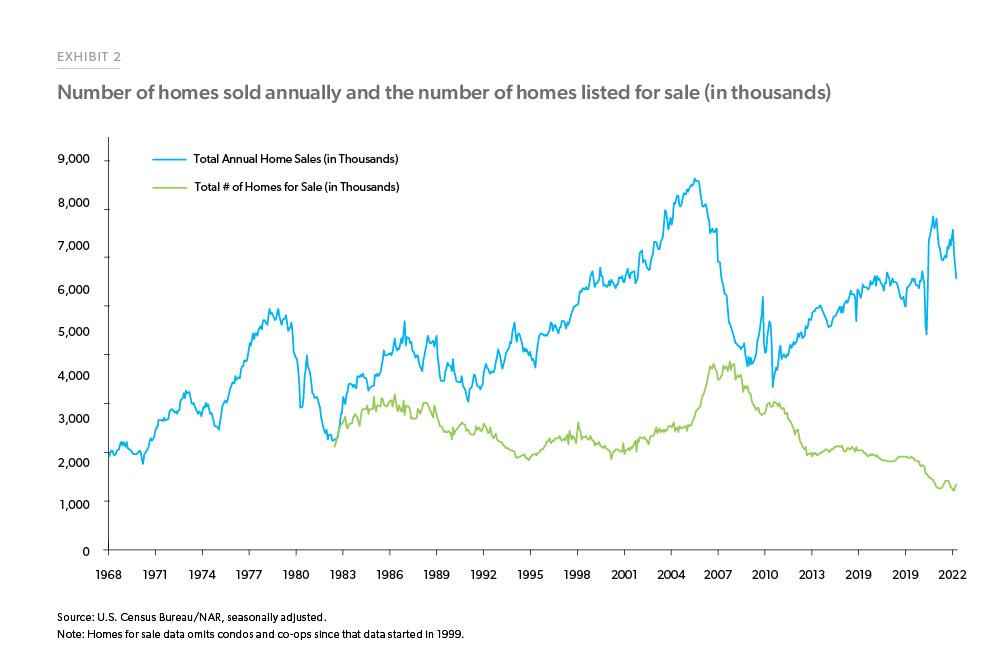
A housing shortage already existed pre-pandemic.1 The shortage was evident in both a record-low number of homes for sale, shown in Exhibit 2, and low vacancy rates. Starting in the summer of 2020, all four of the drivers discussed in this paper combined to push the housing market even more out of balance. Exhibit 2 shows the sum of the number of new and existing homes listed for sale across the country as well as annualized home sales. An increase in home sales and a drop in homes listed for sale are both clearly discernible. Sales would have been—and still would be—even higher if more homes were available for purchase.
Another way to look at the number of homes for sale is to transform it into the number of months it would take to sell listed homes if the current sales rate continued. There is a strong correlation between “Months’ Supply” and home price growth, as shown in Exhibit 3A. When Months’ Supply fell below three months in 2020, it led to a surge in home prices. This led us to correctly anticipate a reacceleration of home prices this spring.
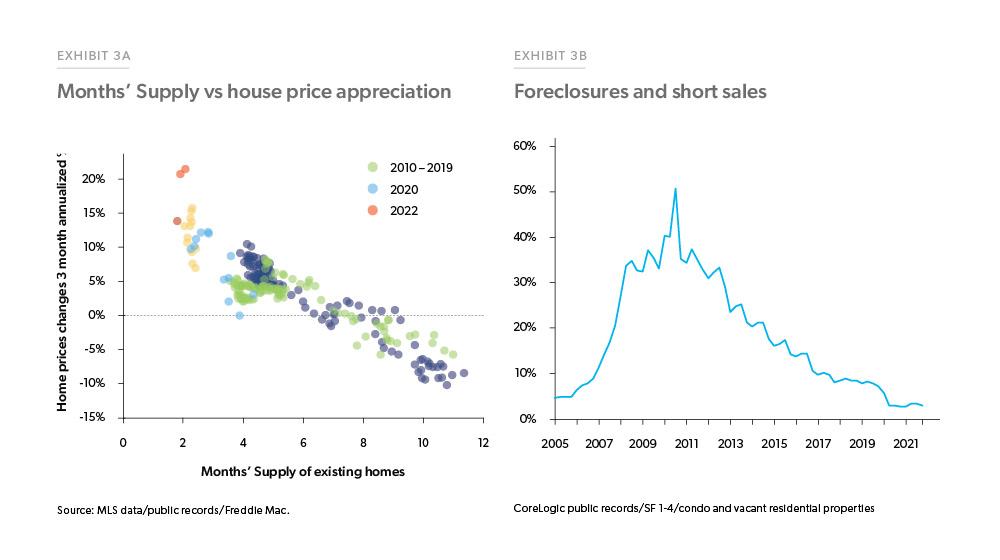
At the same time that sales were increasing due to higher demand, the tight supply got even tighter as builders were slowed down by pandemic related issues and there were fewer distressed sales (both foreclosures and short sales). Exhibit 3B shows the decline in distressed sales, based on CoreLogic Public Records data. Foreclosure and short sales fell from roughly 8% of sales to 3% during 2020 and 2021. Foreclosure and short sales averaged about 350,000 a year right before the pandemic and fell to an average of 145,000 over the past two years. The drop in distressed sales is unquestionably a good thing, but it did add slightly to an existing national housing shortage.
Thanks to pandemic-related forbearance and foreclosure moratoriums, far fewer distressed sales came to market than would have otherwise. These programs provided time for home equity to accumulate due to rising home prices and for employment conditions to improve, suggesting that a significant number of foreclosures were permanently avoided. Thus, strong and rapid action to help struggling borrowers during the pandemic has been an underappreciated success. We don’t believe there is a backlog of distressed sales about to hit the market that could materially impact the overall supply of homes for sale because they were relatively few to begin with, and since then we have had generous loan modifications and far higher home values.
Demand rose due to a record surge in first-time homebuyer purchases
Just as important as the limited new supply is the extraordinary demand from first-time homebuyers. We think highly favorable age demographic trends are the key to today’s housing market.
There is a record number of people in the typical age range for first-time homebuyers, as shown in Exhibit 4A, causing a strong increase in demand for both single and multifamily housing.
There are now 18% more people between the ages of 25 and 34 than in 2006. That is 6.6 million more potential first-time homebuyers, from 39.5 million in 2006 to 46.1 million today.
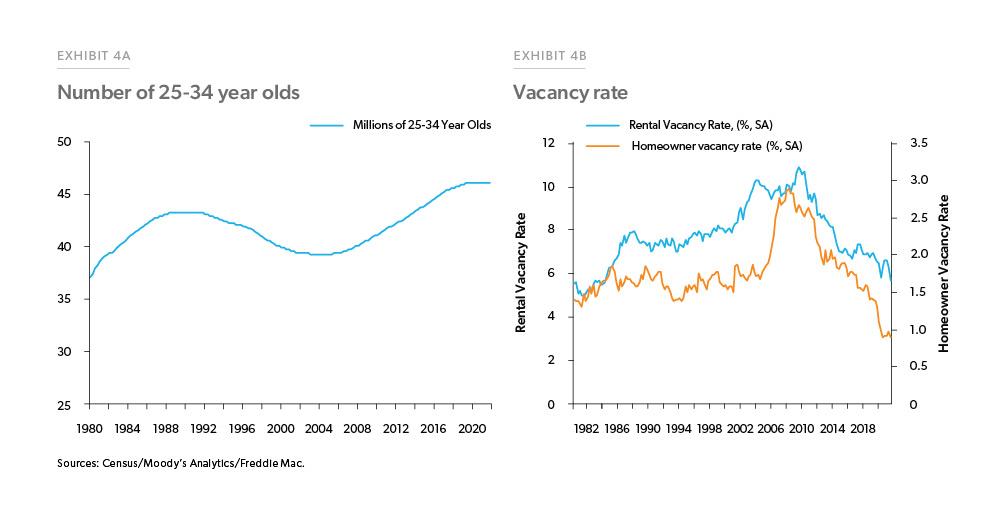
This demographic increase in potential homeowners was not met with enough new construction. Thus, vacancy rates dropped, pushing up rents and making renting less attractive. Exhibit 4B shows the downward trend in both homeowner and rental vacancy rates, which fell to 40-year lows. Looking back at the years from 2002 to 2010, vacancy rates were increasing because there were fewer 25-34-year-olds forming households, and then the demographic trend reversed and vacancy rates fell.
There are now 18% more people between the ages of 25 and 34 than in 2006.
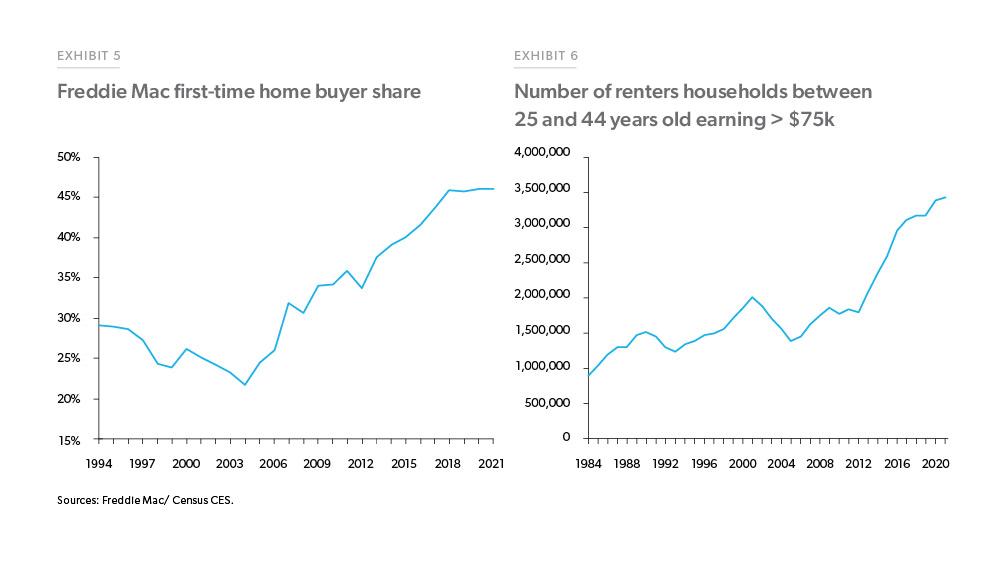
More young adults explain why first-time homebuyers are driving the increase in market demand. This growing cohort of young adults is clearly prominent in mortgage originations. Over the last ten years, Freddie Mac’s share of first-time homebuyer purchases rose from 36% in 2011 to 46% in 2021.
The number of high-income renters who can afford to buy, and are of prime first-time homebuyer age, has also been growing.
Freddie Mac financed 554,000 first-time homebuyers in 2021, up 22% from 2020 and the highest level since tracking began in 1994. Despite higher home prices and record low supply, first-time buyers have added significantly to demand.
In addition to the increase in first-time homebuyers, the number of high-income renters who can afford to buy and are of prime first-time homebuyer age has also been growing. Exhibit 6 illustrates this. This suggests that first-time buyers will remain a potent force for years to come.
Investor purchases are only modestly elevated and are of secondary importance to first-time homebuyers
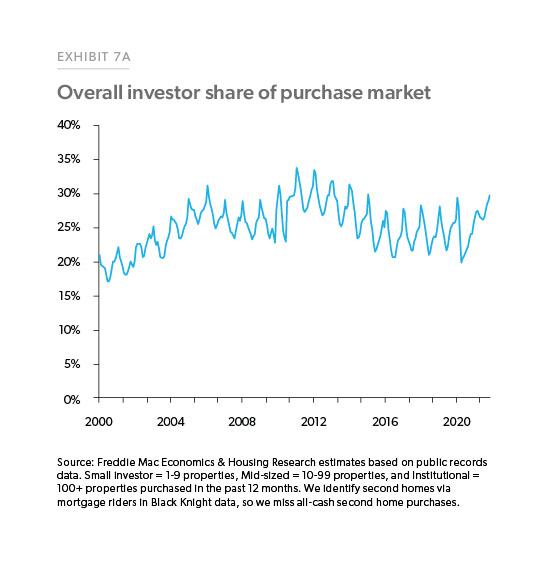
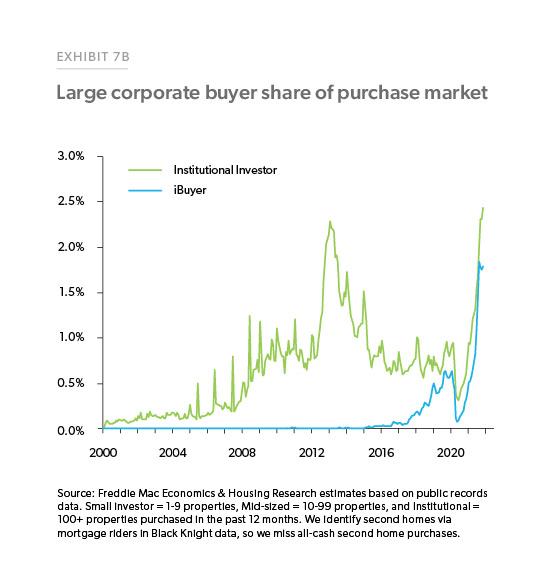
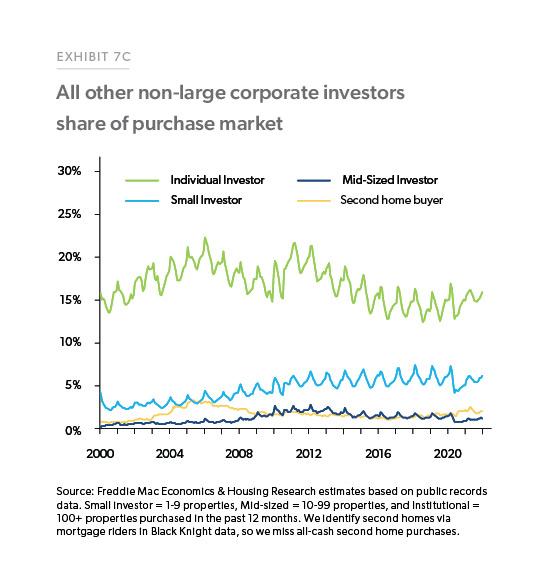
To better understand trends in investor demand, we decompose investor purchases into several categories. The overall investor share, shown in Exhibit 7A, can be broken down into large corporate buyers, shown in Exhibit 7B, and more traditional small or individual investors, shown in Exhibit 7C.2 We define large corporate buyers as both large institutional investors, who typically turn homes into rentals, and iBuyers, intermediaries whose main function is providing the convenience of a quick sale to homeowners.
Interestingly, the investor share is up only slightly. The overall investor share of home sales stands at 27.6% in December 2021, which is only slightly higher than 26.7% in 2019. While the overall percentage has risen marginally, most of the increase was from large and visible institutional investors. Still, large corporate investors—iBuyers and institutional investors— have only been about 4% of the market since 2021. Even that overstates their impact since iBuyers put homes back on the market—and therefore are not decreasing the supply of homes available for purchase like investors that create rental units.3 All other investor segments account for 24% of the market, and their share has been mostly flat since 2000. While large corporate investors are rapidly rising as a share of the market and are likely to expand, they remain so small that their market share only has a modest impact on the overall percentage of investors. Another consideration is that institutional and small investors both heavily target under-market-value homes that need more repair than what most first-time homebuyers are willing to invest. Half of institutional investor purchases in 2020 were priced below the lower quartile price paid by first-time homebuyers4. While the market grew more competitive the following year, two out of five institutional investor purchases in 2021 were still priced below the lower quartile price paid by first-time homebuyers. Furthermore, first-time homebuyers faced even less competition from small investors; three out of five small investor purchases in 2020 and 2021 were priced below the lower quartile price paid by first-time homebuyers.
In short, overall investor share of home purchases has risen only marginally since before the pandemic, and most investor purchases were for deeply discounted homes priced below the typical home bought by first-time homebuyers. Although investors are certainly contributing to the affordable housing shortage, they are not the driver of the tight supply of homes available for purchase.
Migration South and West is redistributing home price growth to interior markets
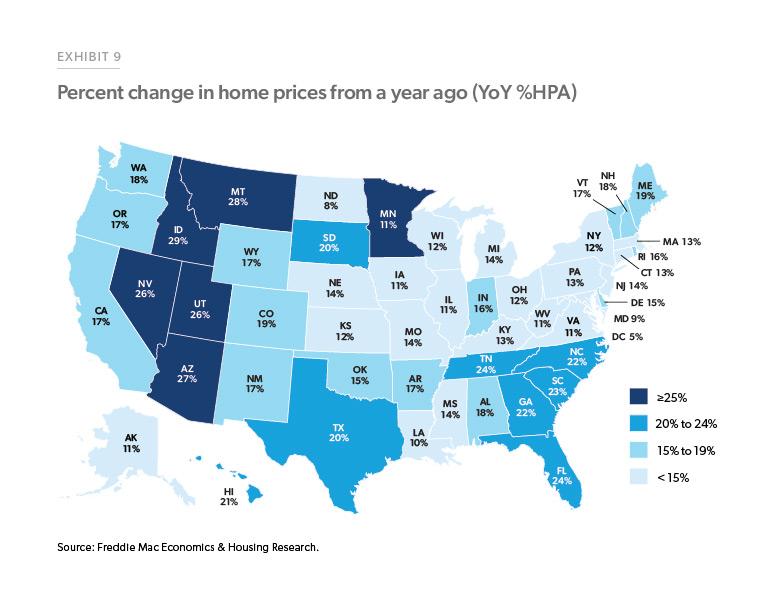
The pandemic accelerated the pace of the migration out of large cities that has been occurring over the last two decades, as shown in Exhibit 8. As of February of 2022, migration out of the largest 25 cities remains three times higher than the rate pre-pandemic. The most significant increase in migration has been to midsized metro areas with populations between 500,000 to 1 million, followed by smaller midsized metros and smaller metro areas. Most migrants moved into small and midsized towns in the South and the Mountain West, leading to a significant increase in home prices in those locations, as shown in Exhibit 9.
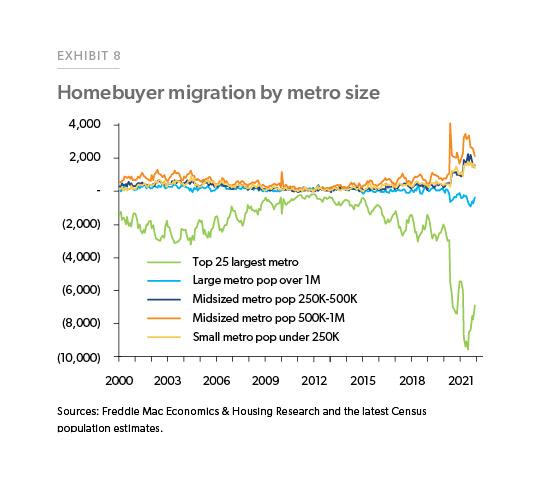
Expanding work-from-home options accelerated a long-standing migration towards more affordable locations, many with attractive weather or natural amenities. We believe this trend will continue.
Remote workers and retirees moving to more affordable areas (relative to where they are coming from) should keep home price growth in these areas stable, since many of the new arrivals have the means to afford the now higher home prices in the areas to which they are moving.
What happens next?
Now that we have a clearer understanding of the key drivers of recent home price growth, we can use this as a framework to think about what may be in store for the housing market. Unfortunately, the old adage still applies: making predictions is hard, particularly about the future. That is because anything can happen, as the war in Ukraine reminds us. But, we humbly offer the following thoughts on where these key housing market drivers may be headed.
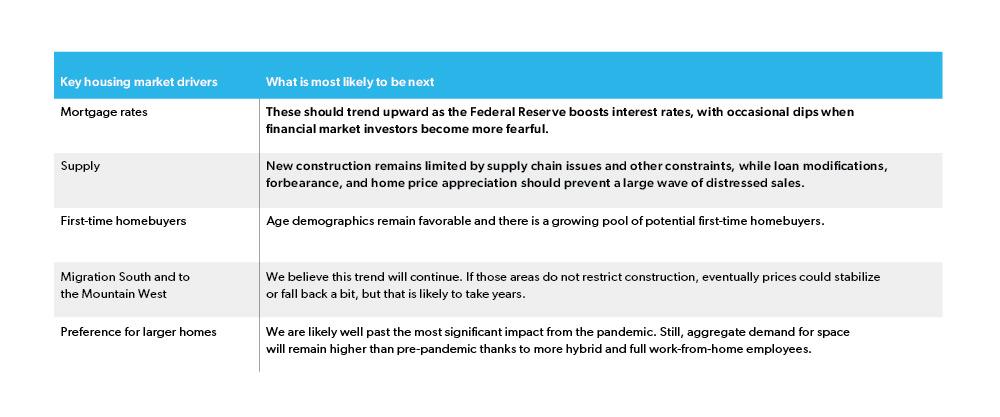
The future path of mortgage rates remains the largest wildcard. Thus, we turn to it in more detail next.
The effect of increasing mortgage rates
Last but not least, we turn to the critical question of estimating the impact of rising rates on home prices. Our own regression analysis suggests that a 1% increase in mortgage rates results in a little over four percentage points lower home price growth (for example, moving from 11% home price growth a year to 7%). In comparison, J.P. Morgan analysts estimate a more significant impact of roughly six percentage points lower home price growth.5 The housing market may be more sensitive now to higher rates than in the past since home prices have gotten so high, so the larger estimate seems reasonable.
Next, we look at past rising rate episodes more closely. Exhibits 10A and 10B show how much home price growth changed during each of the seven times since 1990 when mortgage rates rose by more than 1%. When rates rose, there typically was an initial bump in home price growth as potential homebuyers scrambled to move forward their plans before interest rates increased further. The declines from the mid-2000s forward indicate a clear break from prior home price trends during rising mortgage rate environments. During the 1990s and early 2000s, rate increases did not appear to significantly impact home prices, probably because ARMs were far more common back then. However, during the 2000s, rising rates had a significant effect on home prices, leading to an average deceleration of about six percentage points per 1% increase in mortgage rates.
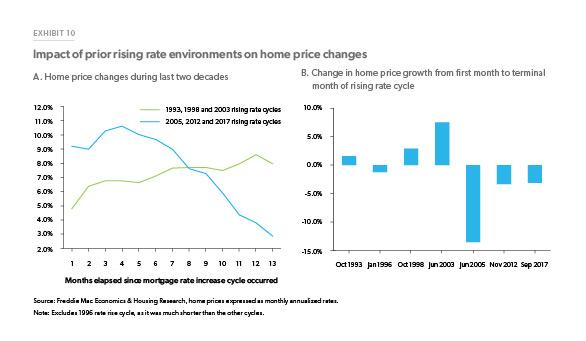
History shows a wide range of scenarios that could occur as interest rates increase. Our analysis of previous rising rate environments found that home sales generally only fell modestly—by roughly 5%, as rates increased—and that was only with a 5+ month lag, after an initial bump. While it is intuitive that higher rates cool demand by worsening affordability, the actual history is a far more nebulous guide to what will happen because there’s also a large offsetting effect—interest rates typically increase when the economy is strengthening.
Conclusion
As many aspects of the economy were still reeling from the worst health and economic crisis in a generation, the housing market demonstrated unprecedented strength and resilience. In addition to the dynamics of the pandemic itself, this strength was driven by increased demand precipitated by record low mortgage rates, a growing number of first-time homebuyers, and increased domestic migration.
Favorable demographics suggest that strong first-time homebuyer demand can continue.
Mortgage rates are now ascending and our estimate is that for every one percentage point increase in rates, home sales will slow by roughly 5% and price growth will slow by 4 to 6 percentage points, after an initial bump as buyers scramble to lock in rates before they rise further. If mortgage rates stabilize near today’s rates, all else equal, this estimate suggests far slower, yet positive home price growth with a wide geographic range based on migration patterns.
While higher rates are concerning, other key drivers are likely to remain benign. The housing market remains underbuilt and increased migration to lower-cost areas—often with warm climates or natural amenities—is expected to continue as work-from-home gets more entranced. This matters since most booming areas already have a severe housing shortage due to a prior influx of new residents.
Finally, favorable demographics suggest that strong first-time homebuyer demand can continue. That is because there is still a significant number of younger renters who have enough income to support homeownership and they should remain a potent force for the foreseeable future.
As the overall economy faces multiple headwinds in the months and years ahead, these factors should remain a significant driver of the housing market.
Footnotes
- We estimated a shortfall of 2.5 million units in 2018 which increased to 3.8 million units in 2020. (Housing Supply: A Growing Deficit – Freddie Mac; The Major Challenge of Inadequate U.S. Housing Supply – Freddie Mac)
- Analysis of investor share using public records can vary greatly depending on the definition and methodology used to identify investor purchases. While some reports define an investor as any business entity (e.g., LLC, LP, Corp.), Freddie Mac researchers acknowledge that individuals comprise the largest number of investor purchases and therefore are included in the overall investor share.
- Initial analysis of early 2022 county recorder data show IBuyer share of purchases has fallen to 1%.
- First-time homebuyer price quartiles were calculated using Freddie Mac funding data on loans originated from 2020 to 2021.
- JP Morgan Home Price Monitor, December 2021.
Prepared by the Economic & Housing Research group
Sam Khater, Chief Economist
Ralph DeFranco, Macro Housing Economics Senior Director