The Drivers of Financial Stress and Sustainable Homeownership
A year after John and April purchased their home, they realized that after paying credit card bills, auto loans, utilities, and their mortgage payments, by the end of the month they were frequently short of money. Also, because of unanticipated maintenance and home repairs, their credit card debt was building and they started to miss some payment deadlines. It was time to make a hard decision. They resolved to sell their home and return to renting an apartment.
Introduction
This analysis explores the drivers of financial stress among first-time homebuyers. Identifying the factors leading to household financial stress is important to understanding what makes homeownership sustainable. Homeownership is sustainable when a household has the financial capacity to continue owning its home over time. Conversely, homeownership is unsustainable when a household cannot manage the financial responsibilities of owning a home. This analysis considers financial stress to be a necessary condition for unsustainable homeownership. It explores the drivers of financial stress after first-time homebuyers have bought a home. Identifying the factors leading to household financial stress is important because the benefits of homeownership accrue only through sufficiently sustained ownership.
Key Findings
This analysis considers financial stress to be a necessary condition for unsustainable homeownership.
Examining declines in credit scores over a reasonable period can provide insights into which borrowers are more likely to experience financial stress.
A logistic regression model shows that the single most important predictor of future financial stress is the debt–to-income ratio (DTI) at the time a home loan is originated.
Financial education and counseling could most effectively be targeted at borrowers with elevated likelihoods of experiencing financial stress.
In this context, the analysis captures financial stress through declines in credit scores. Such declines frequently reflect late or missed loan payments and high rates of credit utilization. Examining declines in credit scores over a reasonable period can provide insights into which borrowers experience financial stress. A decline of 60 points or more in the credit scores of first-time homeowners is used as a proxy for financial stress.
A logistic regression model shows that the single most important predictor of future financial stress is the debt–to-income ratio (DTI) at the time a home loan is originated.
Across first-time homebuyers, the average path of credit scores initially declines after they buy a home and then increases over time. There are a few reasons why a borrower’s credit score declines immediately after a home purchase, including credit inquiries associated with obtaining a mortgage, increased credit card balances, and new credit lines opened to buy items such as furniture and appliances. The magnitude of this initial decline is larger for borrowers who take out mortgages backed by the Federal Housing Administration (FHA) or Veterans Administration (VA) and borrowers with high DTIs. After an initial drop in credit scores proximate to the home purchase, average credit scores tend to increase for borrowers, with an average increase in score of about 15 points after five years. With this average in mind, a borrower whose credit score declines by 60 points or more signals a large deviation from this typical path.
Different types of debt have differing impacts on the likelihood of financial stress, whether mortgage debt or non-mortgage debt. Credit card and other non-mortgage debt on the household balance sheet at origination have particularly strong impacts on the likelihood of financial stress. Surprisingly, however, student debt is associated with lower rates of financial stress, possibly reflecting the higher earnings growth potential and higher levels of financial knowledge for more educated borrowers.1 The results of this study suggest that financial education and counseling could most effectively be targeted at borrowers who are more likely to experience financial stress.
Related literature
The literature examining the sustainability of homeownership is limited. Caplin, Cororaton, and Tracy (2015) argue that homeownership sustainability should be measured at the borrower level and that sustainability measures based on mortgage-level data can overstate sustainability because they do not capture the default performance of subsequent mortgages. However, it is challenging to implement their notion of homeownership sustainability because it requires a history of individual borrower tenure choices and credit performance through borrower lifetimes. Haurin and Rosenthal (2004) examine the sustainability of homeownership as measured by the duration of homeownership spells, tracking individuals for two decades and using National Longitudinal Survey of Youth data. They show that the duration of homeownership episodes is shorter for minorities, and these differences are mostly due to differences in the socioeconomic attributes of individuals. Turner and Smith (2009) study exits from homeownership and identify financial stress, proxied by loss of employment, as a necessary condition for a mortgage to be unsustainable. Lee and Tracy (2018) define sustainability based on a categorization of home buyers using the New York Federal Reserve Bank’s Consumer Credit Panel. They define the sustainable group as borrowers who pay off their first-time mortgage, move, and remain homeowners, while the unsustainable groups include borrowers who default or transition to being renters. Note that this last category includes households that voluntarily downsize and become renters as a lifestyle choice rather than because of limited financial capacity. There is also literature in public health examining the impacts of financial stress on health outcomes, including Kahn and Pearlin (2006), Sweeta et al. (2013), Turunen and Hiilamo (2014), and Sturgeon et al. (2016).
This analysis uses mortgage and borrower credit information from the National Mortgage Database (NMDB). The NMDB is a nationally representative 5% sample of closed-end, first-lien residential mortgages in the United States.2 The data used from the NMDB cover mortgages originated from January 2013 to December 2019, and purchased by government-sponsored enterprises (GSEs)—that is, Freddie Mac and Fannie Mae—or guaranteed by the FHA/VA. The analysis is restricted to GSE and FHA/VA loans because for other market segments, data are limited for variables key to this analysis such as DTI. Including these segments would require either high rates of data imputation or high rates of dropped observations, which could potentially bias the regression results. As is standard in the literature on the sustainability of homeownership, this research is restricted to first-time homebuyers. We also limited the analysis to one-unit properties.3 In this analysis, a first-time home buyer is defined as a borrower who has no prior home purchase in the credit bureau data over a look-back period of seven years.4 The sample is limited to owner-occupied properties because the sustainability of households owning their first home is the subject of interest. The sample also eliminates cases where the origination loan-to-value (LTV) ratio exceeds 97 because these loans generally represent non- standard loan products.
A decline in credit score of 60 points or more is used as an indicator of financial stress.
For each borrower in the sample, the VantageScore® credit score is captured starting at origination and then quarterly through the third quarter of 2021. The final data set is comprised of 488,268 first-time homebuyers and includes information on loan origination characteristics and credit information. This sample uses the borrower-level sampling weights provided by NMDB. A decline in a borrower’s credit score of 60 points or more is used as the baseline indicator of financial stress, where the decline is measured as the difference between the credit score at the time a loan is terminated and the credit score at the time a loan is originated. For loans that are still active at the end of the sample period, the change is measured using the last available credit score minus the credit score at origination. For the VantageScore®, a 40-point reduction in a consumer’s score indicates a doubling of the probability that the consumer will default.5 Thus, a 60-point drop in credit score will approximately triple the expected likelihood of default.
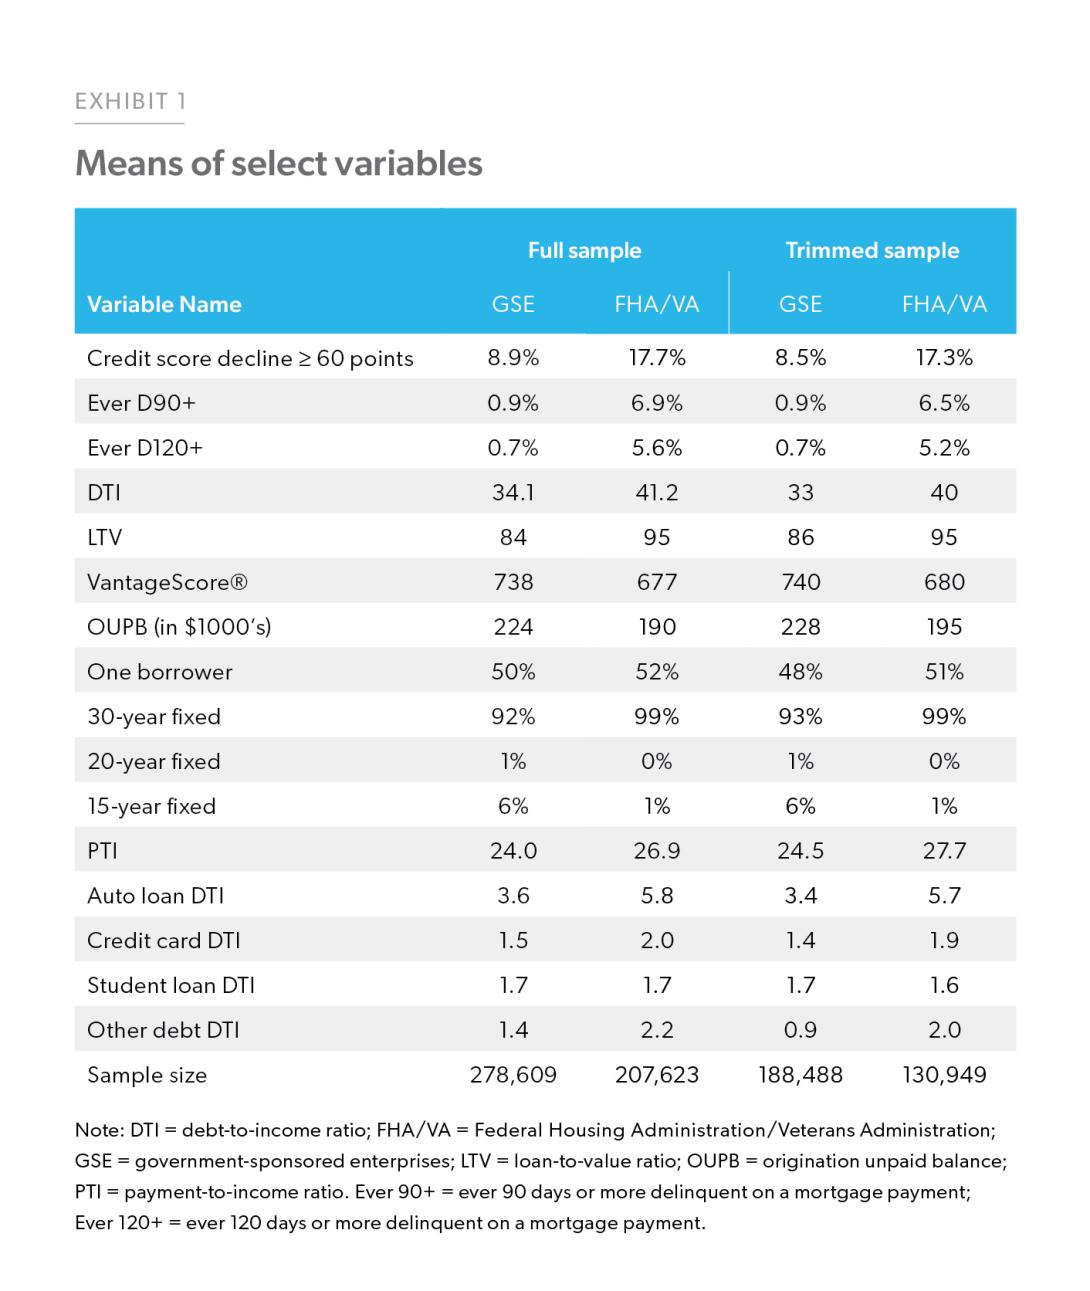
Several variables are included to capture the debt levels of the borrowers. Using the data in NMDB on mortgage payments as well as monthly payments for auto loans, student loans, credit cards, and other debt allows DTI to be decomposed into mortgage and non-mortgage components. For the mortgage-related component, the NMDB provides information on the payment-to-income ratio (PTI), which is defined as the first monthly mortgage payment divided by the monthly income. The non- mortgage components are calculated as the monthly payment at the end of the quarter when the mortgage was originated divided by the monthly household income.6 For this analysis, the sample is restricted to observations in which the sum of the components of DTI is within 5 points of the origination DTI. This screen is imposed because the NMDB does not have full coverage of the non-mortgage DTI components and these components are approximated using the information at the quarter of origination and are not necessary the precise amount at the date the loan is originated. This restriction ensures that the major debt components of origination DTI are largely included in the data and that observations with substantial missing debt payments, unreasonably large or small non-mortgage payments or income levels are excluded.7 These additional restrictions lower the sample size from 486,232 to 319,437 observations. This trimmed sample is used to analyze the differential impacts of different components of DTI.
Exhibit 1 displays summary statistics for these data by funding source. Focusing on the full sample, for GSE mortgages, 8.9% of the borrowers in the sample experience a credit score decline of 60 points or more, and this doubles to 17.7% for FHA/VA borrowers. The FHA/ VA borrowers also experience a higher incidence of ever being 90 days or more (ever D90+) and 120 days or more (ever D120+) delinquent on their mortgages. As expected, FHA/VA borrowers on average have higher DTI ratios, higher LTV ratios, lower origination unpaid balance (OUPB), and lower credit scores. Most of the borrowers in the sample have 30-year fixed rate loans. As for the components of DTI, the average payment-to-income ratio (PTI) for FHA/VA borrowers is 26.9, slightly higher than 24.0 for GSE borrowers. The FHA/VA borrowers also have higher ratio of auto loan DTI, credit card DTI, and other debt DTI. The average student loan DTI is the same for the two groups. The average statistics of the trimmed sample are very similar to the full sample, thus increasing confidence in using the trimmed sample for the component DTI analysis.
Analysis
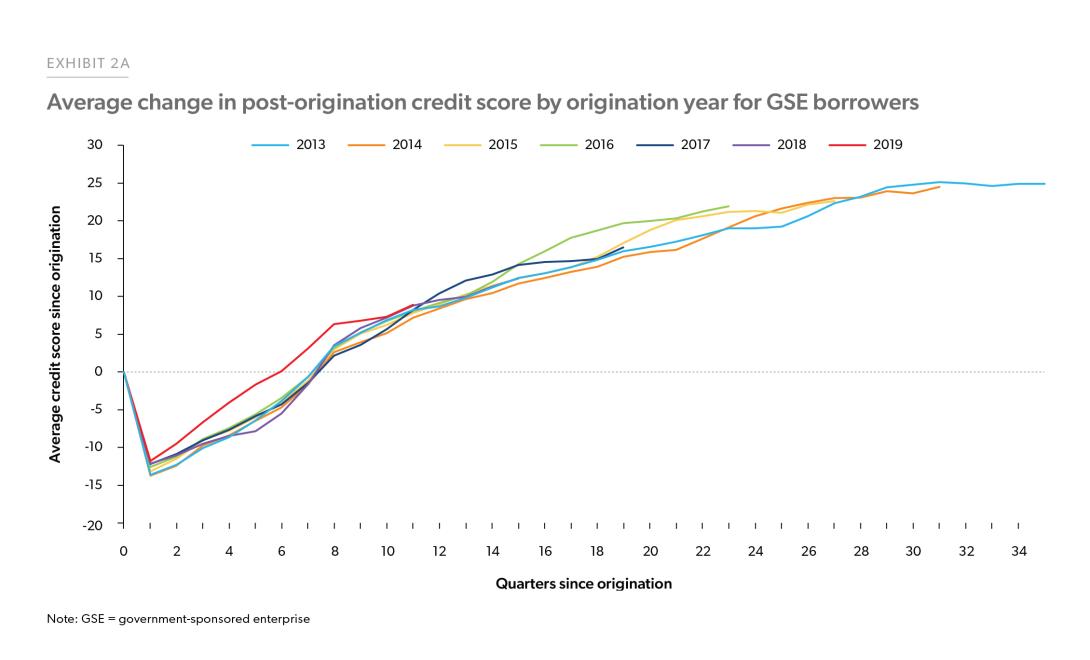
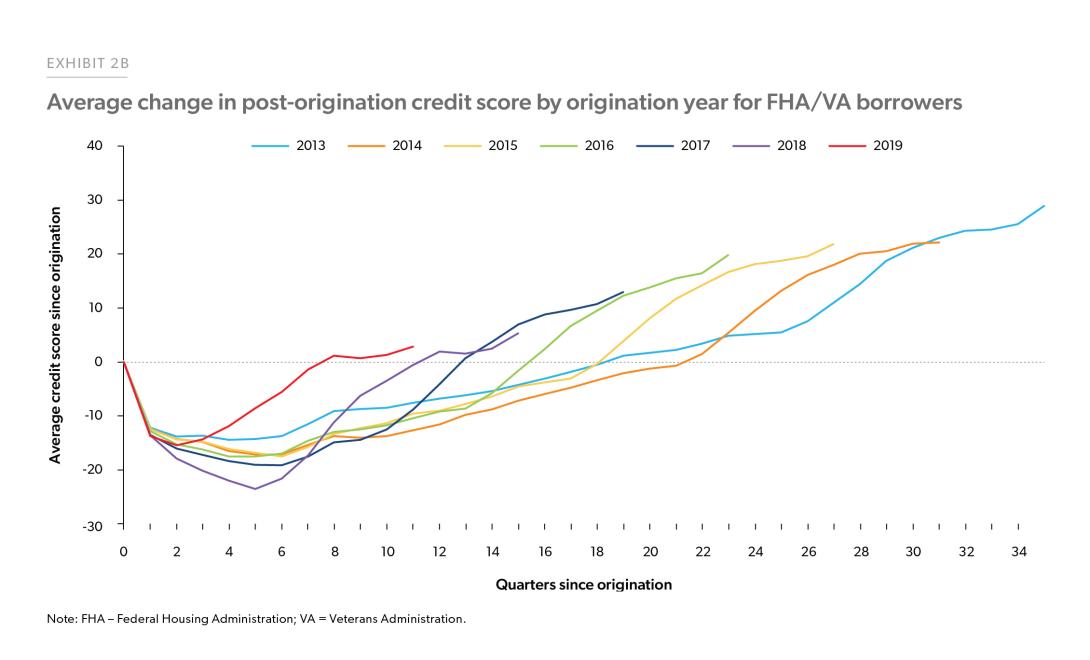
One indicator of the sustainability of homeownership would be the change in a household’s ability to manage credit after purchasing a house. First-time homebuyers who are paying their bills regularly should see their credit scores rise over time. Exhibits 2a and 2b show the average change in credit score for borrowers starting at loan origination for GSE- and FHA/VA-backed mortgages. For each loan age (in quarters), the credit score in that quarter minus the credit score at origination is calculated, and then is averaged over all borrowers for each origination year. Averaging the credit score path over many first- time homebuyers removes any idiosyncratic individual variation. The analysis shows that credit scores initially drop and then trend upward. On average, the credit scores of GSE borrowers decline 13 points but recover after about 7 quarters to the score at origination. After 5 years from origination, their scores increase by about 20 points. Scores for FHA/VA borrowers decline more deeply initially, by 15 to 25 points, and take longer (between 7 and 22 quarters) to return to their origination credit score. After 5 years, FHA/VA borrowers average a score increase of 5 to 20 points, depending on the origination year. Also, across different origination cohorts, the average credit scores of FHA/VA borrowers improve at a faster rate around the first quarter of 2020, whereas the credit scores for GSE borrowers do not exhibit such a change.
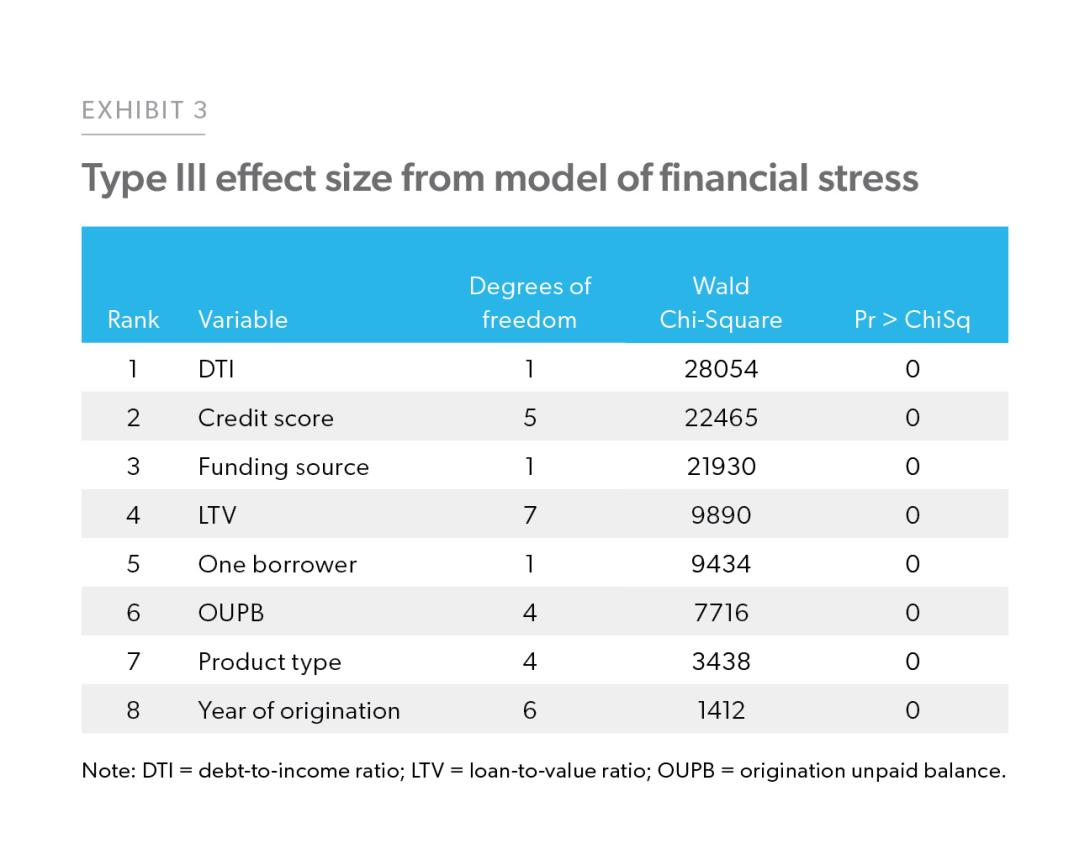
Examining material declines in credit scores can help provide insights into which households are deviating from the average score path and experiencing financial stress. A logistic model predicting a decline of 60 points or more in credit score is estimated with control variables including DTI, LTV, VantageScore®, OUPB, funding sources, indicator for a single borrower (“one borrower”), product type, and origination year fixed effects. As an indicator of the relative importance of the explanatory variables, Exhibit 3 reports the Type III effect sizes from this model.8 The Type III effect size is based on a chi-square test statistic for the significance of each explanatory variable. The chi-square test statistics and associated p-values shown in the last two columns indicate that each of the eight variables in the model significantly improve the model fit. DTI is the largest driver of the likelihood of a material decline in credit score, followed by origination credit score, funding sources, LTV, numbers of borrowers, OUPB, product type, and year of origination. This contrasts with a default model (ever D90+) fit to this sample, in which DTI appears only as a secondary predictor.9
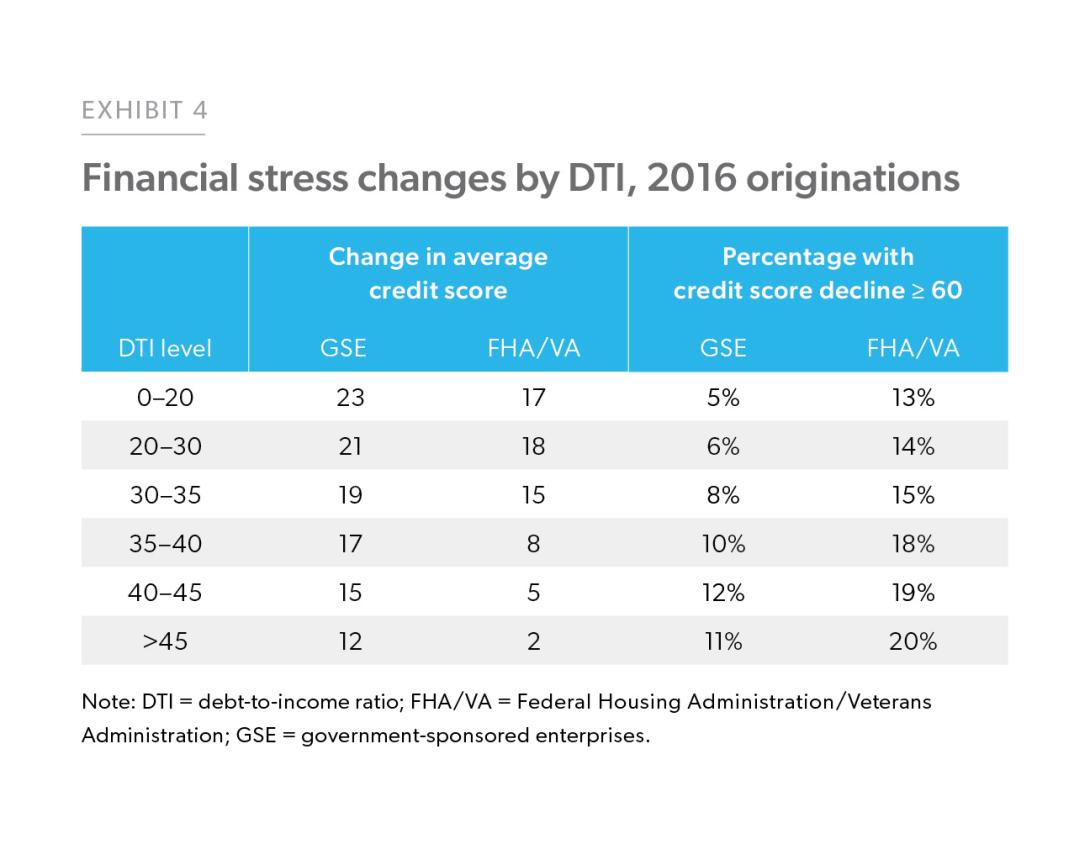
Next, we delve more deeply into the relationship between DTI and credit score declines by examining the incidence of material declines in credit scores as well as the average change in credit scores. Using loans originated in 2016, the first two columns of Exhibit 4 show the average credit score change from origination by each DTI category. The 2016 origination year was chosen because it provides a five-year window of credit score performance for these borrowers. The first two columns show that, on average, all DTI groups experience credit score increases. However, for FHA/VA borrowers with DTI greater than 45, this increase is modest (only 2 points). The last two columns show the percentage of borrowers whose credit scores declined by 60 points or more. For GSE borrowers, the incidence more than doubles from 5% for the lowest DTI group to 11% for the highest DTI group. For FHA/VA borrowers, the percentage is almost double, from 13% to 20%. This simple univariate analysis confirms the relationship between high DTI and a higher probability of a material decline in the credit score.
To provide additional insight on how the average borrower’s credit score trajectory depends on DTI, Exhibit 5 plots the average post-origination credit score path stratified by DTI category for 2016 originations. For each loan age (in quarters), the credit score in that quarter minus the origination credit score is calculated, and then averaged over all borrowers in each DTI category.
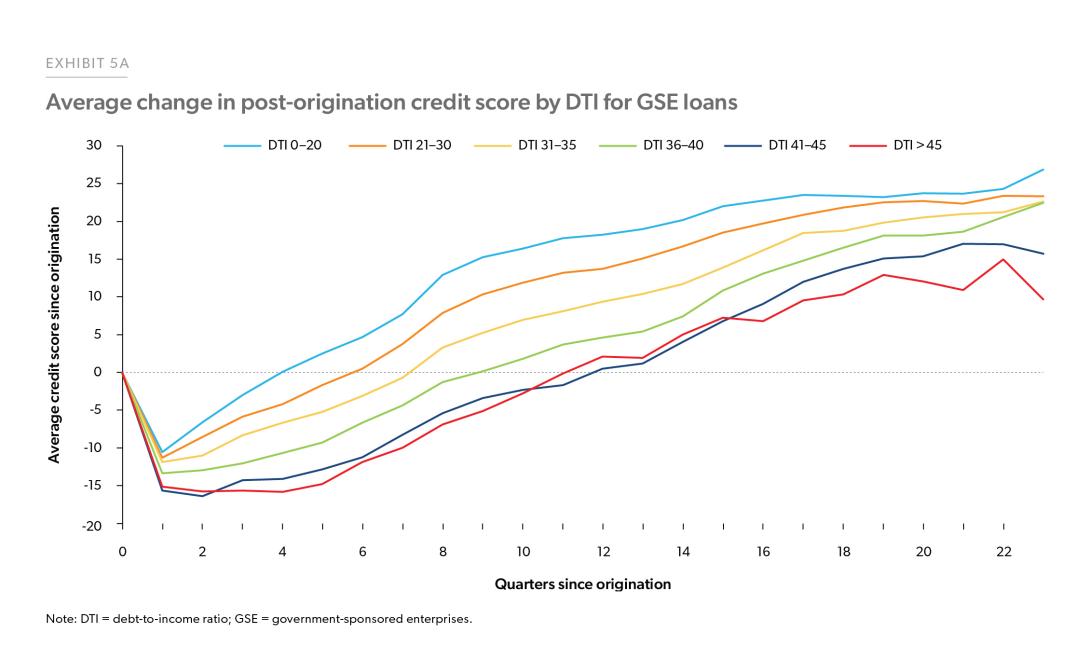
Exhibit 5a focuses on borrowers with GSE loans. For all DTI groups, the average credit score initially declines about 10 points to 15 points, with higher DTI categories experiencing larger initial declines. Subsequently, the average credit score increases for all DTI groups at roughly the same pace, but it takes longer for higher DTI groups to recover from their larger initial drop. For the lowest DTI group, on average it takes 4 quarters for the credit score to recover to the origination level, while for highest DTI group, it takes more than 10 quarters to recover.
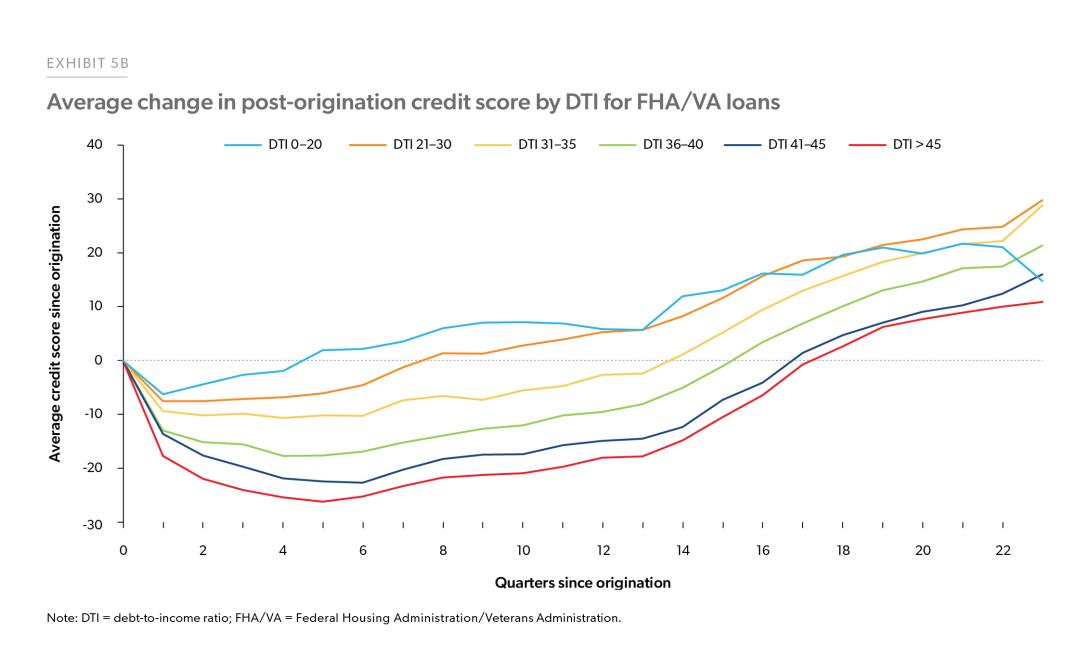
Exhibit 5b focuses on borrowers with FHA/VA loans. As with GSE loans, average credit scores initially decline, but for FHA/VA borrowers the duration of the decline is longer (up to 6 quarters), and the drop is deeper for the highest DTI category. On average, it takes the FHA/VA loans with DTIs between 21–30 more than 5 quarters for credit scores to recover to the origination level, compared to 18 quarters for the loans with the highest DTI.
Since DTI is a crucial predictor of financial stress, the analysis examines the impacts of its mortgage and non-mortgage components: the mortgage payment-to-income (PTI) ratio, auto loans DTI, student loans DTI, credit cards DTI, and other debt DTI. The trimmed sample is used for this exercise: that is, only those observations in which the sum of the components of DTI is within 5 points of the origination DTI are used. This is done to exclude loans with various data inconsistencies, including substantial missing debt payments or unreasonably large or small non-mortgage payments or income levels.
A logistic model of financial stress is fit on the trimmed sample, where the dependent variable indicates a drop of 60 points or more in credit score and the control variables include PTI, non-mortgage DTIs, LTV, Vantage Score®, OUPB, funding sources, an indicator for a single borrower (“one borrower”), product type, and origination year fixed effects.
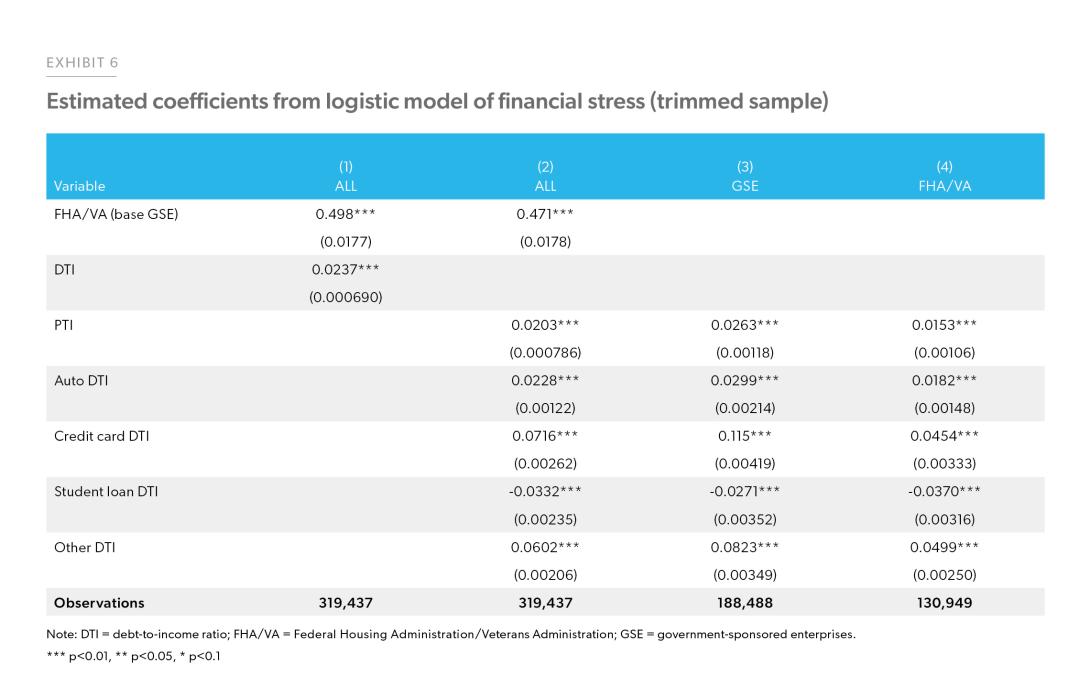
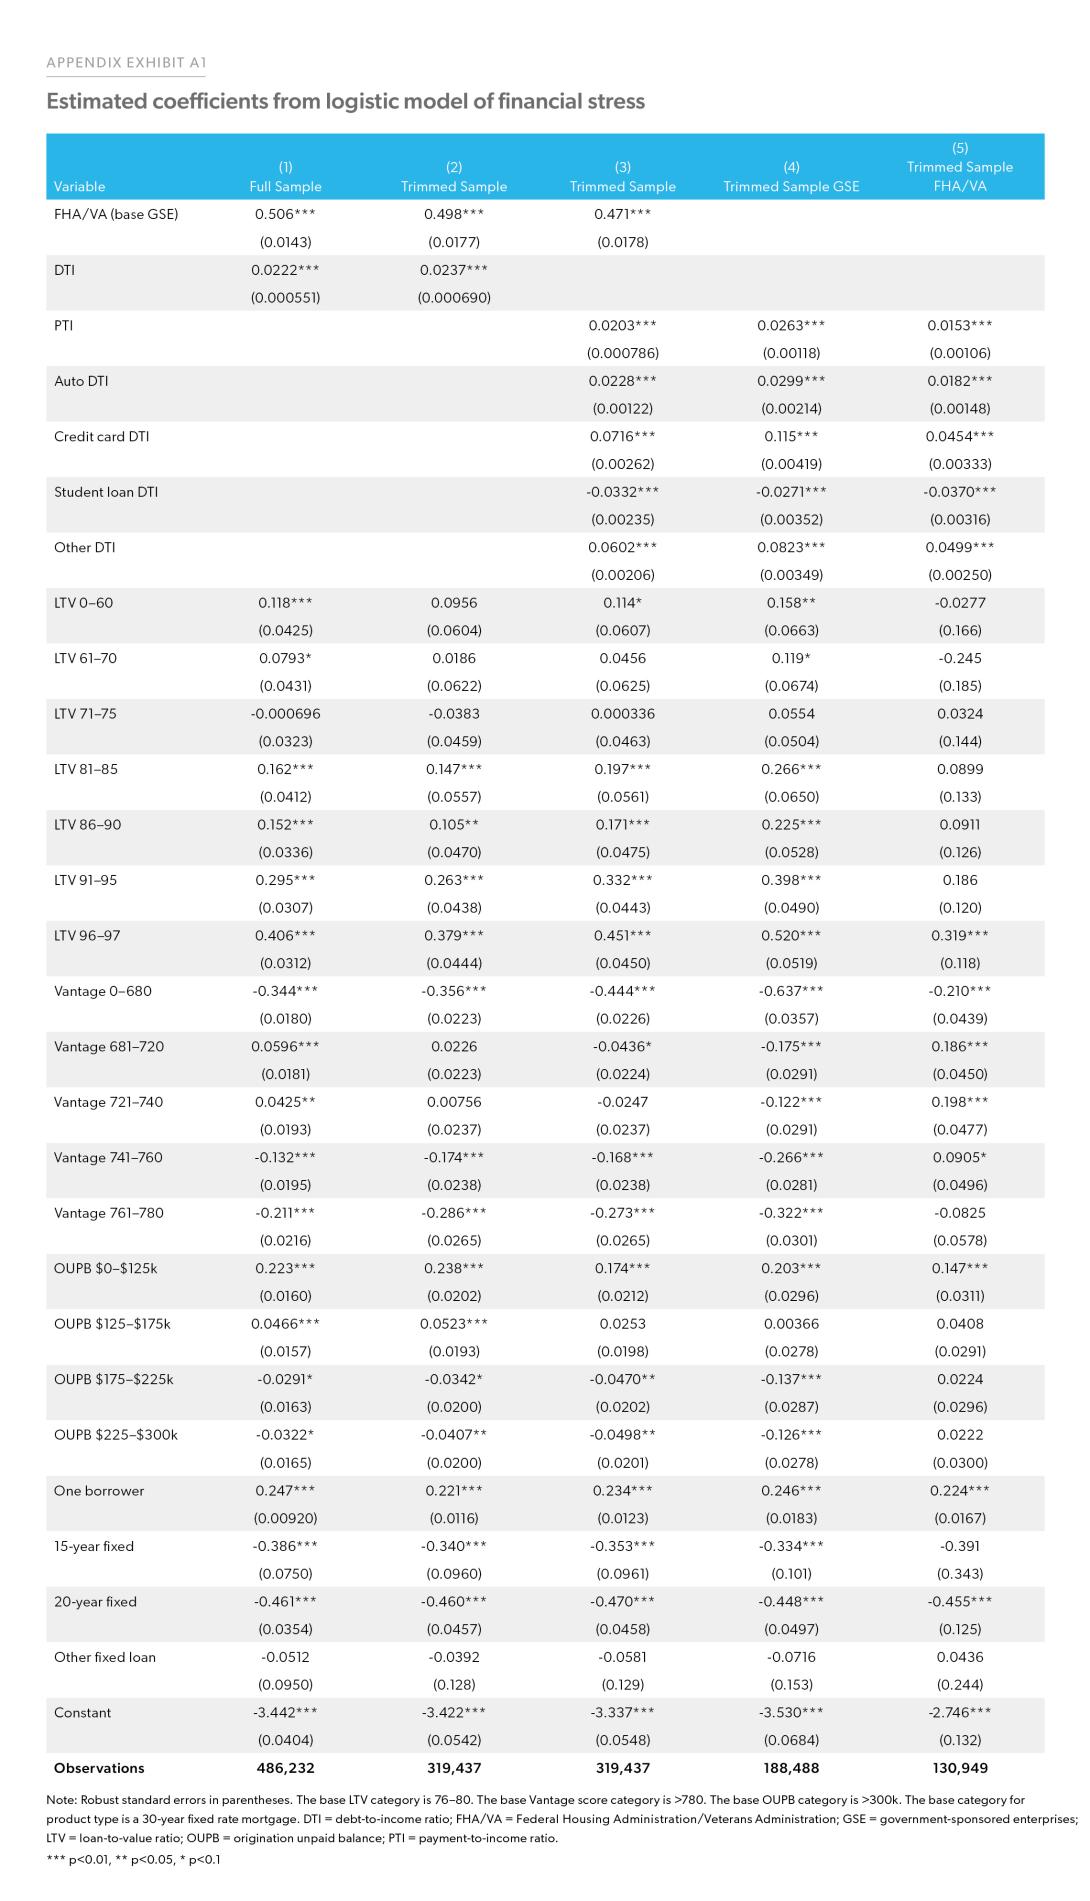
Exhibit 6 presents select coefficients for the logistic regression results using the trimmed sample.10 Column (1) shows the regression coefficients when the origination DTI is used. Controlling for other factors, the FHA/VA coefficient of 0.498 in Column (1) shows that these FHA/VA borrowers have a materially higher likelihood of experiencing financial distress after origination. Columns (2) through (4) use the components of DTI as control variables. The comparative impact of the components of DTI is shown through the size and sign of the coefficients. Column (2) shows that PTI and auto DTI components have similar impacts to the DTI on the likelihood of financial distress, reflected in similar coefficient sizes. Specifically, the DTI coefficient of 0.0237 in Column (1) is of a similar magnitude to the PTI and auto DTI coefficients in Column (2) at 0.0203 and 0.0228, respectively. In contrast, the credit card DTI coefficient in Column (2) is more than three times larger, at 0.0716, indicating that credit card debt is much more likely to lead to financial stress. Student loan debt DTI has a negative coefficient at -0.0332, indicating that this form of debt is negatively correlated with financial stress. This negative correlation between student debt and mortgage default could be explained by higher earnings growth, higher levels of financial knowledge, or other factors that lead to both higher student debt and lower rates of financial stress.11 Column (3) and (4) report results separately for GSE and FHA/VA borrowers. Except for student debt, the debt-related DTI coefficients are larger for GSE borrowers than for FHA/VA borrowers, suggesting that mortgage and non-mortgage debt have a larger impact on financial stress among GSE borrowers. Credit card and other debt DTI are particularly potent predictors of financial stress for GSE borrowers.
Conclusion
The benefits of homeownership are only realized to the extent that homeownership is sufficiently sustained. Financial stress, as measured by a decline of 60 or more points in the credit scores of home loan borrowers, is an important precursor to the unsustainability of homeownership.
Financial stress is an important precursor to the unsustainability of homeownership.
DTI is found to be the single most important predictor of a material credit score decline for first- time homebuyers financing their home with a GSE- or FHA/VA-backed mortgage. A high DTI level is associated with a higher probability that homebuyers will experience a material decline in their credit score. Among the constituent components, credit card and other debt are highly predictive of future financial stress, followed by second-lien, mortgage debt, and auto debt. Student loan debt, on the contrary, reduces the probability of financial stress.
This modeling of the financial stress of first-time homebuyers can be useful in several ways. First, communicating the likelihood of financial stress at origination could help inform the household’s decision as to whether to buy a home. Households with elevated likelihoods of financial stress might choose a less expensive option or delay homeownership. After origination, borrowers with these elevated likelihoods of experiencing financial stress could consider seeking financial education and counseling through borrower help centers and/or HUD-approved housing counseling agencies.
References
Caplin, A., A. Cororaton., and J. Tracy. 2015. “Is the FHA Creating Sustainable Homeownership?" Real Estate Economics 43 (4): 957–92.
Card, D. 1999. “The Causal Effect of Schooling on Earnings,” Handbook of Labor Economics, Vol 3, Chapter 30, edited by O. Ashenfelter and D. Card. Amsterdam: North Holland.
Haurin, D. R., and S. S. Rosenthal. 2004. “The Sustainability of Homeownership: Factors Affecting the Duration of Homeownership and Rental Spells.” U.S. Department of Housing and Urban Development, Washington, DC. https://www.huduser.gov/portal/publications/affhsg/homeownsustainability.html.
Kahn, J. R., and L. I. Pearlin. 2006. “Financial Strain over the Life Course and Health among Older Adults.” Journal of Health and Social Behavior 47 (1): 17–31.
Lee, D., and J. Tracy. 2018. “Long-term Outcomes of FHA First-time Homebuyers.” Federal Reserve Bank of New York Economic Policy Review 24 (3): 146–55.
Lusardi, A., and O. S. Mitchell. 2014. “The Economic Importance of Financial Literacy: Theory and Evidence.” Journal of Economic Literature 52 (1): 5–44.
Lusardi, A., O. S. Mitchell., and V. Curto. 2012. “Financial Sophistication in the Older Population.” National Bureau of Economic Research. Retrieved from https://www.nber.org/papers/w17863.pdf.
Sturgeon, J. A., A. Arewasikporn, M. A. Okun, M. C. Davis, A. D. Ong., and A. J. Zautra. 2016. “The Psychosocial Context of Financial Stress: Implications for Inflammation and Psychological Health.” Psychosomatic Medicine 78 (2): 134–43.
Sweeta, E., A. Nandib, E. Adamc., and T. McDaded. 2013. “The High Price of Debt: Household Financial Debt and Its Impact on Mental and Physical Health.” Social Science & Medicine 91: 94–100.
Turner, T. M., and M. T. Smith. 2009. “Exits from Homeownership: The Effects of Race, Ethnicity, and Income.” Journal of Regional Science 49 (1): 1–32.
Turunen, E., and H. Hiilamo. 2014. “Health Effects of Indebtedness: A Systematic Review.” BMC Public Health 14 (1): 489.
U.S. Bureau of Labor Statistics. 2022 “Education Pays, 2021.” Career Outlook. Retrieved from https://www.bls.gov/careeroutlook/2022/data-on-display/education-pays.htm.
VantageScore. 2016. “Consumer Credit Score Migration: Will the Consumer I Approve Today Still Be Credit-worthy Tomorrow?” https://origin.pymnts.com/wp-content/uploads/2016/04/VantageScore-white-paper.pdf.
Appendix
Appendix Exhibit A1 reports the full set of estimated coefficients from the logistic model of financial stress. Column (1) reports the coefficients using the full sample. As expected, higher DTI loans are associated with a higher probability of experiencing a drop in credit score of 60 or more points. For example, a 1% increase in the DTI level increases the log odds of experiencing financial stress by 0.022. Other factors associated with financial distress are loans funded by FHA or VA; a VantageScore® between 680 and 740; LTVs greater than 80 or below 75; low OUPBs; one borrower; and a product type other than a 30-year fixed-rate mortgage. The negative coefficient on the lowest VantageScore® category is counterintuitive but may be reflective of regression to the mean in credit scores. Columns (2) to (5) provide the full coefficients for Exhibit 6.
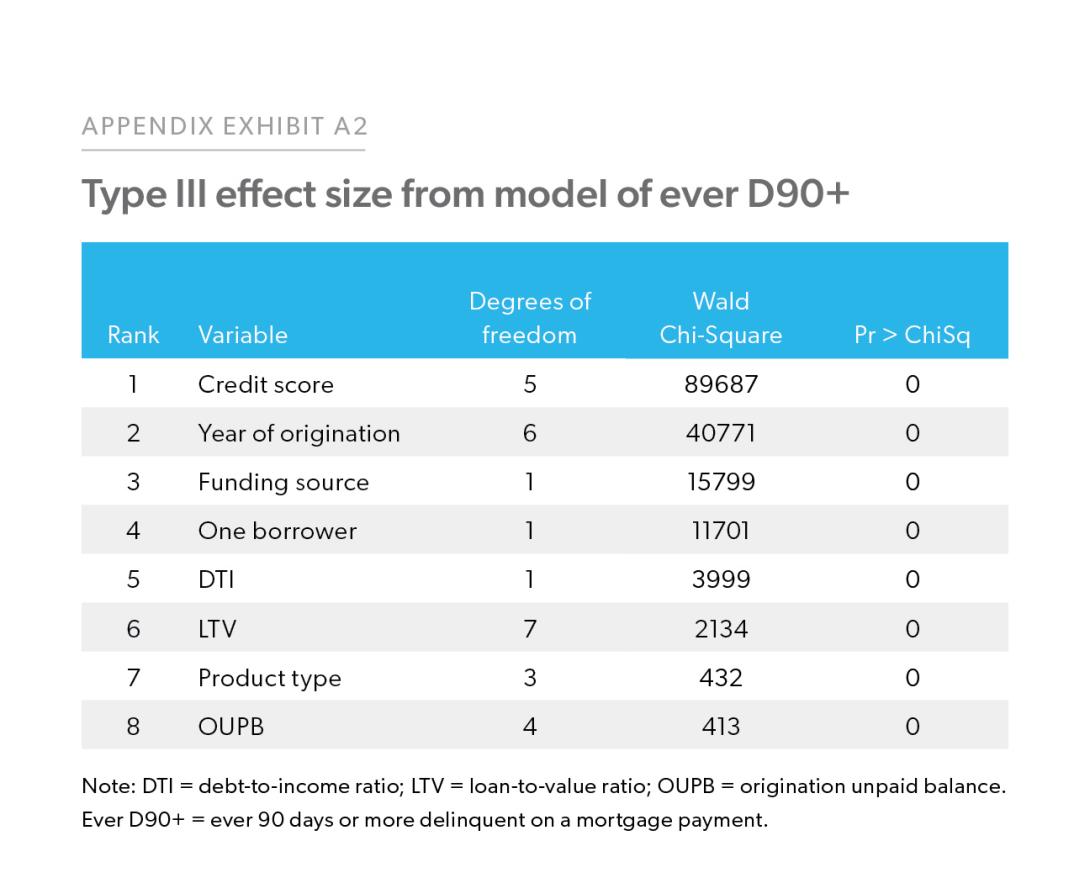
Appendix Exhibit A2 illustrates the Type III effect size for the default model, which has the same explanatory variables as the financial stress model, and the dependent variable is whether the borrower ever has missed a payment for 90 days or more. The Type III effects show that the most important predictor is the credit score at origination, followed by the origination year, the funding source (whether the loan is backed by a GSE or FHA/VA), the number of borrowers, DTI, LTV, product type, and OUPB. Unlike the financial stress model, DTI is not a top predictor for the ever D90+ event.
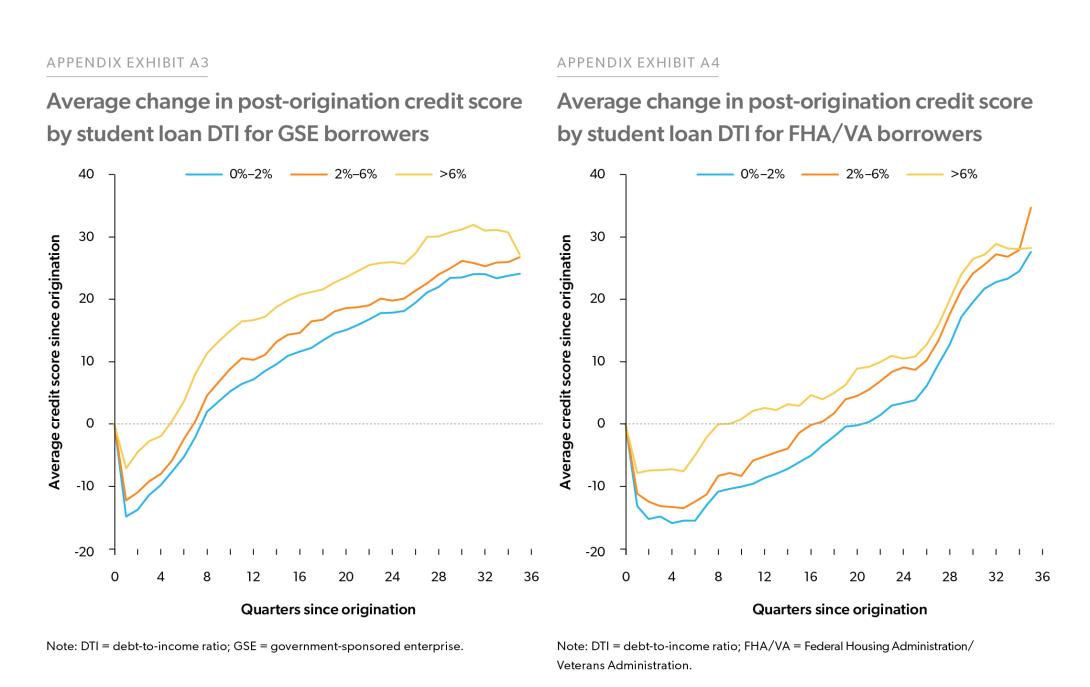
Appendix Exhibit A3 shows the average post-origination credit score path stratified by student loan DTI category for 2013 originations. The student loan DTI is categorized into 0%–2%, 2%–6%, and more than 6%, representing roughly 75%, 15%, and 10% of the total sample size for 2013 mortgages borrowers, Economic & Housing Research Note | December 2022 14 respectively. Unlike other components of DTI, both GSE and FHA/VA borrowers with higher student loan DTI have smaller initial credit score declines and generally experience larger average credit score increases over time.
For GSE borrowers with student loan DTI greater than 6%, their initial credit score drop is less than 10 points, and it takes around one year for their score to recover to the origination level. In contrast, borrowers with less student loan debt have higher initial credit score declines (of around 12 to 15 points), and generally need 7 to 8 quarters for the credit score to return to the origination level. The pattern also holds for FHA and VA borrowers. One reason for the reverse trend is that borrowers with higher student loan debt would be more likely to have graduate or other professional degrees. For example, borrowers working as lawyers, dentists, and doctors can accrue substantial levels of student debt but this could be offset by their high earnings potential. This relationship between student debt and credit score increases also holds for FHA/VA borrowers, as shown in Appendix Exhibit A4.
Footnotes
- A higher education level is associated with higher levels of earning (U.S. Bureau of Labor Statistics, 2022) and causes higher income (Card, 1999). College students are more financially knowledgeable than high school students, and people with lower education and incomes tend to have low levels of financial literacy (Lusardi and Mitchell, 2014; Lusardi, Mitchell, and Curto, 2012).
- This data set is funded and managed jointly by the Federal Housing Finance Agency and the Consumer Financial Protection Bureau. A closed-end loan is a loan for which the borrower must repay the entire amount of principal and interest by a specified date. If a borrower defaults on the mortgage and the property is to be sold, a first-lien mortgage has the first claim on the collateral.
- Including observations on 2 to 4 unit properties in this analysis does not alter the paper’s results or conclusions.
- This definition of first-time home buyer is stricter that used by Freddie Mac, Fannie Mae, and FHA in that they only require a look-back period of three years.
- See the VantageScore® (2016) report at https://origin.pymnts.com/wp-content/uploads/2016/04/VantageScore-white-paper.pdf.
- For credit cards, this ratio is defined as the minimum required monthly payment divided by monthly income.
- Mortgages with second-lien debt are also excluded from the sample. The fraction of first-time homebuyers with second-lien debt is very small (less than 0.1% of the entire sample) and including this group might introduce data errors.
- For the full regression coefficients, see Appendix Exhibit A1, Column (1).
- See Appendix Exhibit A2 for the type III effect sizes for a model predicting ever D90+ using the same explanatory variables and sample.
- See Appendix Exhibit A1 for the full set of regression coefficients.
- The detailed credit score paths for GSE and FHA/VA borrowers with different levels of student loan DTI are shown in Appendix Exhibits A3 and A4.
Prepared by the Economic & Housing Research group
Kadiri Karamon, Macro & Housing Economics Senior
Liyi Liu, Macro & Housing Economics Senior
Doug McManus, Director of Financial Research