Asian American, Native Hawaiian, and Pacific Islanders Homeownership Gap
Following Asian American, Native Hawaiian, and Pacific Islander (AANHPI) Heritage Month in May, and National Homeownership month in June, this month’s Spotlight focuses on homeownership trends among AANHPI,1 which is a growing demographic with a majority in their prime homebuying age. The growing size of this group and their homeownership rate have important implications for the housing market.
Over the last twenty years, the share of AANHPIs in the total U.S. population has nearly doubled to around 7%, and is projected to be around 1/10th of the total U.S. resident population by 2060.2 From 2003 to 2023, the AANHPI population has been the second largest contributor (after Hispanics) to U.S. population growth at 24%.
Since 2013, the U.S. Census Bureau has been collecting information about Asian subgroups (those with national origin within Asia). The seven categories of Asians they use are Asian Indian, Chinese, Filipino, Japanese, Korean, Vietnamese, and Other Asian.3 Together with the Native Hawaiian and Pacific Islander (hereafter NHPI), the overall population of AANHPI increased from 17 million in 2013 to 23 million in 2023, an increase of 31% over the decade. Each of the subgroups of the AANHPI population also increased during this time as seen in Exhibit 2.
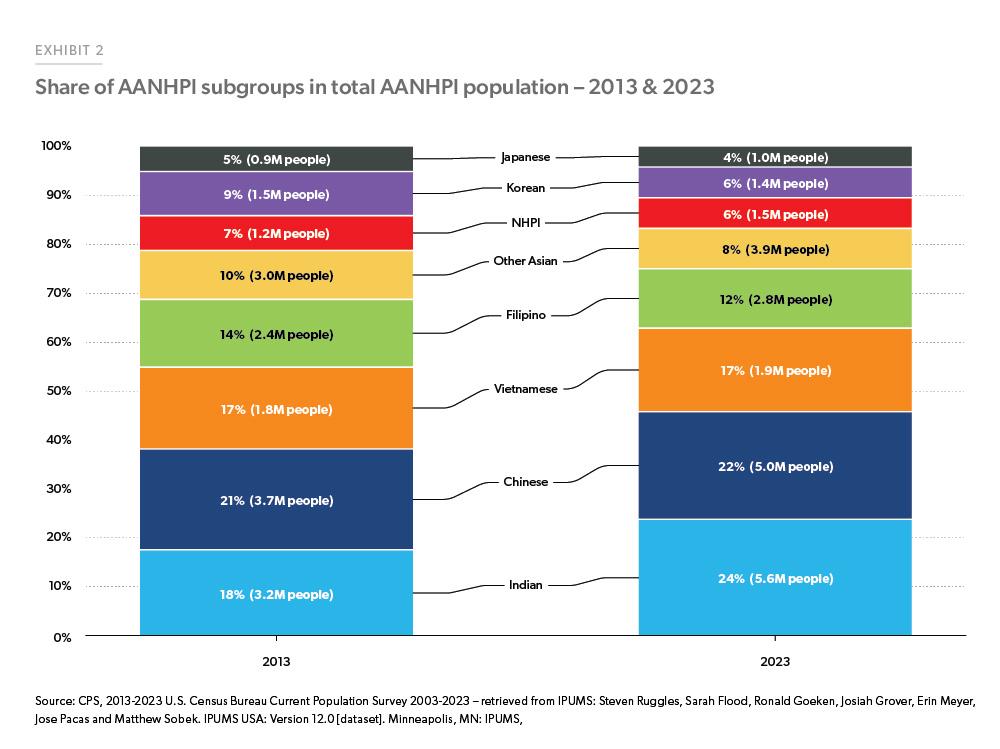
The increase in the AANHPI population has been driven mainly by Asian Indians followed by Chinese. The share of Asian Indians as of 2023 was 24% of total AANHPI followed by Chinese at 22%. While the number of NHPI population in AANHPI population has been increasing, the pace of increase has not kept up with the other sub-groups. This has meant that the share of NHPI has declined slightly over the last 10 years from 7% to 6%. While the Census Bureau identifies these subgroups in the Current Population Survey (CPS), there are 16 other groups by country of origin.4
Before we delve into the homeownership of AANHPIs, it is helpful to understand the demographic statistics of this group and how they compare to Non-Hispanic Whites (Whites). As shown in Exhibit 3, AANHPIs are younger, with a median age of 37 as compared to 43 for Whites. This group has a 3% higher marriage rate as compared to Whites. Importantly, AANHPIs have higher education levels as compared to Whites—around 45% of AANHPIs have a bachelor’s degree or higher level of education as compared to 33% of Whites. This also translates into higher incomes for AANHPI as compared to Whites.5 Also, a large share of the AANHPI population is foreign born as compared to Whites.
With respect to their headship rate (number of households divided by their population), we find that only 36% of AANHPI head a household as compared to 45% of Whites. Even in terms of the homeownership rate, AANHPI have a lower homeownership rate at 62% compared to 75% for Whites. The AANHPI population is not a monolith, and we find differences among the various subgroups. The homeownership rate of NHPI is much lower than the other subgroups at 48% followed by Other Asians at 58% and Koreans at 59%. Vietnamese and Japanese have the highest homeownership rate among these groups at 72% and 70% respectively.
Homeownership gap
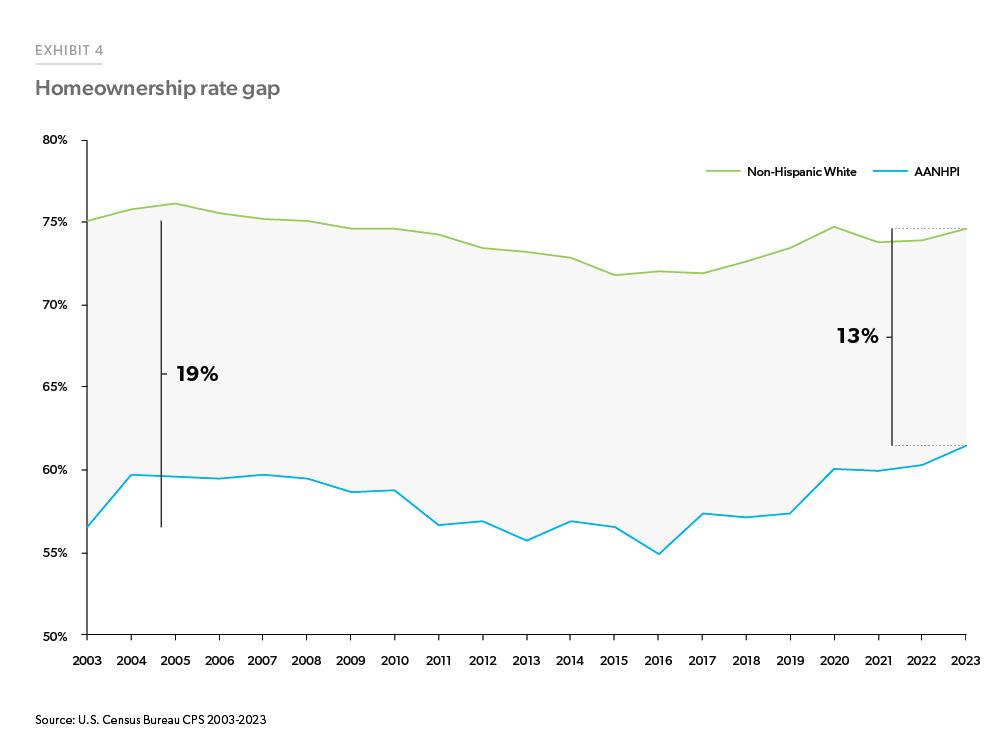
The homeownership rate of AANHPI increased from 57% in 2003 to 62% in 2023 while White homeownership has remained around 75% during the same timeframe. The homeownership gap between AANHPI and Whites has been narrowing over the years and currently stands at 13% in 2023, down from 19% in 2003 (Exhibit 4). We identified in our previous analyses factors which drive the homeownership gap for Hispanics and Young Adults. These factors range from age, education, income, immigration, housing costs and region. Age is a proxy for life stages and is a very important predictor of homeownership. As people grow older, they are more likely to get married and have children—factors that increase the likelihood of homeownership. Similarly, the higher level of education and income, the more likely they are to be homeowners.
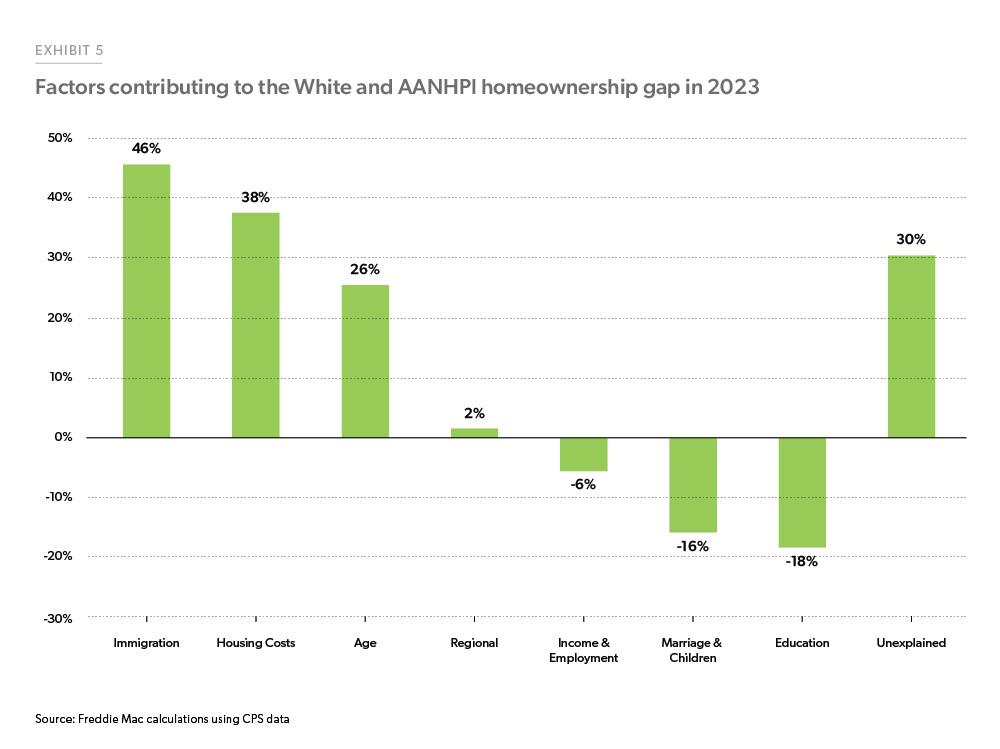
In Exhibit 5, we compare the top factors likely contributing to the homeownership gap between AANHPI and Whites as of 2023, ranked in order of importance based on a decomposition analysis.6 Overall, the factors we identified explain 70% of the total gap in homeownership between AANHPI and Whites with 30% unexplained. The most important factor contributing to the gap is immigration specific attributes (such as citizenship status, foreign born), accounting for almost 46% of the gap. The second most important factor is housing costs, which explains 38% of the gap between these two groups.7 Age also remains a factor, accounting for almost 1/4th of the gap. On the other hand, we have income and employment, education, marriage and children, which are helping to close the gap between AANHPI and Whites. There are other unobserved factors which we could not capture in our analysis such as access to credit, housing inventory, intergenerational wealth, language, and cultural barriers which also affect the homeownership decisions of individuals.
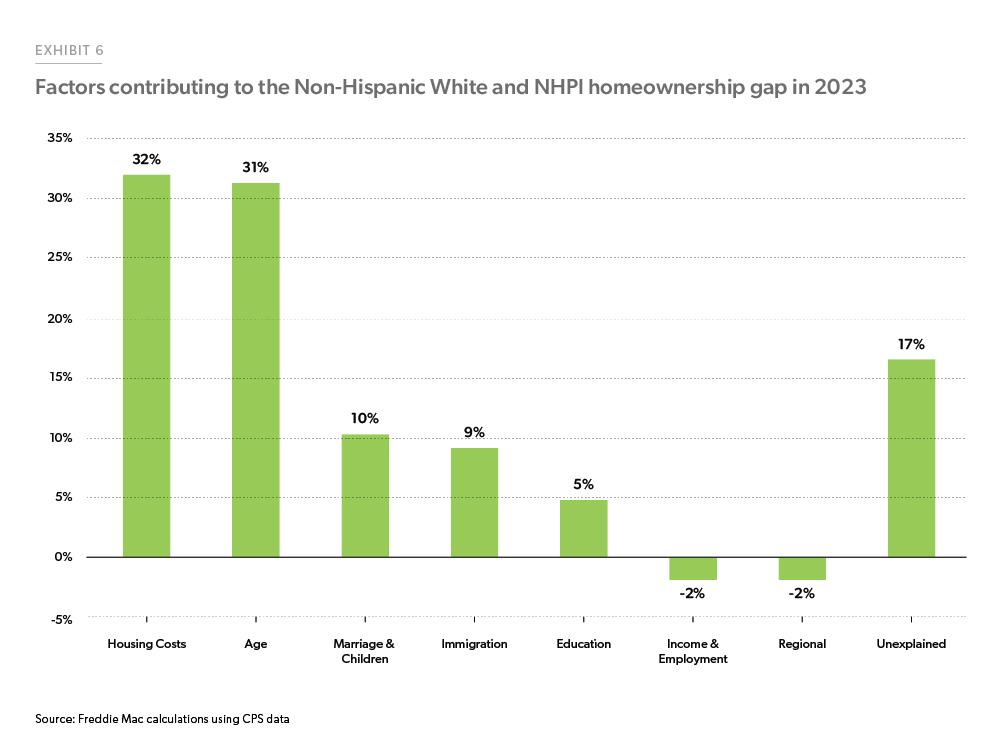
While these results hold for the entire group of AANHPI, given that they are such a diverse group, it would help us to identify factors affecting the gap by subgroups. We compare the factors affecting the homeownership gap between NHPIs, a group that has one of the lowest homeownership rates among these subgroups with Indians and Chinese, which are the largest AANHPI subgroups. For NHPI, the homeownership rate in 2023 was 48%. Examining the impact of the factors mentioned above on NHPI homeownership, we find that they explain 83% of the total gap in the homeownership rate between Whites and NHPI with only 17% unexplained (Exhibit 6). The largest hindrance to homeownership for this group is housing costs, accounting for 34% of the gap. Age as well as marriage and children together account for almost 41% of the overall gap for this group. The NHPI group is much younger than the other cohorts so as they age, get married and have children, we expect their homeownership rate to increase over time. Income and employment along with where they live have a negative contribution, indicating that these factors are helping to close the gap.
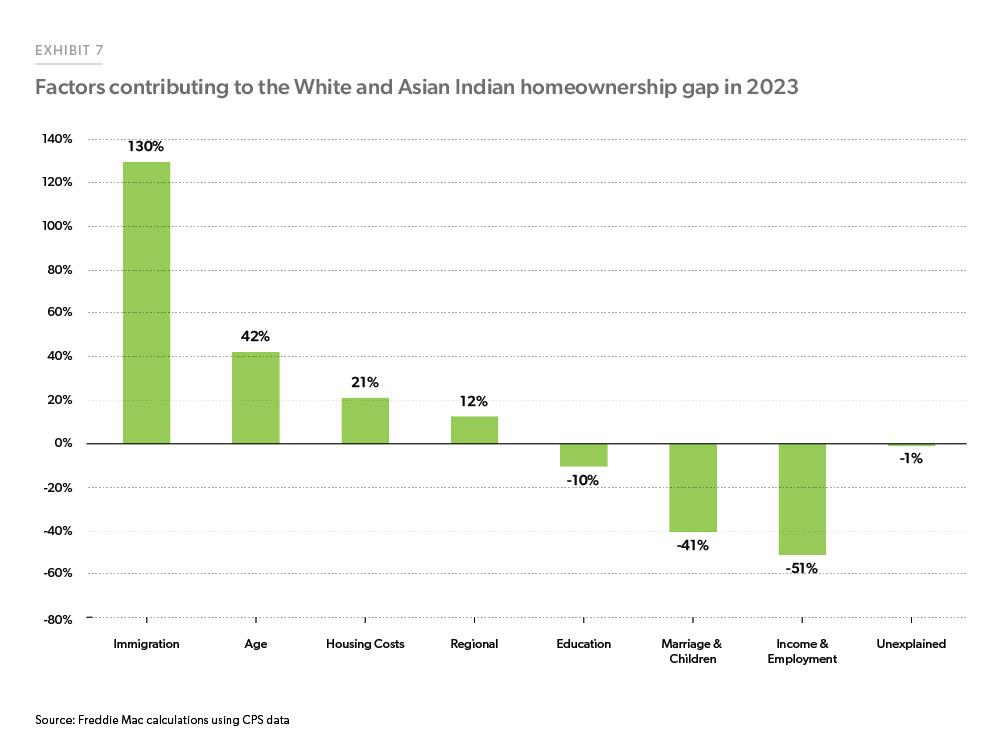
For the Asian Indian subgroup, the homeownership rate as of 2023 was 64%, around 11 percentage points below the 75% homeownership rate for Whites. Unlike the NHPI group for whom housing costs were the largest factor contributing to the gap, immigration related attributes more than explain the gap in the homeownership rate between Asian Indians and Whites (Exhibit 7). This is in part because a large share of Asian Indians immigrated to the U.S. in recent years and the uncertainty around the immigration status for some holds them back from stepping into homeownership.8 Age is the next largest factor contributing to the gap followed by housing costs. The higher level of education and income among the Asian Indians along with higher marriage rates is helping to close the gap.
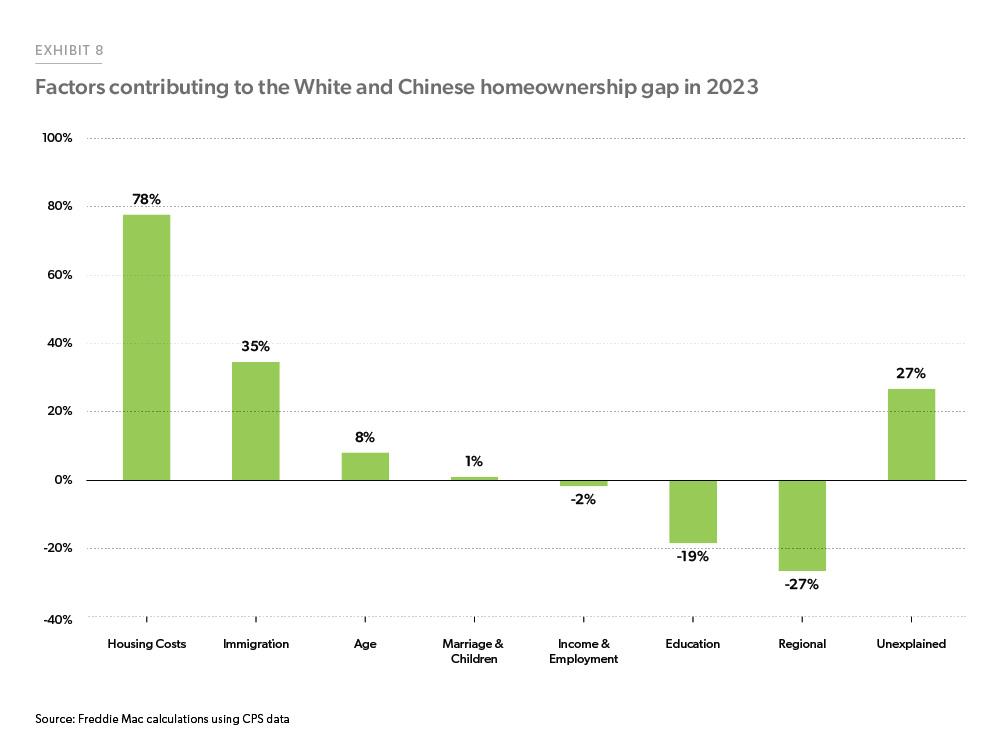
For the Chinese subgroup, the homeownership rate in 2023 was around 63%, approximately 12 percentage points below the 75% homeownership rate for Whites. Overall, the following factors account for 79% of the gap in the homeownership rate between these two groups with 21% unexplained: housing costs account for 78% of the gap, while immigration attributes explain 35%, age 8%, and marriage and children around 1%. Income, employment and education are helping to close the homeownership gap for the Chinese.
To conclude, one key takeaway is that the AANHPI community is projected to keep growing as a share of the U.S. population. Of course, the AANHPI group is not a monolith and there are differences among the various subgroups and within those subgroups. Given that overall this group is younger and in the prime home buying age, as they grow older, get married and have children, we expect their homeownership rate to increase. However, housing costs are an issue affecting the homeownership rate of AANHPI as compared to Whites. Freddie Mac can play an important role in making homeownership possible for this important part of our population. For example, CreditSmart® is a suite of educational resources designed to empower customers with the skills and knowledge to assist them at every stage of their homeownership journey. CreditSmart® is available in multiple languages, including Chinese, Vietnamese and Korean—which can help when English language proficiency is a barrier. Additionally, Freddie Mac offers HomePossible® and HomeOne®, low down payment products that are particularly helpful for first-time buyers.
Footnotes
- For this research, we focus on Asian Americans, Native Hawaiians and Pacific Islanders. As per the definition of the U.S. Census Bureau, Asians are defined as a person having origins in any of the original peoples of the Far East, Southeast Asia, or the Indian subcontinent including, for example, Cambodia, China, India, Japan, Korea, Malaysia, Pakistan, the Philippine Islands, Thailand, and Vietnam. “Native Hawaiian and Other Pacific Islander (hereafter NHPI)” refers to people having origins in any of the original peoples of Hawaii, Guam, Samoa, or other Pacific Islands. Pacific Islanders include diverse populations that differ in language and culture. They are of Polynesian, Micronesian, and Melanesian cultural backgrounds. https://www.census.gov/library/publications/2001/dec/c2kbr01-14.html#:~:text=The%20term%20%E2%80%9CNative%20Hawaiian%20 and,differ%20in%20language%20and%20culture
- https://www.census.gov/data/tables/2023/demo/popproj/2023-summary-tables.html
- Other Asians include Asians from the other Asian countries who are grouped together due to smaller sample size.
- https://www.census.gov/library/stories/2022/05/aanhpi-population-diverse-geographically-dispersed.html; https://data.census.gov/table?q==ACSDT5Y2020.B02015
- While the median income for this group is higher, we find that a high share of population from some of the Asian countries living below poverty line. For eg, around 40% of those from Afghanistan, 35% from Burma, 25% from Malaysia, are below the poverty line. The share of population below poverty line for NHPI & Chinese is at 14%, Vietnam at 9%, India at 5% and Japan at 3%. (Based on analysis of the 2023 CPS data).
- To quantify these impacts, we estimated a regression relating the probability of homeownership to factors shown in previous research to influence homeownership rates. We then applied Oaxaca-Blinder decomposition technique to determine the impacts. Details of the regression analysis and a comparison to prior research by others appear in the appendix of our previous article.
- While the incomes of the AANHPI group are higher, they are also located in the high cost regions of the country making housing costs an impediment for their homeownership.
- Approximately half of the Indians in the US immigrated after 2010 with 1/5th immigrating after the year 2020. Chinese and Japanese are the second & third largest group of AANHPI immigrants after the year 2010.
Prepared by the Economic & Housing Research group
Sam Khater, Chief Economist
Len Kiefer, Deputy Chief Economist
Ajita Atreya, Macro & Housing Economics Manager
Rama Yanamandra, Macro & Housing Economics Manager
Penka Trentcheva, Macro & Housing Economics Senior
Genaro Villa, Macro & Housing Economics Senior
Jessica Donadio, Finance Analyst