Economic, Housing and Mortgage Market Outlook – August 2023
Key observations
- U.S. economic growth remains on firm ground, with strong consumption spending and a tight labor market. MORE ON THE U.S. ECONOMY
- Although housing market activity has slowed, a demand-supply imbalance in the U.S. is causing a rebound in home prices. MORE ON THE HOUSING MARKET
Recent developments in the U.S. economy
The economy remains on firm ground, with second quarter Real Gross Domestic Product (GDP) growing at an annualized rate of 2.4%, stronger than in the first quarter (annualized growth of 2.0%), according to the U.S. Bureau of Economic Analysis. That is modestly above-trend based on long-run demographics and productivity growth. Consumer spending grew at a 1.6% annualized rate in the second quarter. While consumers remained resilient in the face of rising interest rates and high inflation, the consumer “firewall” is getting weaker compared to the first quarter when consumer spending grew at an annualized growth rate of 4.2%. Consumers remain generally upbeat (consumer confidence rose to the highest level since July 2021),1 likely reflecting the deceleration in inflation, tight labor market and the cushion they have from the excess savings accumulated during the pandemic. The pandemic recession and recovery was the first recession where consumers accumulated trillions of dollars in excess (above-trend) savings. While there are various estimates of the excess savings accumulated by consumers, most estimates suggest that total savings accumulated to be greater than $2 trillion.2
The pace of job growth is moderating with the economy adding 187,000 jobs (less than the expected increase of 200,000) in July 2023 according to the Bureau of Labor Statistics (BLS) Employment Situation. These job gains were led by health care, social assistance, financial activities, and wholesale trade. Employment in construction and financial services also increased even as rising interest rates have adversely impacted these sectors because employers are holding on to workers. The unemployment rate ticked down to 3.5% to remain close to 50-year lows. Wage growth remained solid with average hourly earnings increasing 4.4% over the past year. The slight easing in the labor market conditions is also evident in the employment cost index, a measure of the change in the cost of labor, free from the influence of employment shifts among occupations and industries. According to the BLS, compensation costs increased 1.1% over the quarter and 4.5% over the year in Q2 2023. This is a decline from the 4.9% yearly growth in the Q1 2023 and 5.1% a year ago.
Inflationary pressures have been easing; data for June suggested a further cooling to 4.1% year-over-year in the Federal Reserve’s preferred inflation measure (Core PCE, which is the U.S. Bureau of Economic Analysis’ price index for personal consumption expenditures, excluding food and energy). The overall prices on goods continued to decelerate (at 0.1% month-over-month) while prices for services increased (0.3% month-over-month). From the beginning of the pandemic, prices for goods soared with everyone working from home and shifting their spending towards home improvement, new computers and durable goods like furniture, etc. As the economy reopened, the spending increasingly shifted back towards services, including housing services which are driven by rents.
Recent developments in the U.S. housing market
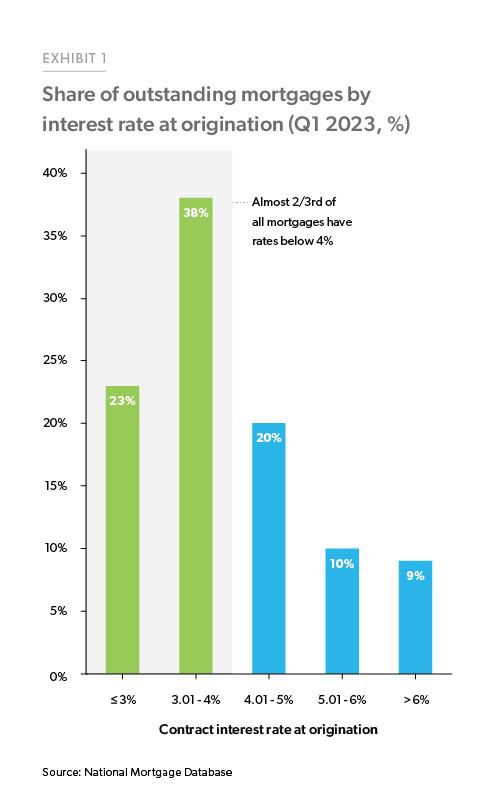
Home sales have slowed due to the 30-year fixed-rate mortgage rate staying above 6.5% since May 2023. Existing home sales declined 19% from a year ago, while new home sales were up 23.8% over the year. Monthly new home sales numbers are volatile and fell for the first time since February, down 2.5% over the month.3 And yet the market remains undersupplied given the current demand, partially due to the mortgage rate lock-in effect.4 This lock-in effect continues to dampen the number of listings of homes for sale, as almost two-thirds of all mortgages have rates below 4% (Exhibit 1). The inventory of existing homes for sale remained unchanged in June at 1.08 million units, down 13.6% from a year ago. The months’ supply of existing homes for sale inched up slightly to 3.1 months—still near historic lows. The inventory of new homes for sale increased from last month to 432,000, representing a supply of 7.4 months at the current rate. Pending home sales, a forward-looking indicator for existing home sales, increased 0.3% in June indicating that existing home sales in coming months might increase a little. However, contracts were still down 15.6% year over year.5
The NAHB/Wells Fargo Housing Market Index for builder confidence continued to improve, with the index nudging up 1 point to 56 during July. However, according to the U.S. Census Bureau, housing starts fell 8% over the month and were down 8.1% year-over-year to register the biggest drop in a year. Permits also declined over the month of June and were down 3.7% on a month-over-month basis and fell 15.3% year-over-year.
Although housing market activity has slowed, a demand-supply imbalance in the U.S. housing market has led to a rebound in home prices. Since the beginning of the year, the Freddie Mac House Price Index (FMHPI) has shown a positive house price growth after falling for seven consecutive months (on a month-over-month basis) starting in June of 2022. FMHPI increased 0.7% month-over-month in June and 1.7% year-over-year on a seasonally adjusted basis.
Recent developments in the U.S. mortgage market
Despite some moderation in inflation, the Fed raised rates at their July meeting to bring the Fed funds rate up to the 5.25-5.5% range, the highest level in 22 years. The rate hike was well anticipated and led the 30-year fixed rate mortgage, as measured by our Primary Mortgage Market Survey®, to reach a high of 6.96% during the second week of July before settling in at around 6.8%. Purchase applications declined in response to these higher rates, with total applications down 25% over the year, purchase applications down 23% and refinance applications declining almost 30% during the third week of July, according to the Mortgage Bankers Association Weekly Applications Survey.
Purchase applications declined in response to the rate hike, with total applications down 25% over the year.
Regarding mortgage performance, overall delinquency rates as well as foreclosure starts continue to remain low according to the Q2 2023 Mortgage Bankers Association’s (MBA’s) Delinquency Survey. The delinquency rate of all loans past due declined from 3.56% in Q1 2023 to 3.37% in Q2 2023. The current delinquency rate is well below the historical average of 5.16% and the pre-pandemic (2016-19) average of 4.5%. Foreclosure starts rose to 0.13% in Q2, up from 0.12% in Q1 2023. Delinquency rates for conventional loans declined from 2.44% in Q1 2023 to 2.29% in Q2 2023, while FHA loans went down from 9.27% to 8.95% over the same period. While foreclosure starts during Q2 2023 declined for conventional and FHA loans, they increased for VA loans from 0.15% to 0.27%, still below the historical average of 0.36%.
The outlook
The better-than-expected economic growth in the first half of the year signals that the U.S. economy continues to grow above-trend. However, the macroeconomic outlook is still uncertain as the Federal Reserve may continue with rate hikes through the rest of this year. Currently, there is a 60% probability that there will be no more rate hikes according to the futures markets, with a quarter of the analysts expecting the Fed to raise rates by another quarter point in the September meeting, and only 2% expecting the year to end in the 5.75-6% target range for the Fed funds rate. The economic risks are weighted to the downside until the Fed completes its tightening cycle.
General economy, rates, inflation
Consumers are the backbone of the U.S. economy and have been on a spending spree, but that is likely to moderate as consumer balance sheets shrink, partly due to moderating yet still persistent inflationary pressure and high interest rates. The economy will continue to grow if consumer spending remains undeterred. But there is a risk that if inflation remains sticky and interest rates keep rising, the labor market could weaken, and the economy will start shrinking. That said, we expect inflation to cool, although at a slower pace, and remain above the Fed’s target of 2% through next year. Putting all this together, our baseline forecast remains the same; we expect the labor market to gradually soften without a major adverse effect on the economy.
We expect the labor market to gradually soften without a major adverse effect on the economy.
Home sales
The combination of high interest rates and tight inventory due to the rate lock-in effect will keep home sales low through 2023. Our forecast is for mortgage interest rates to remain above 6% for the rest of the year, and we do not expect a lot more existing homes to come on to the market. Therefore, we expect home sales to remain muted for the rest of the year.
Home prices
Our corporate forecast for the next twelve months has house prices rising by 0.8% and an additional 0.9% over the following twelve months, consistent with our projection of a gradually softening labor market. This is more optimistic than earlier in the year mainly due to the rebound in prices after the house price declines in the second half of 2022. We believe the rebound in prices is driven by a combination of very tight supply and the large cohort of Millennial first-time homebuyers reaching prime homebuying age. It is evident that despite affordability issues, there is tremendous demographic-driven demand for houses relative to supply, which will continue to keep upward pressure on prices. We expect the labor market to gradually soften without a major adverse effect on the economy.
Mortgage originations
Mortgage origination volume depends on home sales, prices, and refinance activity. While we expect prices to remain high, we forecast sales to remain low and refinance activity to stay muted this year. Therefore, for the rest of the year we expect total mortgage originations to remain flat. We expect purchase originations to resume modest growth in 2024 as rates moderate and more existing homes hit the market to facilitate sales activity.
See the August 2023 spotlight on refinance trends.
Footnotes
- According to the US Conference Board Consumer Confidence Index.
- Some estimates of excess savings: Federal Reserve Bank of San Francisco ($2.1 trillion), Federal Reserve Board ($2.3 trillion).
- Existing home sales data come from the National Association of Realtors®, while new home sales data comes from the U.S. Census Bureau and U.S. Department of Housing and Urban Development.
- See the Spotlight in our July Outlook on how the average borrower would be giving up $55,000 in lifetime savings if they were to replace their current mortgage at today’s rates.
- According to the National Association of Realtors®.
Prepared by the Economic & Housing Research group
Sam Khater, Chief Economist
Len Kiefer, Deputy Chief Economist
Ralph DeFranco, Macro Housing Economics Senior Director
Ajita Atreya, Macro & Housing Economics Manager
Rama Yanamandra, Macro & Housing Economics Manager
Penka Trentcheva, Macro & Housing Economics Senior
Genaro Villa, Macro & Housing Economics Senior