Sea Level Rise and Impact on Home Prices in Coastal Florida
In the United States, 40% of the population resides in coastal counties.1 When homebuyers shop for a house in these areas, they may receive information about the existing risk of flooding, such as whether the home is in a FEMA-designated floodplain and whether they must pay for flood insurance.2 Beyond this existing flood risk, rising sea levels present major challenges for low-lying coastal areas, posing a significant long-term risk to coastal housing markets. In this Research Note, we assess whether primary homebuyers and residential market investors in coastal Florida consider the future risk of rising sea levels when making a home purchase decision and whether they pay less for homes they deem at risk.
Key Findings
- Homes exposed to the risk of rising seas levels are sold for less but the price discount is limited to homes also located in FEMA designated 100-year floodplains.
- Both owner-occupied and non-owner-occupied homes are discounted in homes exposed to the risk of rising seas levels that are also located in FEMA-designated 100-year floodplains.
- After Hurricane Irma in 2017, homes exposed to the risk of rising seas levels (both in and out of FEMA designated 100-year floodplain) were discounted significantly.*
*Homebuyers may pay less for homes damaged by hurricanes. Unfortunately, we do not have data on damages. However, we control for the condition of the house at the time of the purchase.
Although the magnitude and timing of sea level rise (SLR) are uncertain, forward-looking homebuyers may perceive a property susceptible to the effects of SLR as a risky asset and reduce the amount they would be willing to pay. While demand remains strong for primary and vacation homes in coastal markets, previous studies have shown that real estate valuations take into account existing flood risk, with valuations being lower for affected homes. This is especially the case in the wake of a hurricane.3 Additionally, large share of investors look for investment or rental properties in coastal areas. Their understanding of the risk of SLR and whether they incorporate it into their purchase decisions will also affect how the housing markets in coastal areas evolve over time.
In our study, we focused on residential markets in coastal Florida, because the state has been considered at high risk from the effects of climate change.
Low-lying and located in a tropical cyclone zone, Florida faces numerous climate hazards, including exposure to storm surge and tidal flooding. These existing natural disaster risks are exacerbated by future SLR risk.
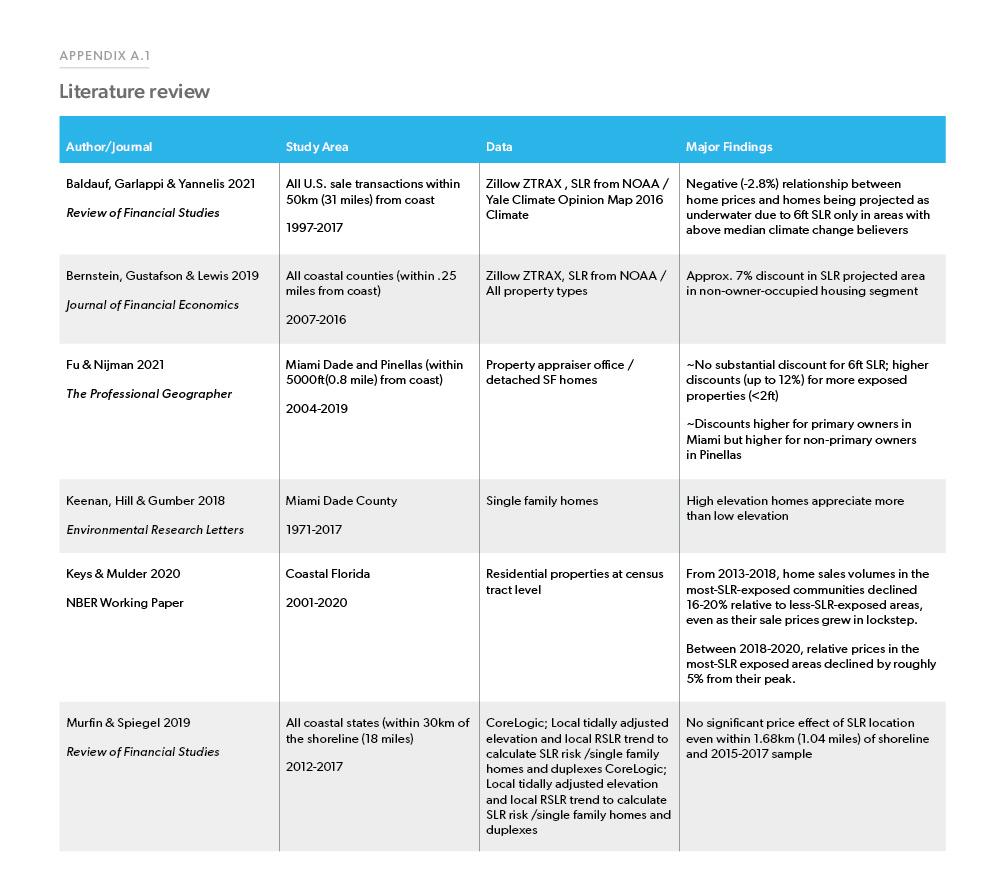
Studies that examine the impact of SLR on home prices are limited but growing (See Appendix A1). Our study supplements previous studies in three ways:
- Our study distinguished homes exposed to SLR risk (a measure of "future risk") from homes located in FEMA-designated floodplains (a measure of "existing risk").
- Our study evaluated differences in prices for homes exposed to SLR risk across various types of homebuyers.
- Our study tested the impact of the major 2017 Hurricane Irma on the prices of homes that are exposed to SLR risk in Florida.
It's important to distinguish homes in SLR exposed areas from homes that further intersect with FEMA-designated 100-year floodplains. Previous studies have shown that buyers discount home prices in floodplains to offset future flood insurance premiums. Therefore, lower prices for homes located in both SLR- exposed areas and floodplains could be driven by flood insurance costs, rather than reflecting homebuyers' understanding of future SLR risk.4 We expected that buyers who factor SLR risk into their decision-making would reduce the amount they are willing to pay for SLR-exposed homes, even if those homes are located outside of floodplains where flood insurance is not required. However, we did not find evidence of price discounts outside of floodplains.
Prices for homes exposed to SLR risk would likely vary based on buyers' awareness of SLR risk, their risk appetite, and how long they expect to own the home. For investors, they may be more sophisticated in terms of their awareness of the future SLR risk (for example, see Bernstein et al. 2019), we expected that they may pay less for SLR-exposed homes, particularly those located outside of FEMA-designated floodplains. However, we found no evidence that investors paid less for homes exposed to SLR. Furthermore, as suggested by previous studies and our Research Note on flood risk in the wake of the 2017 hurricanes, we found that home prices were discounted in SLR-exposed areas after extreme weather events, due to heightened flood risk perception. And these discounts were not limited to homes located in FEMA-designated floodplains.
Building the Data
Our analysis combines five data sources merged at the property level:
- Home sale prices and property characteristics from Public Records compiled by CoreLogic
- Sea Level Rise (SLR) projections from the National Oceanic and Atmospheric Administration (NOAA);
- Flood risk maps from FEMA using National Flood Hazard Layer (NFHL);
- Elevation Data compiled by University of Florida Geo Planner Center; and
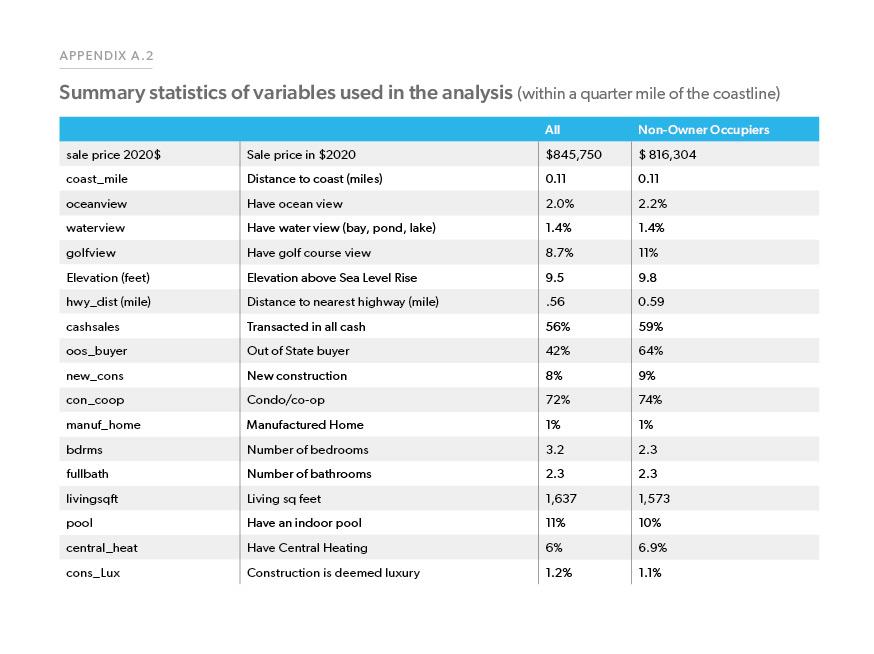
- Coastline, highways, and school district data from Census Bureau. Appendix A.2 presents summary statistics of the data.
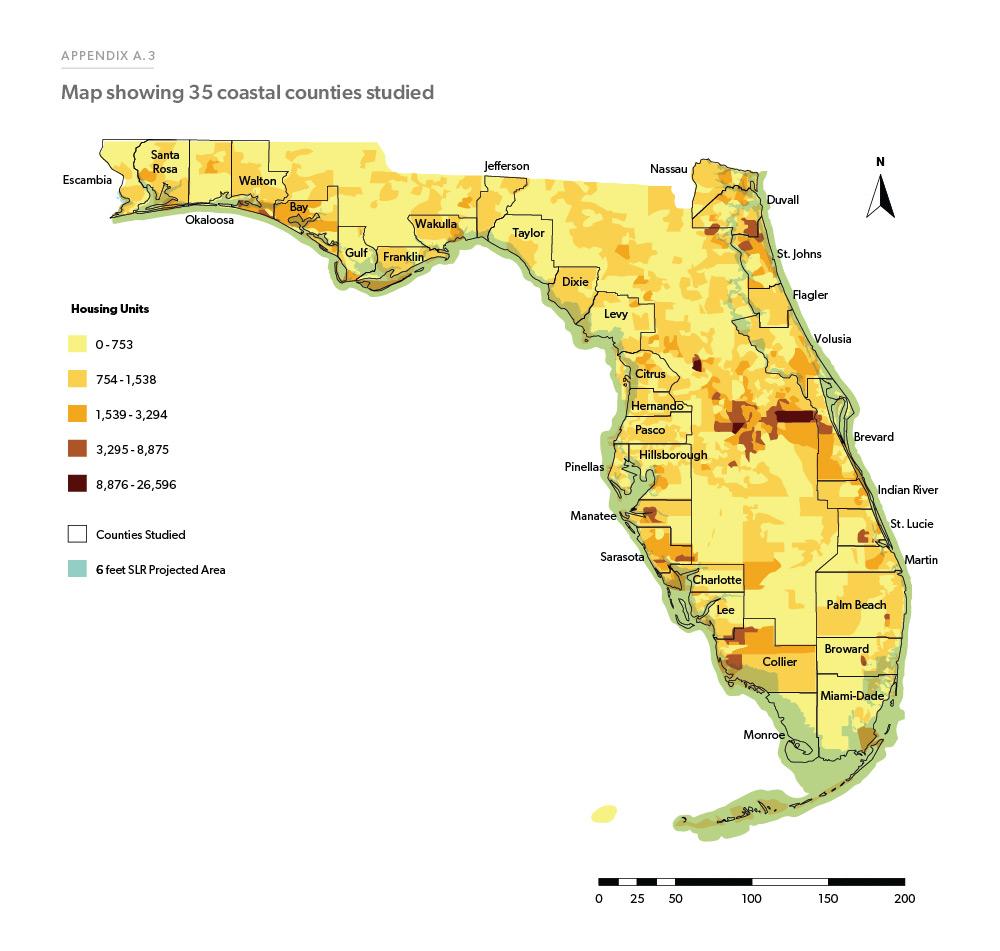
We start with almost 4.2 million single-family and condo/co-op sale transactions in 35 coastline counties in Florida (Appendix A.3) according to public records (see Exhibit 1). We include home sales from 2000 and 2020 with sale prices between $10,000 and $10 million (in inflation adjusted 2020 dollars). In addition to sale price and sale date, we consider additional information on several property characteristics, such as number of bedrooms, number of bathrooms, living area square footage, and year built. The data also includes information on buyer type which is discussed in detail below.
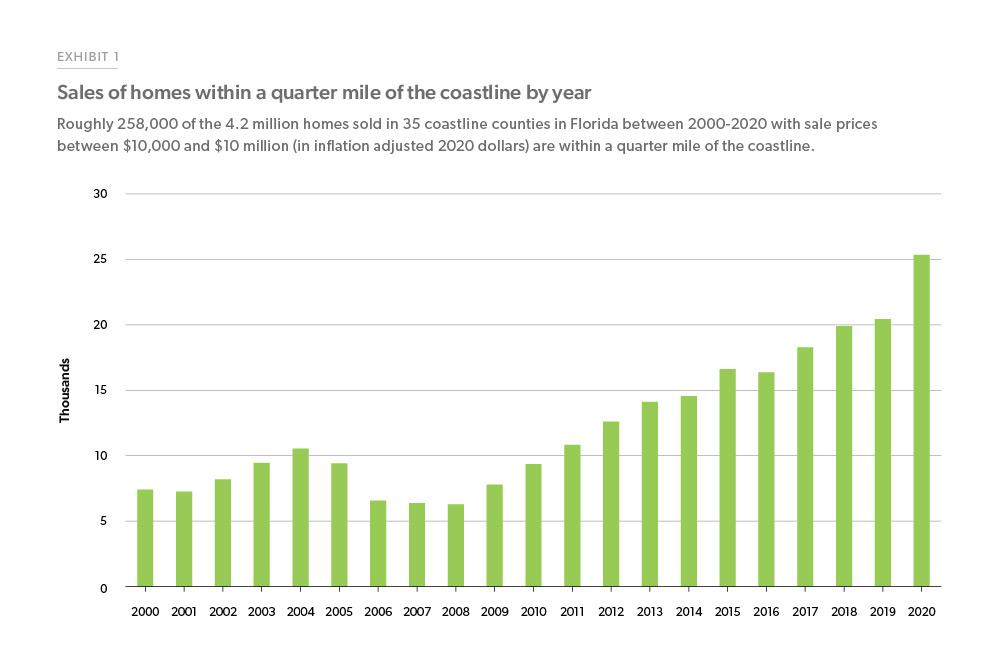
Next, for each property, we calculate the distance from the centroid of the property to the nearest coastline. We restrict our sample to transactions of properties located within a quarter mile of the coastline, since the impact of SLR decreases with increasing distance from the coastline.5 This restriction dropped our sample size to approximately 258,000 transactions. In this Note, we refer to these approximately 258,000 transactions as "sales of homes within a quarter mile of the coastline." Exhibit 1 shows the sales of homes within a quarter mile of the coastline by year. Since 2000, demand for coastline properties has tripled.
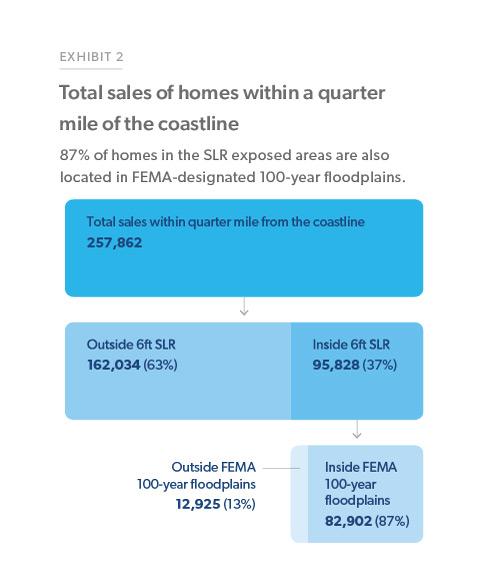
To determine existing flood risk for the 258,000 properties within a quarter mile of the coastline, we overlay FEMA flood maps on top of our sample and found that 56% of the sample fall in 100-year floodplains, which FEMA determines are exposed to a 1% annual chance of getting flooded. To capture the elevation of these properties relative to the sea level, we extract data from the Florida Digital Elevation Model. On average, these homes were 9.5 feet above sea level.
Understanding sea level rise risk in Florida and buyer types
Sea level rise risk in Florida
Florida, with a large population located at low elevations, is vulnerable to the impacts of SLR. There are several SLR projections under different scenarios for the state of Florida, which estimate SLR of several feet over the next few decades. For example, NOAA's intermediate high scenario predicts that under fast rise scenario the sea level will rise by 6.3 feet in Florida by the end of the century (2100). Under a scenario of low sea level rise and one major flood, the sea level in Florida is projected to rise to around 6.4 feet by 2050.6 In our sample, 37% of the homes in Florida within one-quarter mile of the coastline fall in the area exposed to this projected 6 feet SLR (referred to in this Note as “SLR exposed areas”). However, the SLR exposed areas are not mutually exclusive from FEMA-designated 100-year floodplains; 87% of properties in SLR exposed areas are also located in FEMA-designated 100- year floodplains (see Exhibit 2). FEMA floodplain designation is a measure of current risk of flooding and are determinants of flood insurance premiums under the National Flood Insurance Program (NFIP). To evaluate the price variations across different FEMA floodplains and SLR exposed areas, we divide the homes in our sample into three mutually exclusive groups:
- Inside of SLR exposed areas and FEMA-designated 100-year floodplains
- Inside of SLR exposed areas but outside of FEMA-designated 100-year floodplains
- Outside of SLR exposed area
In our sample, almost 13,000 homes are located in SLR exposed areas but outside of FEMA-designated 100-year floodplains. If buyers factor SLR risk into their pricing decisions, all else equal, the prices of these homes should be lower than the prices of homes outside of SLR exposed areas.
Buyer types
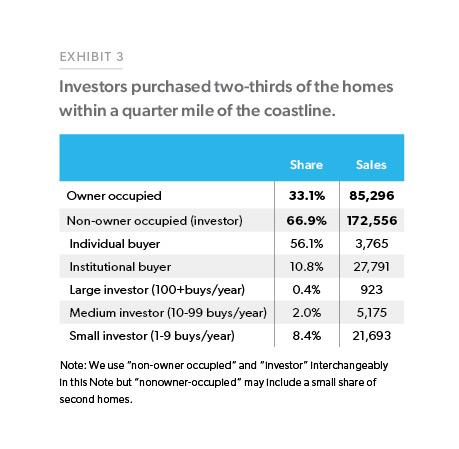
Many buyers buy a home as a primary residence (owner-occupied). There are also buyers who buy a home as an investment or rental property (non-owner-occupied). Those buying an investment property can be individual investors or institutional investors. Public records data includes information on whether a unit sold is owner-occupied or non-owner occupied following the sale. For sales of homes within a quarter mile of the coastline, 33.1% were for owner- occupancy and 66.9% were for non-owner occupancy. For non-owner- occupied homes, 56.1% were purchased by individual buyers and 10.8% by institutional investors. Among the institutional investors, most were small investors (who purchase 1-9 homes per year); followed by medium investors (who purchase 10-99 homes per year). See Exhibit 3.
Results
We employ a hedonic regression model (details in Appendix) to gauge the effect being in the SLR exposed area has on price. The regression analysis proceeds in several steps. First, we examine the overall discount for homes located in SLR exposed areas with and without including FEMA flood risk designations. Second, we differentiate between purchases for owner-occupied and non-owner- occupied homes and run separate regressions for each buyer type to evaluate the differing price effects. Third, we test the impact of the 2017 hurricanes and determine if there is any price adjustment pre- and post-hurricanes in SLR exposed areas using a diff-in-diff regression analysis which is a widely used approach to study changes in outcomes over time (see Appendix for diff-in-diff equation used). The key findings are summarized below:
Finding 1
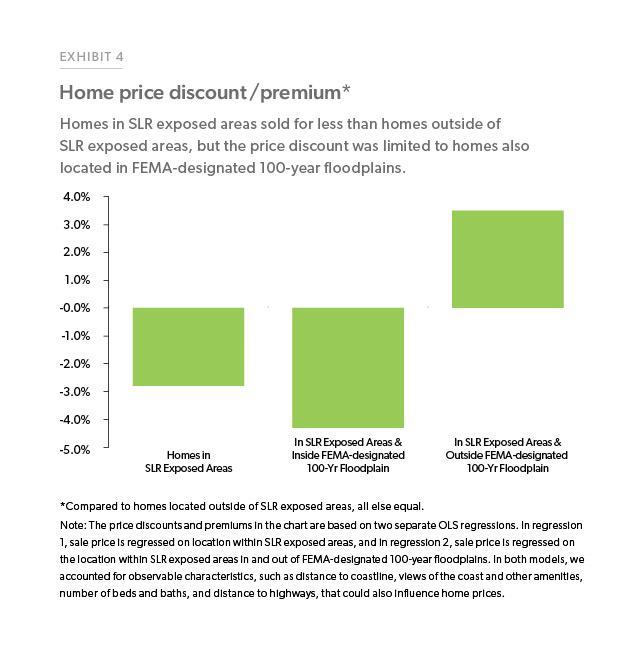
Homes located in SLR exposed areas are sold at a discount compared to observably equivalent homes outside of SLR exposed areas, but only if these homes are also located in FEMA- designated 100-year floodplains.
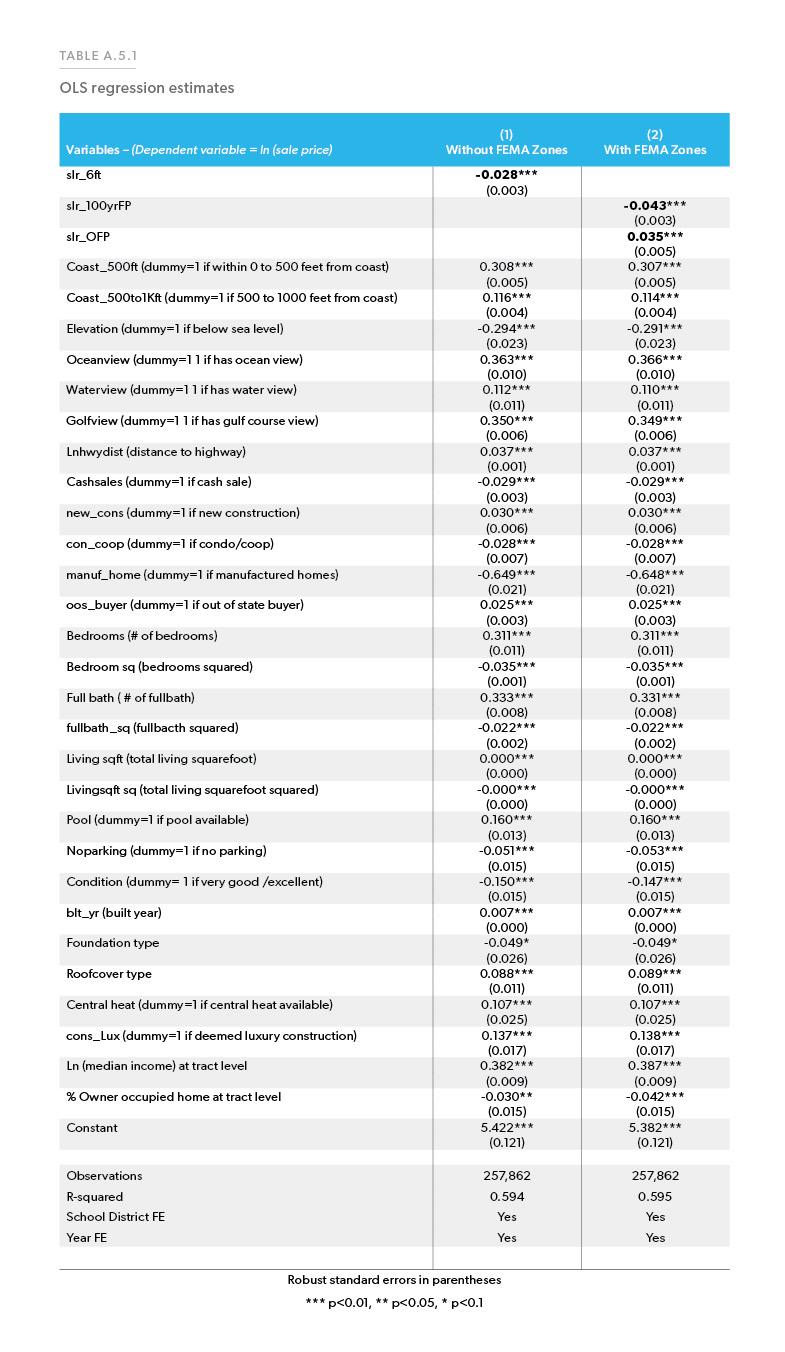
Our regression results suggest that homes in all SLR exposed areas, both inside and outside of a FEMA-designated 100-year floodplain and without, sell for 2.8% less than observably equivalent homes located outside of SLR exposed areas. This means that if an average priced home ($845,000 in our sample) located within a quarter mile of the coastline is in SLR exposed areas, then the home would be sold for $23,000 less than a home outside of SLR exposed areas. Does this negative impact on home prices mean buyers are aware of SLR risk and are pricing that risk into their purchase decision? Maybe not, and here's why.
As reflected in Exhibit 2, most homes located in SLR exposed areas are also located in FEMA-designated 100-year floodplains where flood insurance is required. As a result, price discounts for these homes can stem from flood insurance cost being capitalized in home prices.7 Consistent with previous studies, we find that homes in FEMA-designated 100-year floodplains sell for 4.3% less than an equivalent home outside of SLR exposed areas. If buyers consider SLR risk, we should see a price discount for homes that are in SLR exposed areas but outside of FEMA- designated 100-year floodplains.
However, we find a price premium of 3.5% for these homes, indicating that SLR risk is not affecting current home prices after controlling for the amenities.
Finding 2
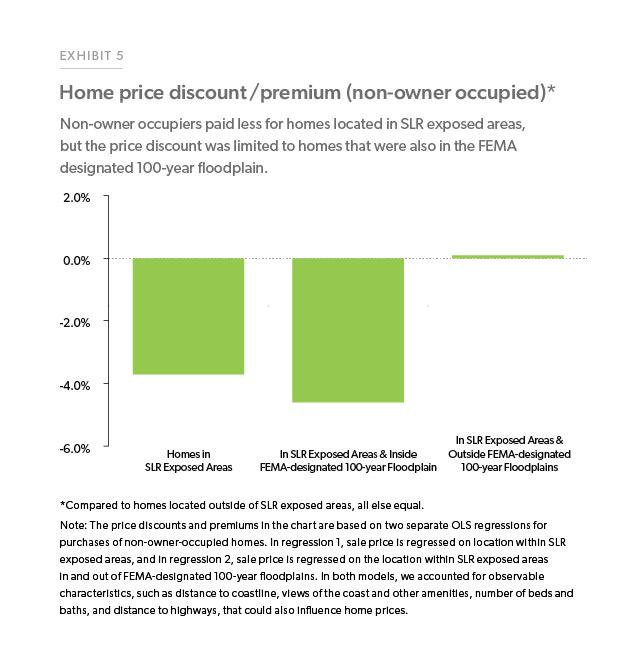
Non-owner occupiers pay less for homes in SLR exposed areas but only if the homes are also located in FEMA-designated 100-year floodplains.
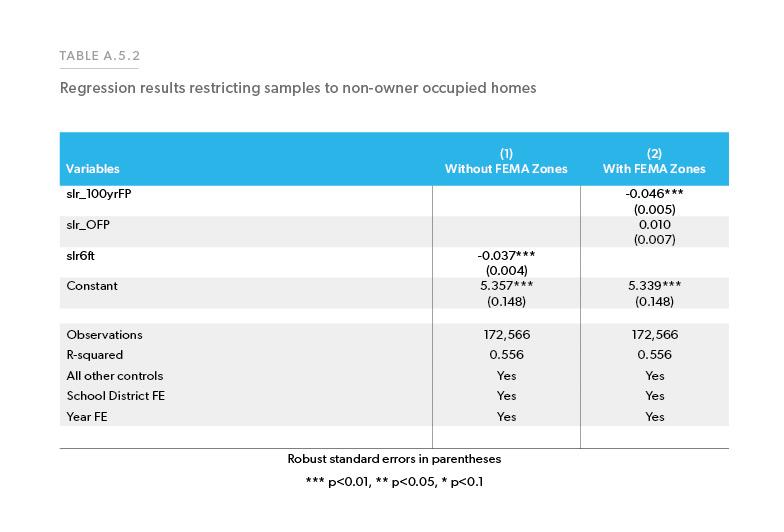
Overall, non-owner occupiers, that include investors could be aware of SLR risk and could be pricing SLR risk into their purchase decisions. To test whether non-owner occupiers pay less for homes exposed to future SLR risk, we ran separate regressions for non-owner-occupied homes (includes institutional investors). Like overall results, we find that homes in SLR exposed areas that are also located in FEMA 100-year floodplains sell for 4.6% less. However, for homes outside of FEMA-designated 100-year floodplains, there was no significant difference in price paid for homes inside and outside of SLR exposed areas.8
Finding 3
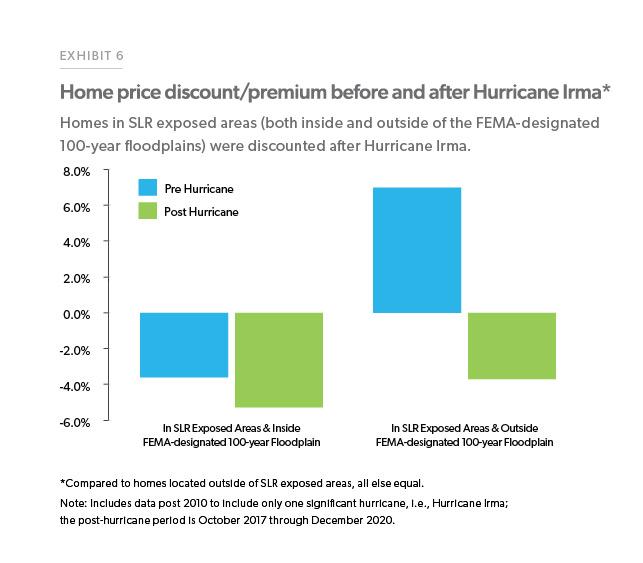
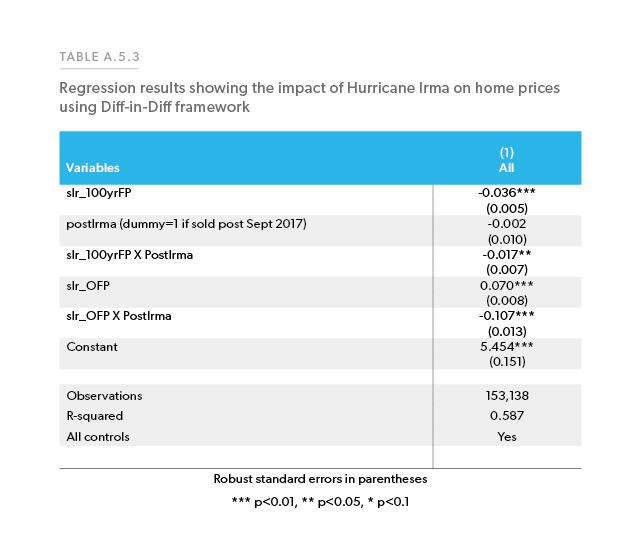
After Hurricane Irma in 2017, homes in SLR exposed areas were discounted significantly.
Several previous studies have shown that there is a price adjustment in the wake of flooding caused by hurricanes as buyers rely upon knowledge that is recent and readily available when making purchasing decisions due to the “availability heuristic” (Tversky and Kahneman 1973).9 Consistent with previous studies, we find a discount in SLR exposed areas, both inside and outside of FEMA-designated 100-year floodplains, following Hurricane Irma in 2017 as the flooding caused by Irma acted as a source of new information about flood risk. For example, all else equal, after Hurricane Irma, homes that were in SLR exposed areas and FEMA-designated 100-year floodplains sold for 5.4% less than homes outside of SLR exposed areas. Similarly, homes that were in SLR exposed areas but outside of FEMA-designated 100-year floodplains sold for 3.8% less. Consistent with prior studies, these discounts appear to be driven by heightened flood risk perception, rather than perceived SLR risk. Unfortunately, we do not have detailed information on whether and to what extent properties in our dataset were damaged by the flood which is a caveat of our finding that the discount is solely driven by heightened flood risk perception and not the damages to the properties.
Other notable findings
In our analysis, there are a few other noteworthy findings. In terms of how much of a premium people paid for the view, we find that ocean views, golf course views, and water views (e.g., pond, bay, and lake) command a price premium of 36%, 35%, and 11%, respectively. Furthermore, we find that there is a premium for higher elevation. Homes that are at or below sea level are sold for less than homes that are above sea level. We also find that cash buyers pay 2.9% less than buyers with mortgages, and out of state buyers pay 2.5% more than local buyers.
Conclusion
SLR risk poses long-term challenges for the housing market and adds another layer of risk to existing flood risk. However, our research shows no evidence that SLR risk is affecting current home prices. Homes in SLR-exposed areas that did have price discounts were also located in FEMA-designated 100-year floodplains, where discounts are typical because of the flood insurance requirement, rather than in consideration of future SLR risk. These findings are consistent with several previous studies which show that the discounts for homes located In 100-year floodplain as a result of flood Insurance payment being capitalized Into home prices.
From our analysis, we conclude either that there is a lack of awareness about SLR risk or that SLR risk may not be factored into pricing decisions because it is a long-term risk and buyers are more focused on the short-term, not intending to own the home long enough for SLR to have an effect.
The absence of price adjustments now could mean decreases in home prices later, as sea levels rise or FEMA flood maps reflect SLR. In the last couple years, home prices have increased significantly, and a 4-5% discount for homes in FEMA-designated floodplains may seem trivial at a macro level, but that can add up quickly. Especially in Florida communities where a large share of homes is in SLR-exposed areas and floodplains, this would have a significant impact on local housing markets.
Appendix
Appendix A.4
Methodology
We employ hedonic model which is commonly used to tease out the value of environmental amenity or disamenity using property transaction data (Equation 1 and 2). To compare the before and after hurricane Irma prices of observably equivalent homes we use a diff-in-diff framework (Equation 3). Our hedonic models take the following form:
Equation 1

Equation 2

Equation 3
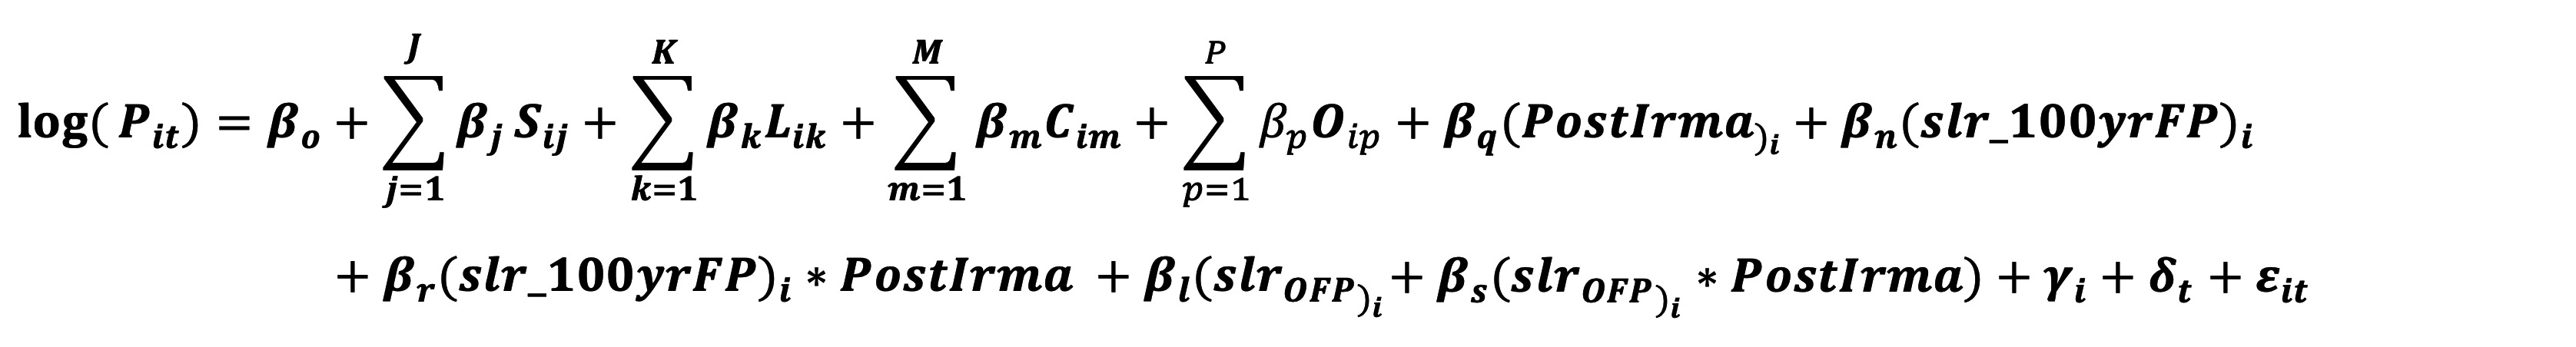
Where,
S: Structural Attributes (# of baths, # of beds, lot size, pool availability, roof type, foundation type etc.)
L: Locational Attributes (location attributes such distance to nearest highways, view of golf course, view of waterbodies)
C: Distance to Coastline
O: Other controls such as type of home (condo co-op vs. single-family), type of sales (cash/mortgage), out of state buyer etc.
slr_6ft: Dummy=1 if Inside SLR exposed areas
slr_100yrFP: Dummy=1 if Inside SLR exposed areas & Inside FEMA-designated 100-year floodplains
slr_OFP: Inside SLR exposed areas & Outside FEMA-designated 100-year floodplains
PostIrma: Dummy=1 if the home was sold after Hurricane Irma
 is the school district fixed effect and
  is the year fixed effect and
  is the error term
Appendix A.5
Results
References
Atreya, A., Ferreira, S., and Kriesel, W.P. 2013. "Forgetting the Flood? An analysis of the Flood Risk Discount over Time." Land Economics 89 (4): 577-596.
Bakkensen, L. A., Barrage, L., 2021. "Going Underwater? Flood Risk Belief Heterogeneity and Coastal Home Price Dynamics." The review of Financial Studies, hhab 122. https://doi.org/10.1093/rfs/hhab122.
Bin, Okmyung, and Craig E. Landry. 2012. “Changes in Implicit Flood Risk Premiums: Empirical Evidence from the Housing Market.” Journal of Environmental Economics and Management 65 (3): 361–76.
Bernstein, Asaf and Gustafson, Matthew and Lewis, Ryan, Disaster on the Horizon: The Price Effect of Sea Level Rise 2019. Journal of Financial Economics (JFE), 13 (2), 253-272.
Fu Xinyu & Jan Nijman (2021) Sea Level Rise, Homeownership, and Residential Real Estate Markets in South Florida, The Professional Geographer, 73:1, 62-1, DOI: 10.1080/00330124.2020.1818586.
Gibson, M., J. T. Mullins, and A. Hill. 2019. Climate risk and beliefs: Evidence from New York floodplains. Williams College Working Paper 2019-2.
Keenan, J. M., T. Hill, and A. Gumber. 2018. Climate gentrification: From theory to empiricism in Miami-Dade county, Florida. Environmental Research Letters 13 (5):054001.
Keys, Benjamin J. and Mulder, Philip, Neglected No More: Housing Markets, Mortgage Lending, and Sea Level Rise (October 2020). NBER Working Paper No. w27930, Available at SSRN: https://ssrn.com/abstract=3709620 or http://dx.doi.org/10.2139/ssrn.3709620.
Kousky, Carolyn. 2010. “Learning from Extreme Events: Risk Perceptions after the Flood.” Land Economics 86 (3): 395–422.
Lindsey, R. 2019. Climate change: Global sea level. NOAA. Accessed July 10 2021. http://www.climate.gov/news-features/understanding-climate/climate-change-global-sea-level.
Murfin Justin, Matthew Spiegel, Is the Risk of Sea Level Rise Capitalized in Residential Real Estate?, The Review of Financial Studies, Volume 33, Issue 3, March 2020, Pages 1217–1255, https://doi.org/10.1093/rfs/hhz134.
Robinson, B. L., 2012. The performance of non-owner-occupied mortgages during the housing crisis. Economic Quarterly 98, 111–138.
Tversky, Amos, and Daniel Kahneman. 1973. "Availability: A Heuristic for Judging Frequency and Probability." Cognitive Psychology 5 (2): 207–32.
- Economics and Demographics (noaa.gov)
- Per NRDC (Flood Disclosure Scorecard | NRDC), Florida has no statutory or regulatory requirement that a seller must disclose a property’s flood risk. However, flood insurance coverage is mandated if the home is on a 100-year floodplain and the mortgage is from a federally backed lender so the buyers will receive flood risk information at some point in the home buying process.
- See Atreya et al. 2013 , Kousky 2010 , Bin and Landry 2012 for references
- Freddie Mac requires all homes underlying single-family mortgages in our portfolio to have property insurance coverage throughout the life of the loan. For homes located in designated SFHAs, Freddie Mac also requires flood insurance coverage. Additionally, a mortgage is ineligible for sale to Freddie Mac if the mortgage is secured by property that is subject to coastal tideland, wetland or setback laws and/or regulations that prevent the rebuilding or maintenance of the property improvements if they are damaged or destroyed.
- We restrict our sample to sales within a quarter-mile of the coast to include homes within a feasible walking distance to the coast which is a desirable attribute of coastal properties.
- According to climate central. Scenario details in NOAA technical report 2017, intended for the 2018 U.S. National Climate Assessment. Sea level rise is relative to 1992 baseline. We chose fast rise as sea levels are projected to rise at a faster pace than in the last 100 years.
- For example, see Bin and Landry, 2012; Kousky, 2010, Atreya et al. 2013
- There is an insignificant difference in price variation for homes located in SLR exposed areas that are in and outside of FEMA-designated 100-year floodplains for institutional investors when separate regressions are run for those groups.
- Some previous studies include but are not limited to Bin and Landry, 2012; Kousky, 2010, Atreya et al. 2013