


Freddie Mac’s Newly Enhanced Mortgage Rate Survey Explained
For decades, the mortgage industry has relied on Freddie Mac’s Primary Mortgage Market Survey® (PMMS) as the industry standard for mortgage interest rates in the United States. Throughout the history of the PMMS, we have adjusted the methodology to account for changes in technology and the mortgage industry while maintaining continuity with historical rates. In order to ensure that the PMMS continues to provide high-quality information on the mortgage market, we are making new enhancements to our methodology.
In this Research Note, we provide details of the adjustments and explain how the changes may impact users of the PMMS. We also discuss how the adjustments in methodology would have impacted historical PMMS results had we implemented these changes at an earlier date. While the methodological changes will set up the PMMS for continued success in years to come, the total impact on rates is currently very small, as we document below.
Background on the PMMS
Freddie Mac has been surveying lenders on weekly mortgage rates since 1971.1 The survey included discount points and origination fees for 30-year and 15-year fixed-rate and 5/1 hybrid amortizing adjustable-rate mortgage products.
The survey captures mortgage rates for first-lien, conventional, conforming, purchase mortgages with a borrower who has a loan-to-value of 80% and excellent credit. In addition, it captures adjustable-rate mortgage (ARM) rates indexed to U.S. Treasury yields. The lenders surveyed are asked for both the initial coupon rate and points as well as the margin on the ARM products. The lenders represent a mix of business models—credit unions, commercial banks, and mortgage lending companies—roughly proportional to the level of mortgage business each type commands nationwide. The rates are collected from Monday through Wednesday, and the results are released on Thursdays at 10 a.m. Eastern Time (ET).
Enhancement of Freddie Mac’s mortgage rate survey
There have been growing challenges with the traditional survey approach. The current survey operates on sampled data where a subset of records in the overall population is selected. As the underlying population changes in response to economic conditions and the evolution of the mortgage market, the survey faces a variety of issues that could result in statistical bias and eventually reduce the reliability of the results.
While our survey carefully samples lenders covering a broad range of lender types to reflect the U.S. mortgage market, we had to make frequent adjustments to our selection process to reflect changes in the housing market. The entry and exit of new participants into and out of the mortgage market creates more complexity in accurately tracking the market with a traditional survey method.
Many institutions have turned to administrative datasets to supplement or replace survey methods. Administrative datasets are data collected by governments or other organizations for non-statistical reasons to provide overviews on registration, transactions, and record keeping. To enhance the PMMS, we have also decided to turn to administrative data, leveraging Freddie Mac’s vast data resources to estimate weekly mortgage rates. For the long-run viability of the PMMS, Freddie Mac has enhanced the PMMS methodology to improve the quality—as well as reliability and consistency—of its results.
For the long-run viability of the PMMS, Freddie Mac has enhanced the PMMS methodology to improve the quality—as well as reliability and consistency—of its results.
Leveraging loan application data
Going forward, the traditional survey approach will be replaced with loan application information submitted to Freddie Mac’s automated underwriting system, Loan Product Advisor® (LPA). LPA helps simplify the origination processes and provides lenders with greater certainty of meeting Freddie Mac’s eligibility requirements.
The loan application data is extensive and contains various information about the property being considered for purchase, the borrower’s financial situation, employment history, and more.
In general, mortgage rates are determined by a combination of various factors such as current economic conditions, the lender’s risk appetite and overhead costs, and borrowers’ credit profiles. However, the application data is neither a pledge by the applicant nor a commitment by the lender.
There are many advantages of using loan application data instead of a survey, including the dramatic increases in coverage and a real-time view of the mortgage market. The loan application data also covers a broad range of lenders and geographies in the United States and immediately and automatically adjusts to shifts in the composition of the mortgage market. While the current PMMS in recent years has captured mortgage rates reported by lenders in a majority of states, the loan application covers lenders in all 50 states, plus the District of Columbia, on a weekly basis.
Limitations of the loan application data
Although there are many advantages of using loan application data to measure the mortgage rate, it comes with a cost. First, we do not have the information on the mortgage rate when lenders do not intend to sell to the secondary market or if they do not use the LPA as the underwriting tool.
As noted above, we measure the mortgage rate not in the origination but in the application stage. Therefore, our reported rate does not represent the rate at the time of loan origination. Not all applications will necessarily be approved and result in originated loans. Users should be aware of these factors when using the PMMS.
In addition, using LPA will result in two major changes related to our PMMS output:
- We will no longer report interest rates, margin, or discount points and fees for the hybrid 5/1 Treasury Indexed Adjustable-Rate Mortgage (ARM).
- We will no longer report average discount points and origination fees for the 30-year and the 15-year fixed-rate mortgage (FRM).
We will not include the ARM products rate due to insufficient numbers of applicants with ARM programs in recent years in LPA data.
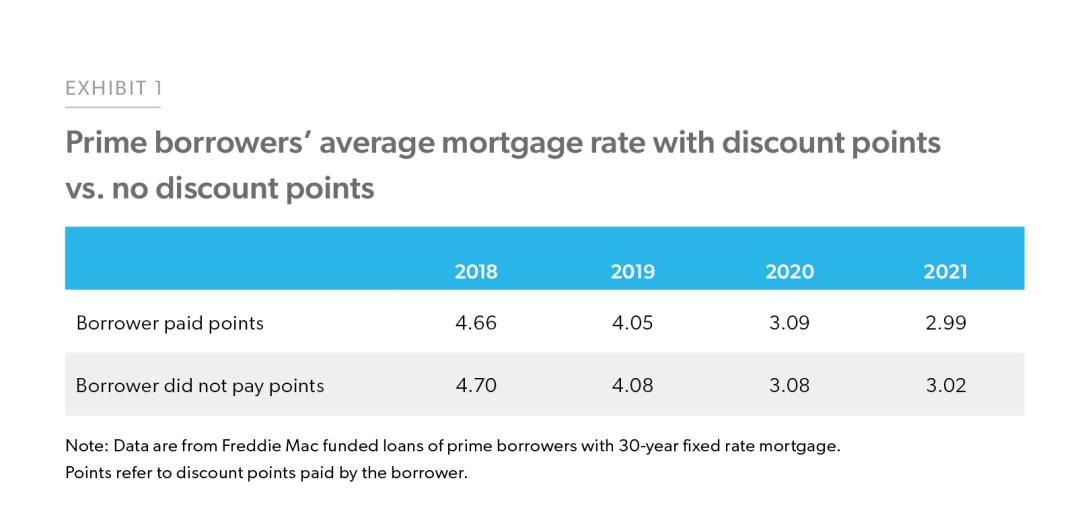
The cessation of reporting average points and fees merits some further discussion. Since LPA does not capture discount points or origination fees, we are not able to report them in the PMMS going forward. The full cost of a mortgage is captured by both the interest rate and the discount points and origination fees paid by a borrower. Theoretically, a borrower who pays discount points would receive a lower rate compared to the rate they would receive if they paid no points. However, in practice, we have found that in recent years the difference in rate between a borrower paying discount points and borrowers who do not pay discount points has been very near to zero.
Consider Exhibit 1. We analyzed loans funded by Freddie Mac where the loan meets the PMMS profile and the closing date was between 2018 and 2021—then segmented the data into two sets: (1) borrowers who purchased discount points and (2) borrowers who did not purchase discount points. We found that for purchase transactions, mortgage rates are nearly the same regardless of whether borrowers purchased discount points. We found similar outcomes in refinance and cash- out refinance, where average mortgage rates did not change regardless of whether borrowers purchased discount points.2
Methodology
Our main goal is to capture the average interest rate from loan applications submitted to Freddie Mac’s LPA tool. In order to align with the historical PMMS approach, we will limit the selection of loan applications to conventional, conforming, fully amortizing home purchase loans for borrowers who put 20% down and have excellent credit.
At first, we collect all purchase loan applications that could result in future home purchases. Next, we clean the data by removing irrelevant, corrupted, incorrectly formatted, and incomplete data. Then, we deduplicate the transactions to extract the most recent submissions after eliminating the transactions with outliers.
Then, we select the loan applications meeting the following criteria:
- Single Family (SF) Loan — A mortgage loan secured by a property that contains one to four residential dwelling units.
- Owner Occupied (OO) — A property in which at least one unit is occupied by an individual with an ownership interest.
- Conventional — A mortgage or loan that is not offered or secured by a government entity.
It is available through private lenders, such as banks, credit unions, and mortgage companies. - 30-year or 15-year fixed rate mortgage — A loan that will be paid off completely in 30 or 15 years, respectively, for which the interest rate stays the same for as long as the borrower keeps the mortgage.
- A single-unit property — A property containing only one dwelling unit.
- Origination Loan-to-Value ratio — LTV greater than or equal to 75 and less than or equal to 80.
- Origination FICO score — 740 or above.
- Conforming Loan — A mortgage with terms and conditions that meet the underwriting guidelines of the GSE (government-sponsored enterprises). To be consistent, we exclude loans with a higher loan amount than the national conforming loan limits ($647,200 in 2022).
- Property is within the lower 48 contiguous states or the District of Columbia (excludes Alaska, Hawaii, and U.S. territories3)
We selected these loan features to maximize the compatibility between our new approach and the historical survey-based PMMS.
Lastly, we applied several additional rules to calculate the timely mortgage rate. In LPA, a lender may submit the same application multiple times in the loan application stage. Therefore, in our final selection, we keep only the existing applicants when their rates have changed compared to prior submissions, while we include all new applicants. By selecting only new applicants and existing applicants only if their rate change, we ensure our measure represents the most recent rate in the current mortgage market.
Specifically, we:
- Filter LPA records to include only the purchase applications that could result in new home applications.
- Create weekly application measures by aggregating applications from Thursday prior to the current week through Wednesday.
- Set the first week of 2005 as the initial period, calculating the weekly rate. We provide the historical series of the PMMS under our new methodology back to 2005 to enable users to perform time series analysis.
- Focus on the mortgage rate based on the latest submission for any loan application during the week. Our approach differs from collecting the mortgage rate based on the rate set date, which includes only the loan applications when the rates are locked.
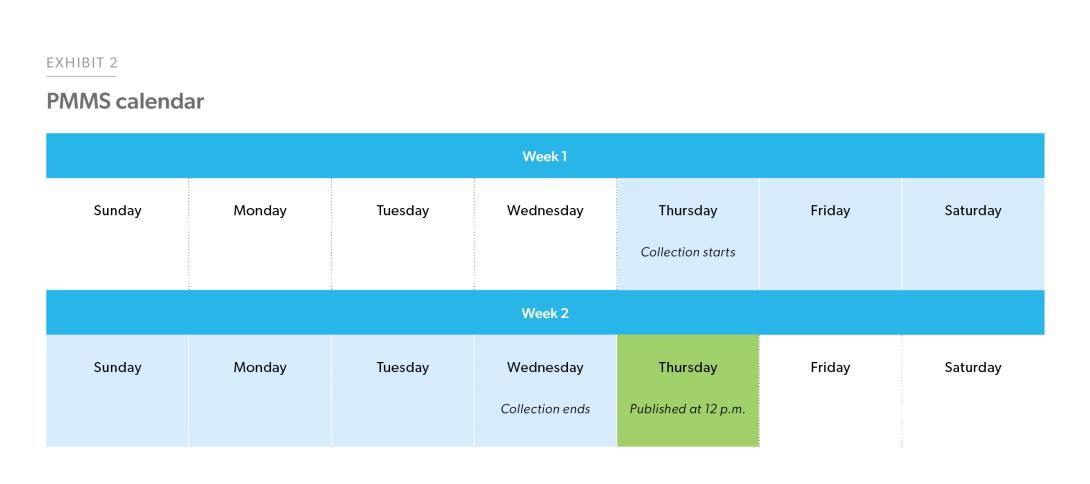
PMMS calendar
Going forward, the PMMS will be published weekly each Thursday at 12 p.m. ET. When a U.S. holiday falls on a Thursday, the PMMS will publish on the Wednesday of that week.
The week of application activity starts at 12:00 a.m. ET the Thursday of last week and goes through 11:59p.m. ET the following Wednesday. We collect the mortgage rate of all purchase applications that meet our weekly criteria and calculate the average mortgage rate.
Comparing the new methodology to historical PMMS and external measures
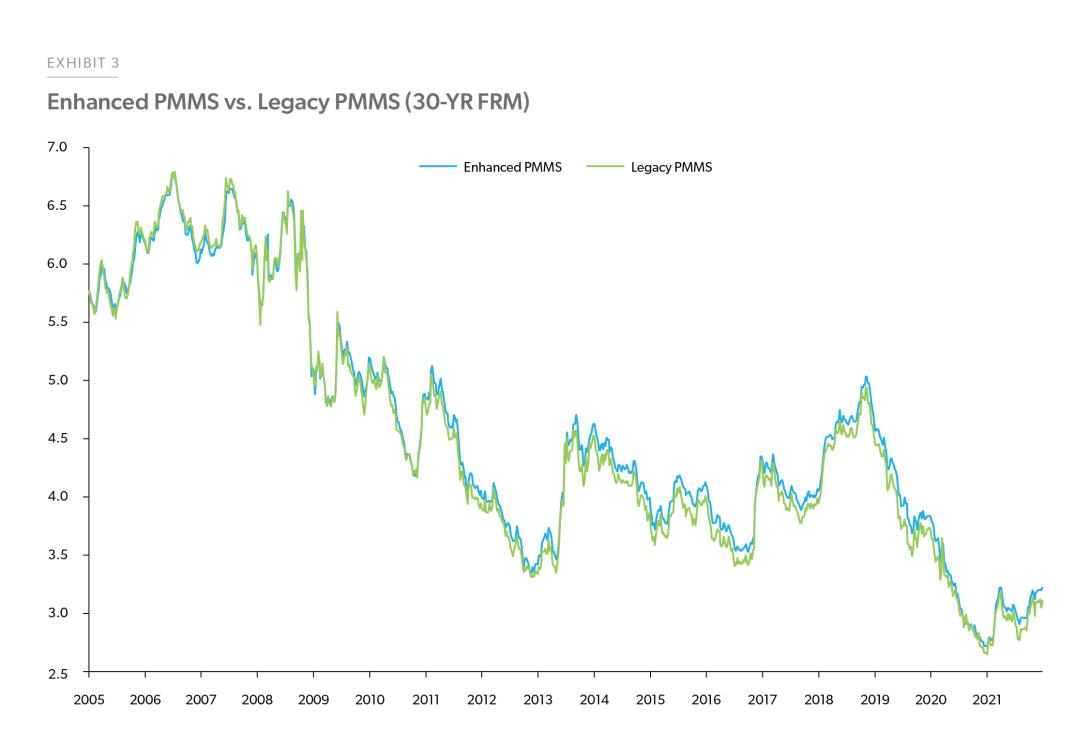
In preparation for launching the newly enhanced PMMS, we created a complete weekly time series dating back to January 2005, when the loan application data collected from LPA was considered reliable for PMMS purposes. As we applied the same filters to the historical data as to the real-time data, the weekly releases are aligned with the same data-generation process as the historical series. This allowed us to construct a time series of weekly rates that would have been published if the new methodology had been applied historically in real-time.
We find that the new methodology based on loan applications tracks very closely with our historical survey approach. On average, the difference between the traditional survey approach and the new approach for the 30-year FRM rate is about 0.066 percentage points from 2005 through 2021, with a standard deviation of about 0.074 percentage points. See Exhibit 3 below.
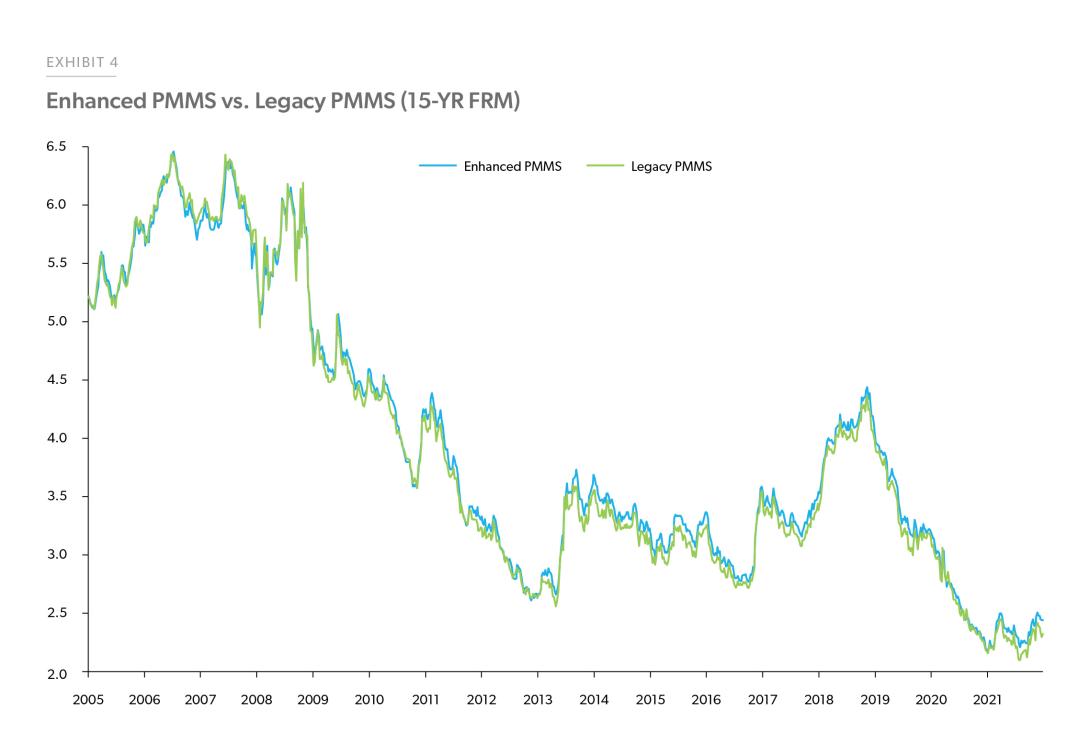
We conducted a similar experiment for the 15-year FRM; see Exhibit 4 below. On average, the difference between the traditional survey approach and the new approach for the 15-year FRM rate is about 0.0475 percentage points from 2005 through 2021, with a standard deviation of about 0.069 percentage points.
The very small difference in the rates reported in our historical survey and the real-time estimate of the new LPA-based approach give us great confidence in using the new approach. We also tested our results with other loan datasets purchased from third parties applying the same PMMS filters. The average rate computed using the new PMMS methodology and in the third-party data filtered to match the PMMS were quite similar. Finally, we assessed the results with the closed loans funded by Freddie Mac collected from the Uniform Closing Dataset after applying the same PMMS filters and we received comparable results.
The very small difference in the rates reported in our historical survey and the real-time estimate of the new LPA-based approach give us great confidence in using the new approach.
Conclusion
By using comprehensive and timely loan application data, our enhanced PMMS will produce a more reliable and accurate mortgage rate. Instead of surveying lenders, the weekly mortgage rate will be based on thousands of applications submitted to Freddie Mac from lenders across the country. We believe this improved PMMS will reflect the broader market and be able to monitor the real-time mortgage rate more closely.
We believe this improved PMMS will reflect the broader market and be able to monitor the real- time mortgage rate closely.
PMMS users interested in time series properties using the new methodology are encouraged to submit this form to receive a file containing the historical real-time estimates displayed in Exhibits 3 and 4 above.
PMMS data users with questions about the methodological change are encouraged to reach out to us at [email protected].
-
Footnotes
- For more background see Freddie Mac’s Mortgage Rate Survey Explained — Freddie Mac.
- We also sampled closed loans from the HMDA 2021 dataset. We found similar results as what is displayed in Exhibit 1, showing that mortgage rates tend to stay consistent regardless of whether borrowers purchased discount points.
- Alaska, Hawaii, the U.S. territories of Guam and the U.S. Virgin Islands have special statutory provisions that provide higher national loan limits than those in the lower contiguous 48 states and the District of Columbia.
Prepared by the Economic & Housing Research group
Sam Khater, Chief Economist
Len Kiefer, Deputy Chief Economist
Mihwa Kim, Macro Housing Economics Director