Low-Income Homebuyers Are Less Likely to Migrate from Cities, More Likely to Miss Potential Cost Savings
The COVID-19 pandemic led to an increase in migration away from larger, more expensive areas toward more affordable ones. However, not all types of homebuyers were able to migrate as easily. Freddie Mac research shows that, since the start of the pandemic, low-income homebuyers are 25% less likely than moderate- and high-income homebuyers to move out of the top 25 largest metro areas by population, and those who do move are more likely to move shorter distances.
To track these net migration patterns by income, Freddie Mac researchers analyzed all accepted loan applications from 2018 to 2022 using Freddie Mac’s Loan Product Advisor® (LPA) data, segmenting homebuyers into low-income and moderate- and high-income groups based on whether they earned more or less than 80% of the area median income in the geographic area from which they were applying.1
Our analysis of the loan application data suggests that migration out from the top 25 largest metro areas increased for the overall population.2 However, for low-income homebuyers, net migration away from these largest metros has been more muted. Because they are less likely to relocate, fewer low-income homebuyers are able to take advantage of possible cost savings from moving to a more affordable area.
We caution that the loan application data provides a portfolio view of Freddie Mac’s conventional loans and captures only the intent to move.3
Where Low-Income Loan Homebuyers Are Moving
Migration out of the top 25 largest metro areas accelerated during the pandemic for homebuyers regardless of income. However, our analysis found differences in migration patterns based on the mortgage homebuyers’ income level.
Net Migration by Typology and Income Group
-
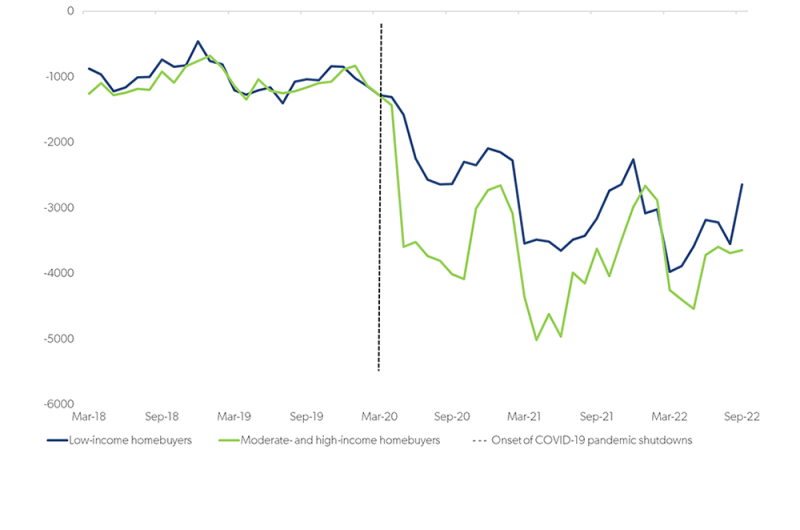
Net Migration: Top 25 Largest Metros
-
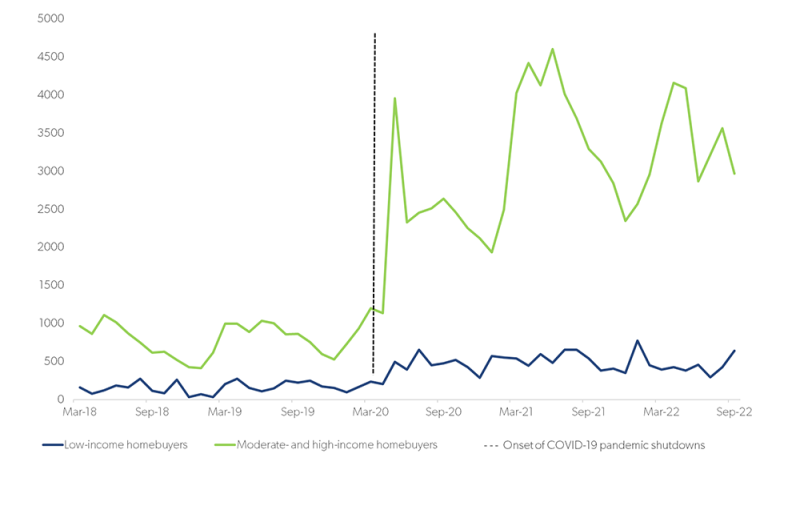
Net Migration: Mid-Size Metros
-
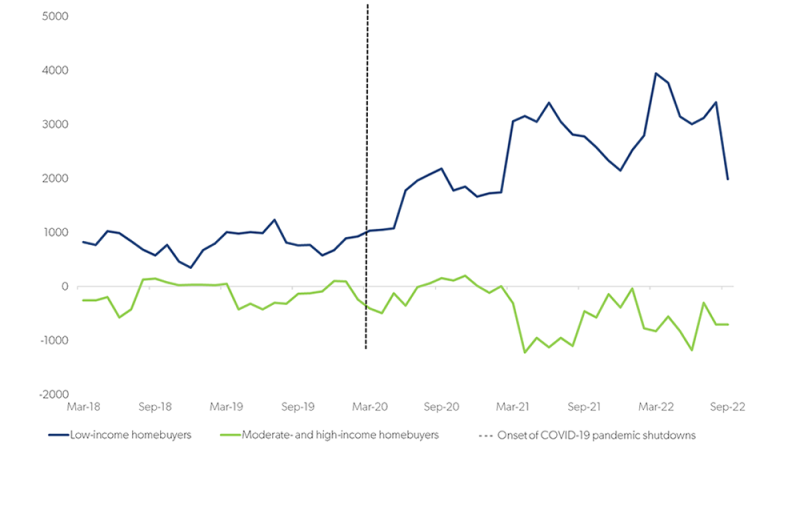
Net Migration: Rural Areas
Compared to moderate- and high-income mortgage homebuyers:
- Fewer low-income homebuyers moved out of large metro areas. Moreover, their net migration slowed more sharply after many restrictions related to COVID-19 were lifted or relaxed in March 2022.
- Low-income homebuyers were more likely to apply to move into rural areas, and less likely to apply to move to mid-sized metro areas.
- On average, low-income homebuyers applied to move 20%-25% less distance than moderate- and high-income homebuyers.3
Median Distance Moved by Income Group
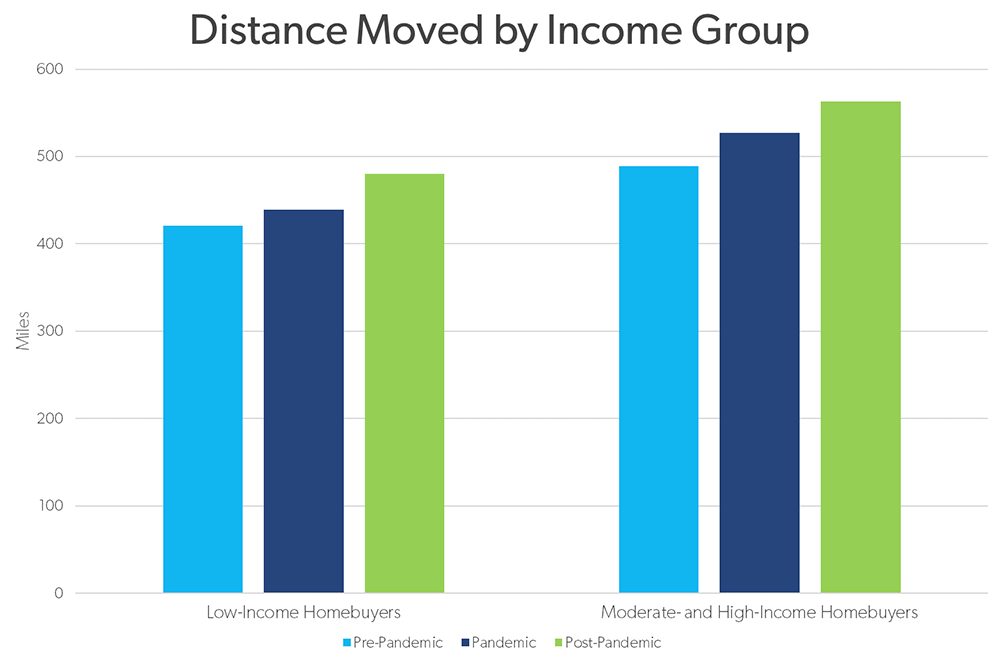
Pre-pandemic is defined as the period from March 2018 to February 2020; Pandemic as the period from March 2020 to February 2022; and Post Pandemic as the period from March 2022 to September 2022.
Source: Freddie Mac LPA®
One possible explanation for the difference in rates of migration between low-income and moderate- and high-income homebuyers is the flexibility of work opportunities for those groups. Our analysis of the American Community Survey 2021 data shows that 35%-40% of low-income workers were employed in service sector work. And service sector jobs — whether tourism, leisure, bars or restaurants — are usually concentrated in larger metro areas where the demand for services is higher and there’s little to no telework opportunity.
No matter the reason, these migration patterns may exacerbate affordable housing concerns.
Job proximity is likely to be a higher priority for low-income homebuyers, which leads them to buy homes closer to large metro areas. Indeed, moving farther away to more affordable metros, as many higher-income borrowers do, could allow them to benefit from greater cost savings.
— Rama Yanamandra, Macro and Housing Economics Manager, Freddie Mac
Comparing Potential Cost Savings for Different Income Levels When Migrating
Because low-income homebuyers are less likely to move long distances, they are unable to reach the same level of potential cost savings as moderate- and high-income homebuyers, who tend to move farther. Between March 2020 and February 2022 (before remaining COVID-19 restrictions were lifted), homebuyers from each group who moved into one of their 10 most popular destinations could have saved:
- An average of $700 for low-income homebuyers in their monthly mortgage payments.
- An average of more than $850 — and as much as $2,500 depending on the market — for moderate- and high-income homebuyers in monthly mortgage payments.
While the low-income and moderate- and high-income homebuyers are in different price segments, the $150 monthly difference translates to an additional $1,800 per year in potential cost savings for moderate- and high-income homebuyer applicants.
Affordable Housing in Metro Areas
These findings underscore the need for more affordable housing for low-income families, particularly in and near the top 25 largest metro areas.
We at Freddie Mac have been doing our part to help provide for these low-income borrowers. In 2022, we financed approximately 1 million home purchases, and more than half of these owner-occupied homes were affordable to low- and moderate-income families. In addition, more than 74% of all multifamily units we financed were affordable to low-income households, and nearly 23% were affordable to very low-income households.
For more insights from Freddie Mac’s research team, visit Research Insights, Notes & Briefs.
Footnotes
- For the AMI, we use the median family income files provided by FHFA.
- Although not all applications result in closed loans, they still provide a reasonable proxy of overall patterns; therefore, for readability, we use the term “homebuyers” throughout as shorthand for intended homebuyers.
- LPA data captures loan applications, which may or may not result in an actual move. In addition to the application of existing homeowners applying to move, it also captures the number and geography of renters who apply to become homeowners. Although the reason behind a move is not known in LPA, our previous research found that housing-related reasons were the main factors behind shorter distance moves within counties while employment-related reasons were the main factors behind longer distance moves crossing county lines.
- This finding is based on a regression of the distance (log miles) on the income category.