


Slower Growth and Lower Mortgage Rates
The pace of growth in the U.S. slowed to a crawl in the last quarter of the year, raising questions about how much life is left in this aging expansion. In addition, expectations of global growth continued to ratchet down. The market volatility in the first two months of 2016 only heightened concerns about the health of the world economy and probably forestalled any further monetary tightening by the Fed until June.
- Real growth in the U.S. slowed to 0.7 percent in the fourth quarter according to the advance estimate released by the Bureau of Economic Analysis. In January, the International Monetary Fund estimated the world economy grew 3.1 percent in real terms in 2015, and it lowered its previous projections for 2016 and 2017 to 3.4 percent and 3.6 percent, respectively.
- Inflation remained low. Growth in the GDP deflator dropped from 1.3 percent in the third quarter to 0.8 percent in the fourth quarter. Other broad-based measures of inflation and inflation expectations remain subdued.
- The unemployment rate dipped a tenth of a percent in January to 4.9 percent. The labor force participation rate, though a bit higher than in December, remained below 63 percent. Nonfarm payrolls increased by 151,000 new jobs in January, 128,000 fewer than the average increase in the fourth quarter of 2015. However, wage growth picked up in January. Average hourly earnings increased 0.5 percent to $25.39.
In light of this lackluster economic performance and the recent financial market turbulence, we have lowered our real growth projections to 2.0 percent in 2016 and 2.3 percent in 2017. We also expect the unemployment rate to average 4.9 percent and 4.8 percent in 2016 and 2017, respectively. We anticipate CPI inflation will average
1.4 percent in 2016 and 1.9 percent in 2017.
A flight-to-quality triggered by recent turbulence in financial markets has pushed Treasury yields lower so far this year. Tepid real growth and a strengthening U.S. dollar will continue to restrain yields going forward. Accordingly, we have lowered our projections of both Treasury yields and mortgage rates. We now expect the 30-year mortgage rate to average 4.1 percent in 2016 and 4.8 percent in 2017.
Housing was one of the few bright spots in the economy last year, and we expect continued improvement in 2016. The imbalance between demand for housing and the supply of both houses and apartments has supported rapid growth in both house prices and rents. The gap between demand and supply will not be closed any time soon, thus we project continued house price appreciation in 2016. Rent growth will begin to moderate in selected metros as new units come on the market; however rent growth will remain above long-term averages this year. Persistently low mortgage rates will facilitate house purchases and refinances, although refinance volume may tail off if the Fed resumes monetary tightening later this year.
Some recent housing indicators worth noting:
- The resurgence in home sales continued in January as existing-home sales increased. The National Association of Realtors’ February release showed existing-home sales went from a seasonally adjusted annual rate of
5.45 million in December to 5.47 million in January, beating analyst expectations. January’s figures also represent year-over-year growth at 11 percent. - The Commerce Department reported that January had a 9.2 percent monthly drop in new residential sales (5.2 percent below January 2015), which is still keeping in line with a steady growth trend. Looking at total housing inventory, there was a 3.4 percent increase from December and a 4-month supply of unsold inventory at the current sales pace. With a typical surge in homebuying activity set to begin in the spring, the increase in inventory will not be enough to counter home price appreciation that showed 8.2 percent yearly growth for existing-home sales.
- Housing starts fell 3.8 percent in January according to the U.S. Department of Commerce. Some of this decline was weather-related. However, the Housing Market Index published by the National Association of Home Builders fell to its lowest reading since May 2015, indicating labor and property shortages are preventing builders from catching up to the demand for new home.
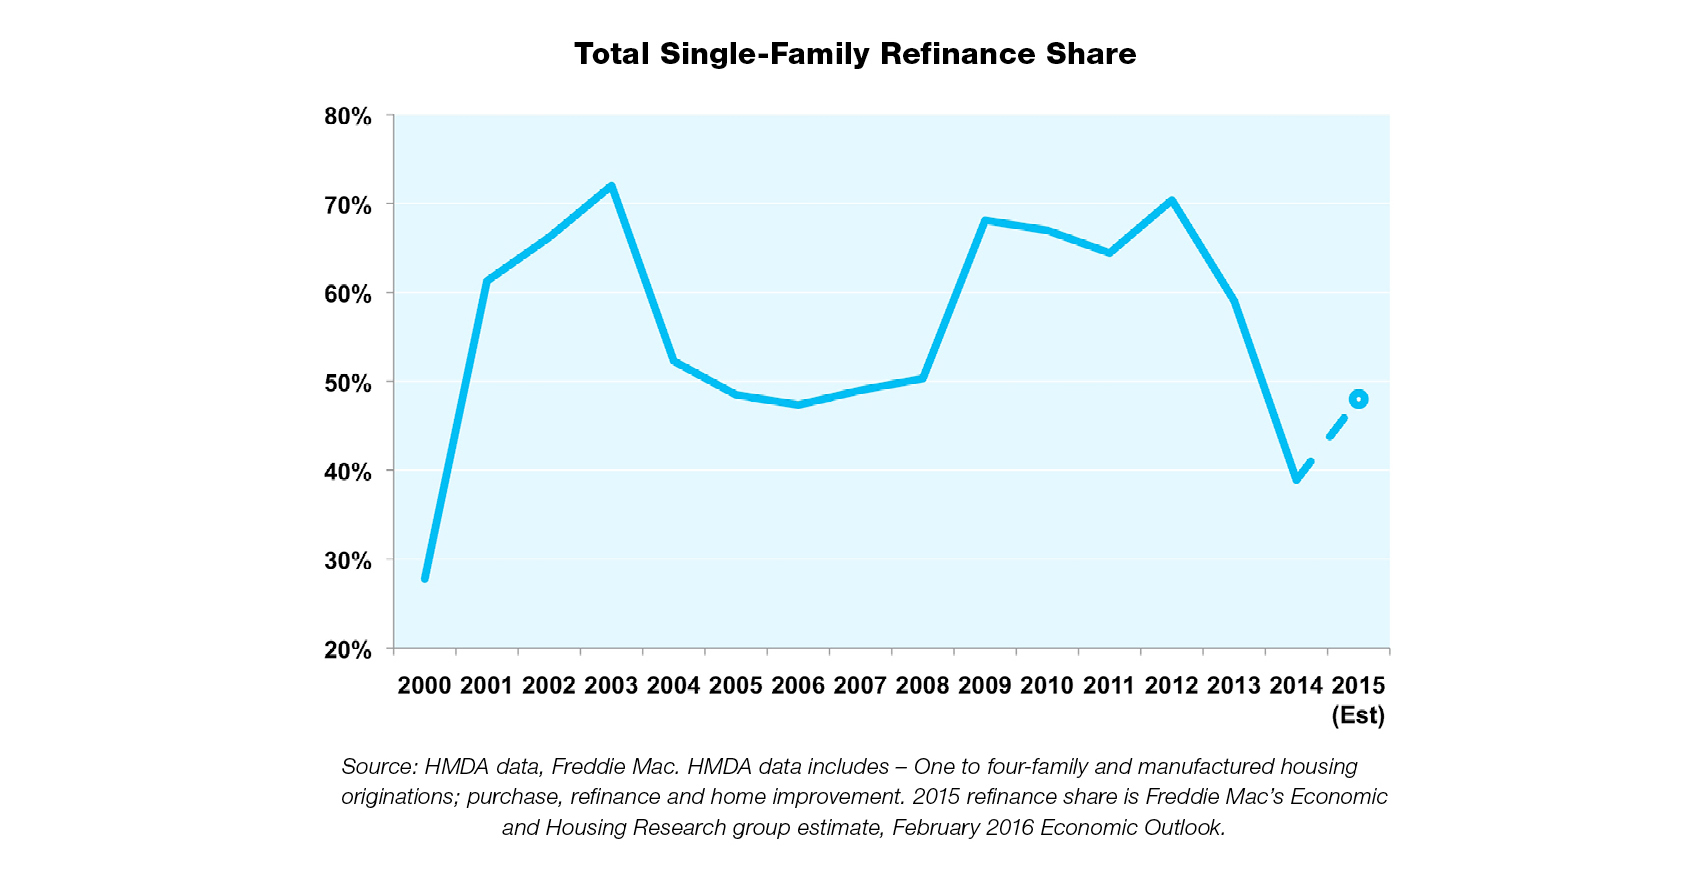
The combination of low mortgage rates and increases in home equity will incent some additional refinances in 2016. As a result, we are raising our refinance projection share of originations to 40 percent. In last month’s Outlook, we reviewed potential sources of refinance originations in 2016. In this month’s In Closing, we refine our estimates further.
Cash-out refinance volume increases
Refinances made up 50 percent of Freddie Mac’s fundings ($76 billion) in the last quarter of 2015. Mortgage rates remained within a 25 basis point range in the fourth quarter and dipped to within 17 basis points of the low for the year, providing support for continued refinance activity.
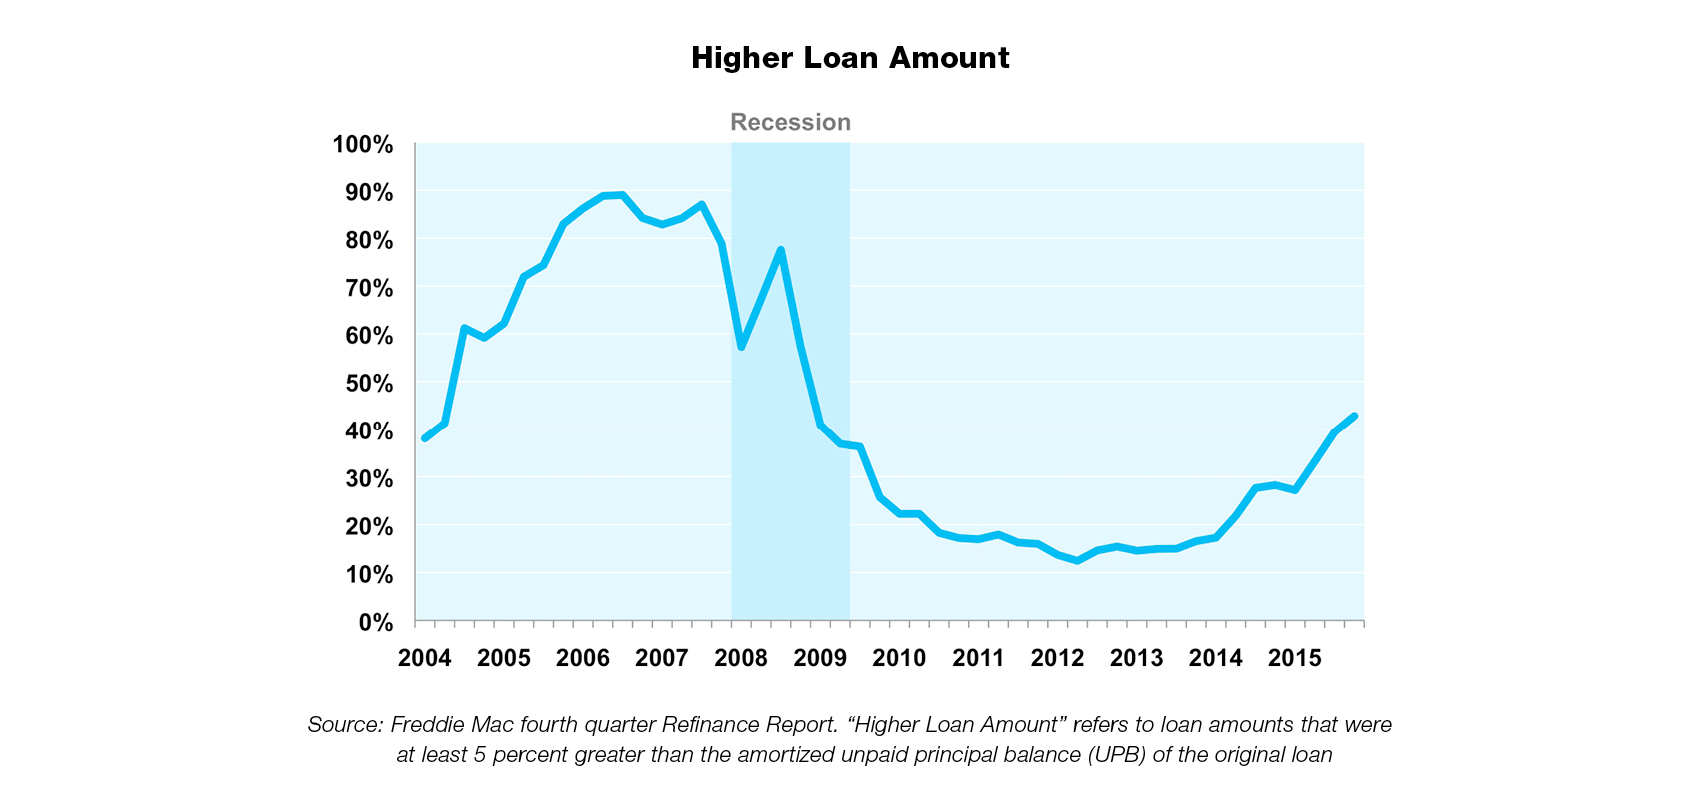
Freddie Mac’s share of cash-out borrowers, defined as those who increased their loan balance by at least 5 percent, increased four percentage points to 43 percent. (This estimate is calculated for borrowers where both the existing and new loans were funded by Freddie Mac.) This represents the highest share of cash-out refinances since 2008. Prior to 2009, the share of cash-outs ranged from 32 percent to 89 percent (in 2006) and averaged 64 percent of all refinances. During the Great Recession, cash-outs plummeted as house prices collapsed.
The share of cash-outs hit a low of 12 percent in the second quarter of 2012 and didn’t rise above 20 percent for the next two years. Starting in 2014, the share of cash-out refinances has risen gradually but remains well below the pre-recession historical average.
Term and product changes
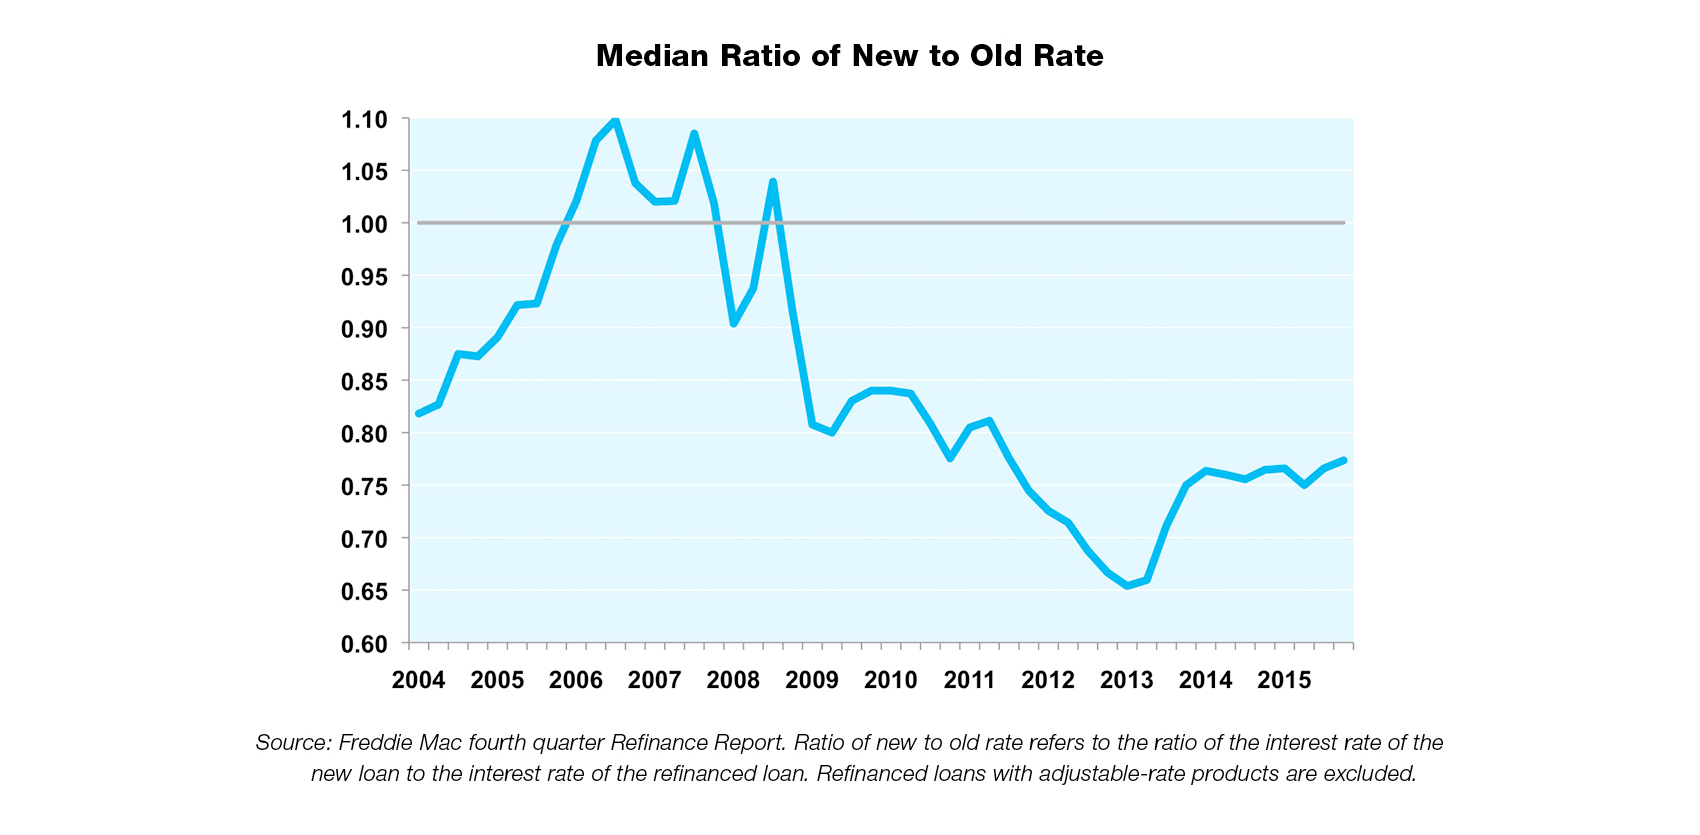
Borrowers cut their mortgage rate by 110 basis points on average, or a 23 percent rate-reduction — in the fourth quarter. This rate reduction is high by historical standards; the average reduction is 13 percent. Rate reductions tend to be greater in periods of limited cash-outs. Conversely, periods of high cash-outs, such as 2006 and 2007, often are associated with refinances that increase note rates.
More than 95 percent of refinancing borrowers chose a fixed-rate loan. Fixed-rate loans were preferred regardless of the type of the original loan. For example, 83 percent of borrowers with hybrid ARMs chose fixed-rate loans in the fourth quarter. Only 17 percent chose to refinance into another hybrid ARM.
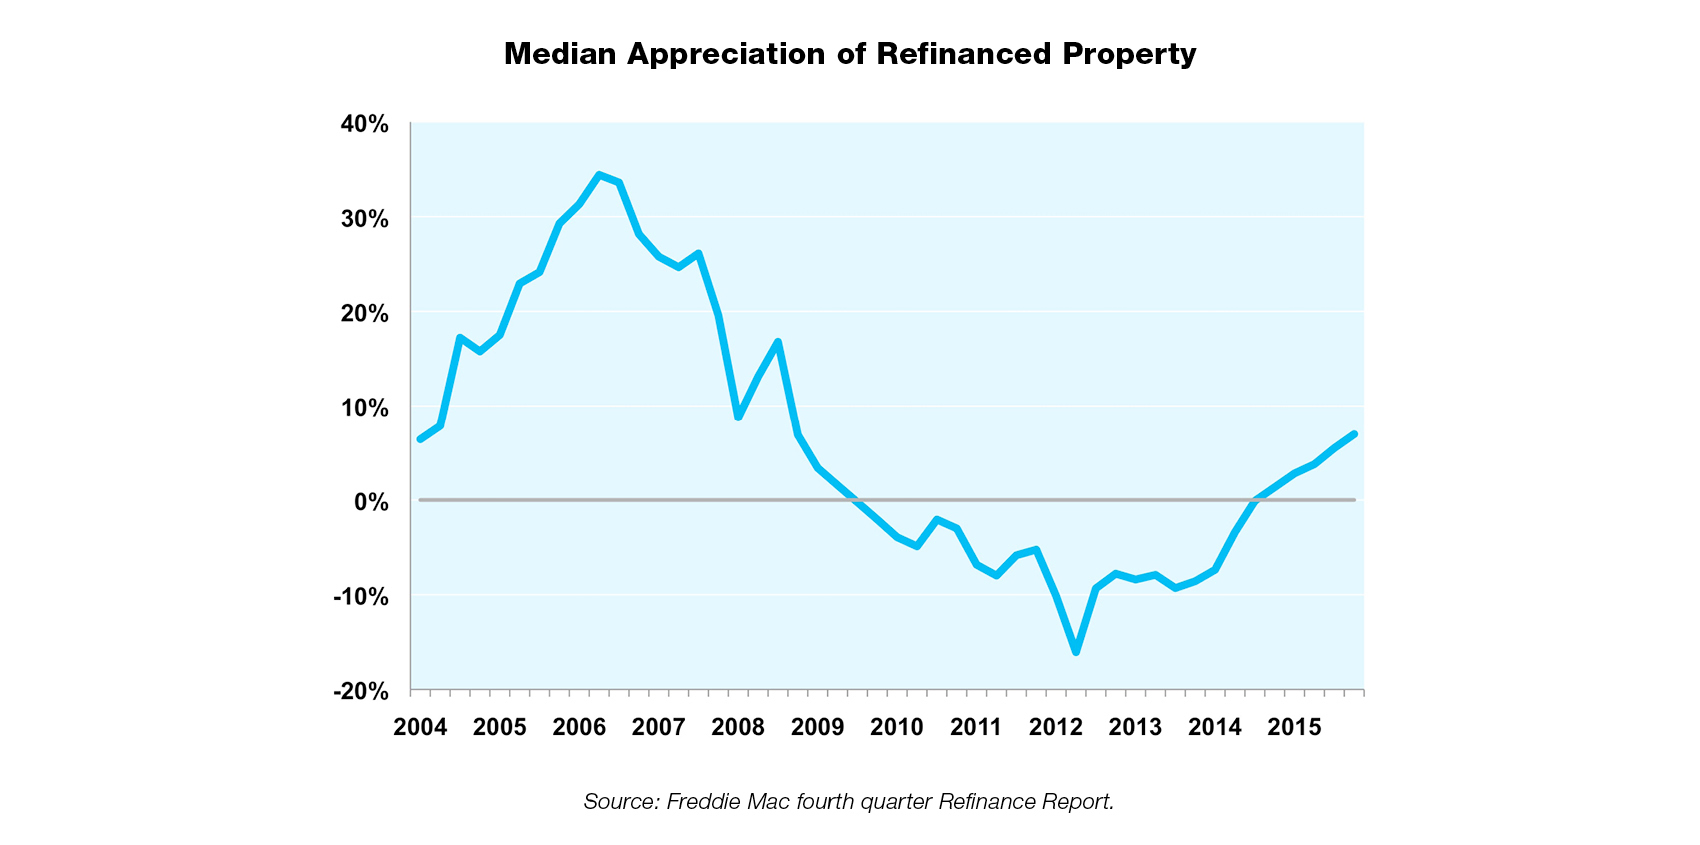
The median house price appreciation from origination of the existing loan to the refinance was 7 percent. Prior to the fourth quarter 2009, the median appreciation among refinancers had never been negative. The median house price among refinancers declined every quarter for the subsequent 19 quarters. The final quarter of 2015 marked the fifth consecutive quarter with positive median appreciation and it also posted the highest appreciation of those five quarters. However, this 7 percent appreciation lies far below the pre-2009 average of 16 percent, those periods from the first quarter of 1994 to the fourth quarter of 2008.
See the Full Year 2015 Refinance Statistics for more information.