Economic, Housing and Mortgage Market Outlook – August 2024
In this Issue
- The U.S. economy continues to remain strong as shown in Q2 2024 GDP growth, but some signs of cooling have emerged in the labor market.
- Despite mortgage rates being almost 50 basis points lower than they were at the beginning of May, housing demand remains weak as reflected in lower home sales. Homebuyers continue to pause as they wait for rates to decline even further.
Recent developments
U.S. economy: The first estimate of Q2 U.S. economic growth released by the Bureau of Economic Analysis (BEA) in July showed GDP grew at an annualized rate of 2.8%, up from a 1.4% annualized rate in Q1 2024. This growth was led by consumption spending, private inventory buildup and non-residential investment. Consumption spending accelerated to 2.3% annualized growth in Q2 from the 1.5% in Q1 2024, with the contribution of this component to GDP growth increasing to 1.6 percentage points in Q2 2024 from 0.9 percentage points in Q1 2024. Changes in private inventory contributed 0.82 percentage points to Q2 2024 growth. One possible explanation for the increase in inventories could be that retailers are increasing inventory for holiday orders much earlier to insure against future shipping disruptions that have occurred since the pandemic.
Non-residential investment increased 5.2% on an annualized basis, the strongest growth in a year, indicating that business investment remains robust. In contrast, residential investment came in negative, marking the first decline after three quarters of consecutive growth. Another key metric, final sales to private domestic purchasers, which measures U.S. residents’ spending, removing inventories and exports but adding imports, rose 2.6% in Q2, following a 2.4% increase in Q1 2024.
The latest employment report from the Bureau of Labor Statistics (BLS) points to a softer labor market. July’s total nonfarm payroll gains were 114,000 while total employment gains for May and June were revised down by 29,000 (2,000 for May and 27,000 for June). However, the three-month moving average of job gains remains strong at 170,000. The unemployment rate ticked up further to 4.3% and remains at its highest since November 2021. The labor force participation rate ticked up to 62.7% in June from 62.5% in May with the prime age participation at 84%. Average hourly earnings rose 3.6% year-over-year. This is less than last month but is still above the pre-pandemic (2016-2019) average of 2.9%. Along with that, the employment cost index rose less than expected as inflation continued to ease. The year-over-year gains in total compensation costs grew at the slowest pace since 2022.
Job openings moderated slightly in June to 8.18 million from 8.23 million in May, remaining at the lowest level since March 2021. The job openings to unemployed ratio for June was 1.2, the lowest level since June 2021 and closer to the 2019 average. The quits rate was 2.1% for June with the number of quits at the lowest level since November 2020. The number of hires at 5.3 million was the lowest since April 2017; the hires rate is at its lowest level since February 2014, if we ignore the pandemic recession.
Inflation has been moderating towards the Fed target. The Federal Reserve’s preferred inflation gauge, the core Personal Consumption Expenditure (PCE) Price Index, which strips out volatile food and energy prices, rose 0.2% month-over-month and was up 2.6% year-over-year in June 2024.1 Prices for goods decreased 0.2% month-over-month offsetting the increases in prices for services. Energy prices continued to decline. The Consumer Price Index (CPI) for June was favorable with a 0.1% decline in the headline price level month-over-month and a year-over-year growth of 3.0%.2 The monthly CPI decline was the first since the pandemic (May 2020) and the year-over-year change in CPI was the lowest since March 2021. Core CPI came in at 0.1% month-over-month and 3.3% year over year in June. Monthly gains in shelter inflation were at the lowest level since August 2021, both for the rent of primary residence and the owner equivalent rent. Despite coming in at the lowest level since August 2021, the year-over-year increase in shelter accounted for nearly 70% of the total increase in core CPI.
Overall, the U.S. economy remains strong. Strong growth for Q2 2024 was led by consumption spending by higher income consumers, who have seen an increase in wealth due to the rise in returns from financial assets as well as home equity.3 However, the labor market has been cooling with a slowdown in job growth. Moderating inflationary pressures are paving the way for the Federal Reserve to start cutting rates soon.
U.S. housing and mortgage market: The housing market continues to reel under the impact of high mortgage rates. Total (existing + new) home sales for June came in at 4.5 million, the lowest level since July 2011. Both existing and new home sales declined in June. Existing home sales were at 3.89 million (seasonally adjusted annual rate) in June, declining 5.4% month-over-month and down 5.4% year-over-year.4 New home sales were at 617,000 in June, down 0.6% month-over-month and down 7.4% year-over-year.5 Both existing and new home inventory improved in June but remains below the pre-pandemic average.6 While inventory of existing homes picked up 23% year-over-year to 1.32 million units, the number of homes available for sale remains well below the pre-pandemic average of 1.8 million units. With respect to the new home inventory, while inventory of new homes remains at the highest level since January 2008, almost 3/5th of the homes for sale are under construction with only around 1/5th completed. The remaining 1/5th are those for which construction has not started. Months’ supply of existing homes also picked up to 4.1 months. This is the first time that supply has been above 4 months since October 2020.
Homebuilder confidence fell further to 42 in June from 43 a month earlier, according to the National Association of Home Builders’ Housing Market Index. The decline is below the threshold of 50, indicating poor building conditions over the next six months. Higher mortgage rates continue to dampen builder sentiment.7 Housing construction saw an uptick in June with new residential construction up 3% month-over-month to 1.35 million units, even as starts were 4% lower than the level seen last June. Single-family starts declined 2% month-over-month, while multifamily starts increased by 10%.
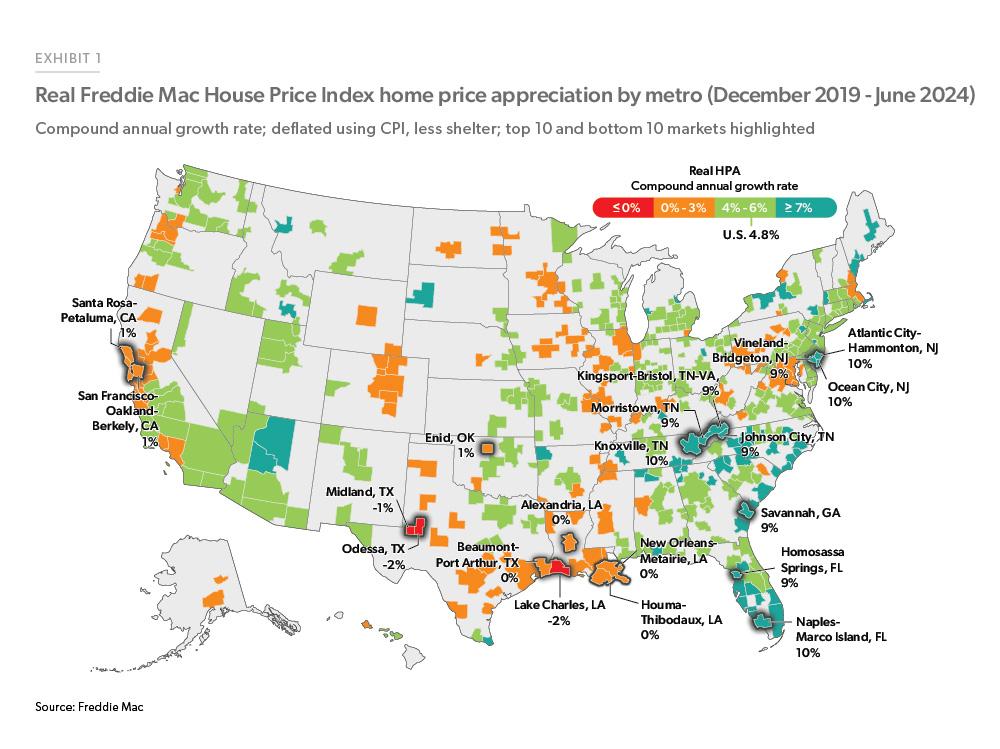
House prices, as measured by the Freddie Mac House Price Index (FMHPI) rose 0.2% in June and were up 5.2% over the year. Overall, since December 2019, house prices grew by almost 50% in nominal terms. However, the inflation-adjusted (real) house price growth since 2019 has been more moderate than what the nominal rates suggest. Additionally, price dynamics have evolved distinctly since 2019 for different markets nationwide. For example, zoom towns (communities that experienced a significant population increase during the pandemic due to an influx of remote workers) saw significant house price appreciation right after the pandemic started, but since then, have had appreciation abate and even turn negative in some metros. One way to gauge house price growth since the pandemic would be to calculate the compound annual growth rate, which measures what the annual growth rate would need to be for inflation-adjusted house prices to grow from their 2019 levels to where they are now. By looking at the real compound annual growth rate, we can smooth out the volatility house prices have experienced since 2020 while also adjusting for the high inflation.
Exhibit 1 maps out the inflation-adjusted compound annual growth rate by metros. At the national level, the real average growth rate has been at around 5% annually since December 2019. Even after adjusting for inflation, metros in the Southeast and Northeast have experienced relatively more robust growth than other regions. Specifically, markets in Florida and Tennessee have seen strong average real growth as these states witnessed higher in-migration due to the warmer weather and more affordable housing supply. Conversely, Southeast Texas, the Permian Basin, Louisiana, and Northern California metros have seen softer inflation-adjusted house price growth.
The rate on 30-year fixed-rate mortgage averaged 6.85% in July, as measured by Freddie Mac’s Primary Mortgage Market Survey® and ended the month at 6.78%. Despite the rate drop from 6.92% in June to 6.85% in July, mortgage activity remained muted. Per the Mortgage Bankers Association (MBA) Weekly Application Survey, mortgage activity decreased over the month as homebuyers have yet to respond to these lower rates. Sometimes as rates decline, demand weakens, and the apparent paradox is driven by buyers hoping rates will not fall further before they decide to purchase. Overall mortgage activity was down 2.6% month-over-month and was up 0.2% year-over-year at the end of July. Refinance activity during the last week of July was up 4.9% compared to the same week a month earlier, while purchase applications were down 7.1% month-over-month at the end of July.
Higher mortgage rates and low affordability impacted the homeownership rate in Q2 2024. The homeownership rate was slightly lower at 65.6% in Q2 2024 compared to the rate observed in Q2 2023 of 65.9%, as per the Q2 2024 Residential Vacancies and Homeownership Report by the U.S. Census Bureau. Between Q2 2023 and Q2 2024, the total number of housing units rose from 145.1 million to 146.6 million, an increase of 1.6 million units. Occupied units increased by 1.4 million while vacant units rose by 0.2 million. Most notably, the increase in occupied housing units was primarily driven by renter-occupied units which increased by 0.8 million units (1.9%) from 44.3 million in Q2 2023 to 45.2 million in Q2 2024. On the other hand, owner occupied units increased only 0.5 million units (0.6%) from 85.7 million to 86.3 million. The homeowner vacancy rate ticked up from 0.8% in Q1 to 0.9% in Q2 2024 and was up from 0.7% in Q2 2023, while the renter vacancy rate remained unchanged from Q1 2024 at 6.6% but was up from 6.3% a year ago.
Overall, despite rates being almost 50 basis points lower than they were at the beginning of May, and slowing in the rate of house price appreciation, housing demand remains weak as reflected in lower home sales and lower applications. Many potential homebuyers continue to pause due to poor affordability as they await further declines in rates.
Outlook
The overall economy continues to grow, albeit at a slower pace than during the second half of last year. Under our baseline scenario, we expect the slower growth to persist as the labor market weakens further this year and next. With the backdrop of favorable inflation data and a softening labor market, we anticipate the Federal Reserve to initiate rate cuts sooner rather than later. Our baseline scenario predicts a further cooling of inflation, but we expect inflation to remain above the Federal Reserve’s target rate of 2% in 2024 and 2025. The anticipation of an upcoming rate cut is already influencing the market, leading to downward pressure on mortgage rates. As a result, we forecast mortgage rates to gradually decline in the coming quarters.
On the housing market, high mortgage rates and high home prices have led some prospective buyers to step back. However, with the expectation of mortgage rates cooling further, we anticipate a significant surge in demand mainly from the first-time homebuyers left at the margins. We also expect lower rates to loosen the rate lock-in effect to some extent, providing some boost to inventory—although it should be minimal, given the bulk of existing homeowners have locked-in rates below 6%. Despite some loosening, the tight inventory (due to a decade of under construction, further exacerbated by the rate lock-in effect) is still expected to limit home sales. We expect home sales to increase modestly the remainder of the year and 2025 while remaining below 6 million annually. Supported by solid demand, we expect upward pressure on home prices and forecast home prices to rise by 2.1% in 2024 and 0.6% in 2025.
Our forecast for total mortgage origination is a modest volume increase in 2024 and 2025. This forecast is based on several factors including the expectation of modestly improved home sales and an increase in home prices, which should stimulate purchase originations. We expect refinance volumes to remain flat in 2024 and improve slightly in 2025 as rates decline further in 2025.
Overall, our outlook remains optimistic. While prospective homebuyers continue to face affordability challenges due to high home prices, homeowners are experiencing significant wealth gains which makes them less vulnerable to adverse economic events. Under our baseline scenario, we do not foresee the economy going into recession.
See the August 2024 spotlight on refinance trends “Refinance Originations Trends Through Q2 2024.”
Footnotes
- BEA
- BLS
- Bank of American Consumer Checkpoint – July 2024
- National Association of Realtors
- U.S. Census Bureau
- Pre-pandemic average is considered to be the period from 2016-19.
- National Association of Home Builders (https://www.nahb.org)
Prepared by the Economic & Housing Research group
Sam Khater, Chief Economist
Len Kiefer, Deputy Chief Economist
Ralph DeFranco, Macro Housing Economics Senior Director
Ajita Atreya, Macro & Housing Economics Manager
Rama Yanamandra, Macro & Housing Economics Manager
Penka Trentcheva, Macro & Housing Economics Senior
Genaro Villa, Macro & Housing Economics Senior