Tight housing inventory has been an important feature of the housing market at least since 2016. For-sale housing inventory, especially of starter homes, is currently at its lowest level in over ten years. If inventory continues to remain tight, home sales will likely decline from their 2016 levels. As we enter the spring home buying season, all eyes are on housing inventory and whether or not it will meet the high demand.

Table chart of Forecast: April 2017 Snapshot

Recent Trends in Economic, Housing & Mortgage Markets

With the second quarter of 2017 underway, recent economic events have been relatively in line with our predictions. Low unemployment and increasing inflation are still ongoing trends. The labor market is continuing to strengthen, as the unemployment rate dropped to 4.5 percent in March—the lowest rate in nearly a decade.

Additionally, inflation has gradually been ticking up since the start of the year. The Consumer Price Index (CPI) increased 0.1 percent in February and was at 2.7 percent year over year. Core-CPI (exclusive of food and energy components) increased 2.2 percent year over year.

The S&P CoreLogic Case-Shiller U.S. National Home Price SA Index reported a 0.6 percent month-over-month increase in January, marking a 5.8 percent rate of appreciation since January of last year. While full employment and rising inflation are signs of a strong economy, they also have the potential to push mortgage rates and house prices up. The higher rates and higher prices create significant affordability concerns, which may continue to characterize the housing market for the rest of 2017.

Inventory is tight

Housing inventory has been at its lowest level in over a decade. Between December 2016 and February 2017, the number of months of supply of existing homes averaged 3.6, the lowest level since 2000. A number of other housing market metrics also point to low for-sale housing inventory.

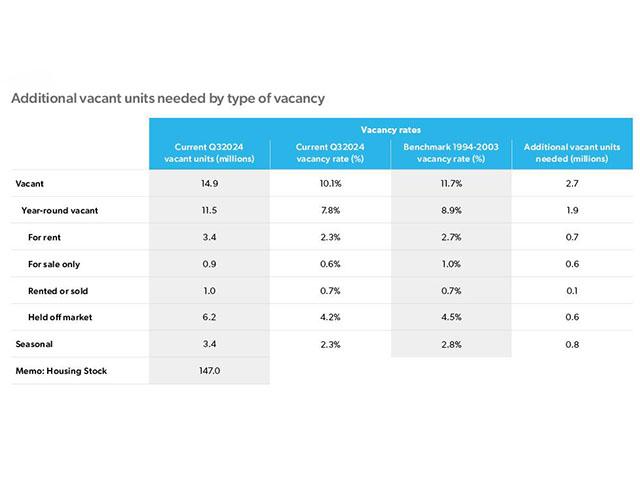
Housing starts were 1.17 million for 2016 and are projected to be 1.26 million for 2017, well below the historical average of 1.36 million and the approximately 1.7 million additional housing units the U.S. economy needs to add to replace existing stock, meet new household formation and second home demand. The average length of time a house stays on the market is 3 months, quite low compared to the historical average of 5.3 months. The low average number of months a home is available for sale is not necessarily a cause of concern if it is due to an efficient market. However, coupled with the low number of homes currently available for sale, it is concerning. The number of homes available for sale has gone down significantly compared to pre-crisis years. This is true both for existing and new homes available for sale, which are at almost half the level they were at in 2007.

The reasons for the lower inventory are: many homeowners are not selling their homes for fear of not being able to find homes they like within their budget; and some borrowers do not want to let go of the extremely low mortgage rates that they locked in for their homes bought after the crisis— if they move, they might not be able to get their new loans at such low rates. Home prices have still not recovered to their pre-crisis levels for many homeowners and selling their homes would fetch them less than the amounts they owe on their mortgage. Due to these factors, homeowners are staying in their homes for more years than was the case prior to the crisis.

The Case of Mr. and Mrs. Smith

Consider Mr. and Mrs. Smith, who live in a rented apartment in the Denver metro area. They are a middle-class family earning an income of $64,000 in 2013. They decided to buy a townhome for their expanding family in the spring of 2013. The Smiths purchased a townhome at the median sales price of $177,000 in Denver during April 2013. After putting 10 percent down, they got a 30-year conventional mortgage at 3.4 percent. Since they did not make a 20 percent down payment, they need to pay private mortgage insurance (PMI) on their loan. Their monthly mortgage payment (principal, interest and PMI) is $774, which includes a PMI payment of $68 per month.1

The Smiths family expanded further and they now have a toddler and an infant at home. They feel the townhome is getting too small for their family. The Smiths plan to upgrade to a bigger home. They initially considered making the upgrade in February 2016, but realized that they would have to pay 1.5 times their monthly payment ($1,298) to afford a median-priced single-family home in Denver. They felt this would have put a lot of burden on their finances and decided to hold off on making the leap. One year later, they reconsider moving to a bigger home and realize that they would have to shell out even more on their monthly payments to make the move. If they buy a median priced home in the same metro area, their monthly payment would almost double to $1,515, assuming they have enough equity on their current home to put 20 percent down. They regret not making the move last year when the interest rates and home prices were lower. And they know rates and home prices could rise further this year. While the Smiths might be able to afford the additional $217 [$1515 - $1298 = $217] per month above the year-ago cost for a larger home, other families may find it difficult to pay additional money for an upgrade. Whether to make the move or not is the dilemma most of the homeowners wishing to upgrade their homes are facing, not only in Denver but across the entire country.

Now, imagine the Johnson family is moving to Denver in spring of 2017 and they are hoping to buy their first home. Their family is small and their income modest, so they are hoping to buy a townhome. The Smiths home would be perfect for them. If the Smiths trade up, the Johnsons could buy their townhome. If the Smiths stay put, the Johnsons will have to rent.

Conclusion

Even though Denver is a strong housing market, it is not unique. The housing market conditions, especially in terms of the tight for-sale housing inventory, have been similar in most of the areas across the country.

The decision the Smiths, and millions of other homeowners like them, make will impact housing inventory. Their decisions will impact home sales for the year, which we project will decrease to 5.90 million in 2017. The spring home buying season is key to understanding how the housing market performs over the year; to see if those willing to list their home (aka the Smiths) actually do so and those looking to buy (aka the Johnsons) get lucky and find their dream home. The mortgage rates, which are an important factor in home buying, would also come into play. If inflation reaches its target rate and labor markets tighten further, mortgage rates will rise as projected. This will make it difficult for some homebuyers, who might not be able to afford the higher mortgage payments and therefore might be sidelined. If that happens, then we may not be able to match the home sales seen in 2016, which was housing’s best year in a decade.

PREPARED BY THE ECONOMIC & HOUSING RESEARCH GROUP


1 PMI calculations based on an insurance rate of 0.51%. The PMI payments would get cancelled once they reach 20% equity on their home. http://www.freddiemac.com/blog/homeownership/20170126_downpayment_math_challenge.html.