Economic, Housing and Mortgage Market Outlook – October 2024
In this Issue
- The U.S. economy remains strong with upward revisions to GDP growth as well as job growth.
- The housing market is showing some signs of thawing with the decline in mortgage rates and a slowdown in house price appreciation.
Recent developments
U.S. economy: The third estimate of Q2 seasonally adjusted annual rate of growth of Real Gross Domestic Product (GDP) released by the Bureau of Economic Analysis (BEA) was 3%, unchanged from the second estimate. Real GDP growth in the first quarter was revised up 0.2 percentage points to 1.6%. Compared to Q1 2024, the increase in Q2 GDP was driven by consumer spending and private inventory investment while residential fixed investment turned negative. Consumer spending rose 2.8 percentage points in Q2 up from the 1.9% contribution in Q1 2024.
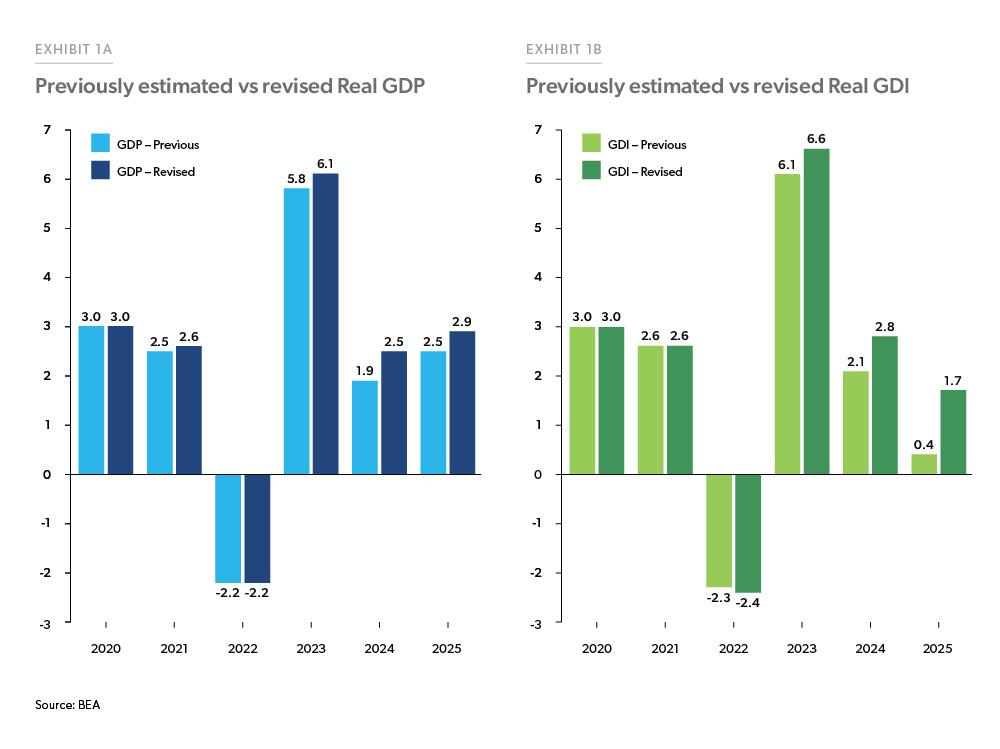
Along with the third estimate, BEA also released an annual update to the National Accounts, covering the period from Q1 2019 to Q1 2024. The revisions underscore the robustness of the U.S. economy, with the real GDP average annual growth rate revised up from 2.1% to 2.3%. Most of these revisions were driven by consumer spending. Real Gross Domestic Income (GDI), which measures the income side of economic output, had been previously estimated to be below GDP, was revised up from 1.8% to 2.2% average annual growth for the period 2018-2023. The post-pandemic GDI recovery (2021-2023) was also stronger than GDP growth in the same period. The upward revisions to GDI were mainly led by increases in employee compensation. Real personal disposable income for the years from 2021 was also revised higher as compared to the previously published estimates. The personal savings rate saw an upward revision from 3.3% to 5.2% for Q2 2024, and the revised savings rate for 2023 surpassed previous estimates.
The latest employment report from the Bureau of Labor Statistics (BLS) showed a very strong rebound in job growth, with the economy adding 254,000 payroll jobs in September and job growth for July and August revised up by a combined 72,000. With the September payroll data, the economy added a total of 1.8 million jobs in the first nine months of 2024, in line with the pre-pandemic (2016-2019) average job growth for the first nine months of the year. The unemployment rate ticked down to 4.1% with layoffs remaining low. Average hourly wage growth rose 4% on a year-over-year basis. Job growth, unemployment and wage growth all beat consensus forecasts and indicate that the U.S. labor market remains resilient.
Job openings increased from 7.7 million in July to 8 million in August, as per the Job Openings and Labor Turnover Survey of BLS. Despite a slight downward trend in job openings in recent months, the job openings to unemployed ratio was unchanged at 1.1 over the month in August. Total separations edged slightly lower to 5 million, and the separations rate decreased to 3.1%. Within this, the number of quits decreased to 3.1 million, and the quits rate decreased slightly by 0.1 percentage point to 1.9%. Layoffs were also little changed at 1.6 million and a rate of 1.0%.
Inflationary pressures have been receding over the past few months with the Federal Reserve’s preferred inflation gauge, the core Personal Consumption Expenditure (PCE) Price Index, which strips out volatile food and energy prices, rising 0.1% over the month in August and 2.7% from a year ago. Prices for goods have been leading the slowdown in overall inflation with a 0.2% monthly decline and a 0.9% yearly decline in August. On the other hand, prices for services continue to rise and were up 0.2% month-over-month and rose 3.7% from a year ago. While the Consumer Price Index (CPI) also continued to trend lower on a year-over-year basis, the shelter index increased 5.2% year-over-year and accounted for over 70% of the yearly increase in CPI.
The upward revisions to economic growth along with the revisions to job growth, reiterate the strength of the U.S. economy. With inflation on its path towards the Fed target, and the Federal Reserve’s shift in focus to the objective of maximum employment with the 0.5 percentage point rate cut in September, we reaffirm our optimism for a soft landing in our baseline scenario.
U.S. housing and mortgage market: Even with declines in mortgage rates to 2-year lows, total (new + existing) home sales declined 2.9% in August, with both existing and new home sales declining over the month. Existing home sales for August fell to the lowest level since October 2010, and new home sales fell to 716,000. Slower sales have coincided with inventory picking up. Months’ supply of existing homes was 4.2 months in August, the highest level since July 2019.
Lower mortgage rates in September helped breathe some life back into the housing market, as evidenced by the slight uptick in the pending home sales index to 70.6 from last month’s historic low of 70.2. However, in early October, the strong jobs report has pushed long-term rates, including mortgage rates, higher which will add to affordability challenges. Despite affordability challenges, the demand for housing has been bolstered by the demographic tailwind from Millennials and Gen Z, who are at prime home-buying age. We take a deeper dive on first-time homebuyers in our spotlight section this month.
Given declining mortgage rates, housing construction picked up in August. Single-family housing starts increased 15.8% from July, reversing the losses seen in July. While single-family completions fell 5.6%, multifamily completions increased 36.5% from July and almost 80% from last August. Homebuilder confidence inched up to 41, according to the National Association of Home Builders’ Housing Market Index. Though increasing for the first time in five months, the index remains below 501 indicating that building conditions are expected to remain poor in the near term.
House price appreciation continues to slow from the highs we saw in 2022. As measured by the FHFA House Price Index, U.S. house prices rose 0.1% in July 2024 and 4.5% from last year. All nine census divisions showed annual increases, ranging from 7.5% in the East North Central division to 1.6% in the West South-Central division.
While overall mortgage delinquency rates remain low as we highlighted in the September Outlook, it’s important to understand the reasons for the delinquencies. Research has found that it is usually life events which account for a larger share of defaults.2 As per the FHFA Foreclosure Prevention and Refinance Report, the top reason for delinquency as of Q2 2024 was curtailment of income at 27%.3 This was followed by excessive obligations (17%) and unemployment (15%) as of Q2 2024. Illness of the primary mortgagor or family member was also cited as a reason for delinquency at 11%. National emergency declaration, which was what had happened during COVID and was the main reason for delinquency from Q2 2020 through Q3 2023, was the least common reason in the last couple of quarters at 4%.
Mortgage rates continued to decline and reached a two-year low during the last week of September at 6.08%. The 30-year fixed-rate mortgage as measured by Freddie Mac’s Primary Mortgage Market Survey® averaged 6.18% in September. The Mortgage Bankers Association (MBA) Weekly Application Survey has shown refinance activity steadily increasing as rates continued to drop in September. Refinance activity accounted for about 55% of total application activity as of the month, a significant increase from August.
Outlook
The U.S. economy grew at a stronger pace than initially reported per the revisions of the BEA national accounts, mainly on strong consumer spending, and we expect it to continue to grow, though at a slower pace. Under our baseline scenario, we expect inflation to continue to trend lower. The Federal Reserve cut the federal funds rate by 0.5 percentage points in September and indicated further cuts of almost one percentage point in 2024 and another percentage point in 2025. Even though mortgage rates moved lower in anticipation of the rate cut, the most recent employment report has pushed rates higher in early October. Our baseline view has rates easing very gradually over time, with potential volatility as economic news may surprise the market.
Lower mortgage rates are expected to boost the housing market, but the lift will be modest given continued tightness in the existing inventory and homebuyers staying on the sidelines expecting further rate declines. We have seen some loosening in the average mortgage rate lock-in effect. The average rate lock-in effect for Freddie Mac borrowers as of September 2024 is down to $38,000 per borrower compared to the peak of $66,000 per borrower as of October 2023 when rates were at 23-year highs.4 This loosening will likely bring more existing inventory into the housing market, but not enough to accommodate growing demand. Therefore, we expect home sales to remain flat in the remainder of 2024 but pick up slightly in 2025 as rates decline further and more housing inventory comes on the market. However, we expect home prices to grow as the supply-demand imbalance remains a core issue in the housing market.
In the mortgage market, we anticipate a slight growth in origination volumes in 2024 and 2025 compared to the low volumes in 2023—which were at the lowest since 2014. We forecast purchase origination volumes to continue to increase at a modest pace consistent with modest increases in home sales and house prices. Lower rates are already stimulating refinance volumes, and we expect this trend to continue, thereby pushing up total origination volumes in 2024 and 2025.
Overall, our outlook for the economy remains optimistic. The Federal Reserve’s 0.5 percentage point cut is expected to have a positive impact on consumer spending and credit performance. However, while inflationary pressures have been declining, there are potential upside risks to inflation. One area where inflation could resurge is housing inflation in an environment where the fundamental mismatch of supply and demand remains a major challenge for the housing market.
See the October 2024 spotlight on “first-time homebuyer activity.”
Footnotes
- The NAHB Housing Market Index is a diffusion indexed constructed so that a value of 50 indicates sentiment is on balance neutral, while values above (below) 50 indicates that sentiment is on balance positive (negative).
- Ganong, P and Pascal J. Noel. 2020. “Why Do Borrowers Default on Mortgages?” NBER Working Paper 27585 http://www.nber.org/papers/w27585
- The reasons for delinquency pertain to the loans with Freddie Mac, Fannie Mae, FHA and VA.
- Rate lock-in effect is calculated by taking the difference between the outstanding balance of the mortgage and the present value of the mortgage at prevailing market interest rates. For more on rate lock-in effect please see our July 2023 Outlook.
Prepared by the Economic & Housing Research group
Sam Khater, Chief Economist
Len Kiefer, Deputy Chief Economist
Ajita Atreya, Macro & Housing Economics Manager
Rama Yanamandra, Macro & Housing Economics Manager
Penka Trentcheva, Macro & Housing Economics Senior
Genaro Villa, Macro & Housing Economics Senior
Caroline Cheatham, Finance Analyst