Macroeconomic conditions remained favorable for housing and mortgage markets in 2017. Despite challenges, the housing markets remain on track for their best year in a decade by a variety of measures. The mortgage market is transitioning from a refinance-dominated market to a purchase-dominated one, but low rates have bolstered refinance volumes this year. Let's recap the major trends in the U.S. economy, housing and mortgage markets in 2017.

Table chart of Forecast: November 2017 Snapshot

Real economy favorable for housing

Economic growth is modest, but solid job gains and low interest rates provide favorable economic conditions for housing and mortgage markets.

Economic growth picks up

Real Gross Domestic Product (GDP) grew at a three percent annual rate in the third quarter of 2017, following a 3.1 percent growth rate in the second quarter. Economic growth in this expansion remains relatively modest, averaging about two percent a quarter (Exhibit 1). Relative to prior economic expansions, the current expansion is rather weak (Exhibit 2). Nevertheless, growth has been consistently positive.

Real GDP growth and Cumulative GDP growth chart

Low inflation

Inflation remains quite low, with headline consumer price inflation averaging about two percent for the first three quarters of 2017 (Exhibit 3), but averaging about one percent over the past three years. Declining energy prices starting in late 2014 helped contain inflation rates. Core inflation, which strips away volatile food and energy prices, has been increasing a bit faster, just under two percent per year over the past three years (Exhibit 4). Low inflation has helped to keep long-term interest rates low, as we highlight below.

Headline inflation vs core inflation

Robust job growth

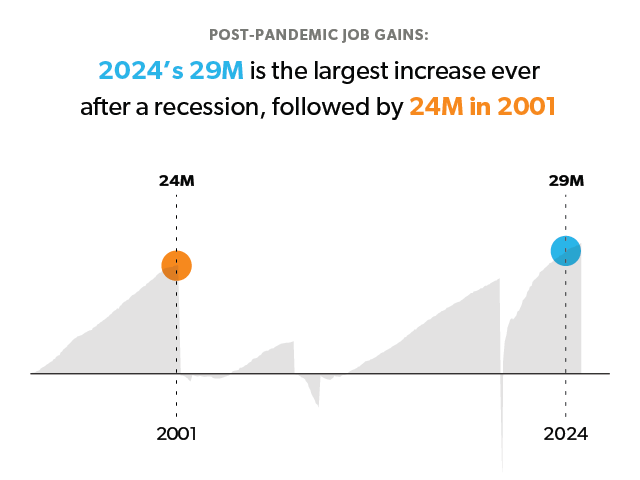
The U.S. labor market keeps chugging along. Following revisions to the estimate for September's nonfarm payrolls, the U.S. labor market has had positive month-over-month job growth for 85 consecutive months, averaging about 200,000 net job gains since 2014 (Exhibit 5). Job growth has helped push the unemployment rate down to 4.1 percent in October, the lowest level since December 2000 (Exhibit 6). Robust job gains have helped to support homebuyer demand, though the lack of an acceleration in wages remains disappointing.

Mortgage rates are low

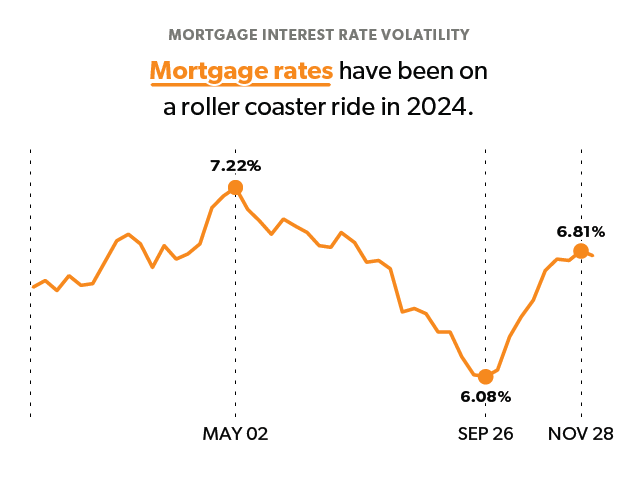
Through the first 10 months of 2017, mortgage rates remained low by historical standards (Exhibit 7). Following the U.S. general election in November of 2016, mortgage rates increased over 0.5 percentage points for the 30-year fixed mortgage and remained above four percent through the first quarter of 2017. After March rates drifted down, the 30-year fixed mortgage has remained under four percent since July (Exhibit 8). With house prices outpacing income, low mortgage rates are the one factor helping to support homebuyer affordability.

Housing markets on track for best year in a decade

Modest economic growth, robust job gains, and low interest rates make for a favorable economic environment for housing and mortgage markets. But despite the favorable environment, housing markets have stalled a bit through summer and into fall. A lack of available for-sale inventory is helping to contribute to an acceleration in home prices.

Housing construction and sales stall

Home construction and home sales got off to a good start in 2017, but stalled later in the year. Single-family housing starts kept grinding higher, but not enough to offset the sharp decline in multifamily housing starts (Exhibit 9). Home sales have been unable to keep their momentum from earlier in the year (Exhibit 10). However, due to their strong start to the year, both total home sales and housing starts are on track for their best year in a decade.

Home prices accelerate

Strong demand, low mortgage rates and a lack of for-sale inventory have contributed to accelerating house prices. Nationally, home prices increased at a 6.4 percent annualized rate over the quarter ending September 2017 (Exhibit 11). Home price growth in some markets exceeds 10 percent a year, with Washington (12.8%) and Nevada (11.3%) leading the way in 12-month percent growth in house prices (Exhibit 12). For an in-depth analysis of the factors driving house prices and whether recent rates of home price appreciation are sustainable, see our Insight “The ‘B' Word: Can we spot the next house price bubble?”

The mortgage market shifts

Mortgage originations

Bolstered by low interest rates, single-family mortgage origination volume has held up better than expected. Low mortgage rates helped refinance volumes exceed expectations. Nevertheless, as we documented in September of this year, mortgage rates don't have to increase much to dampen refinance activity. Through the first three quarters of 2017, refinance originations are down 35 percent from last year's pace. Purchase activity has partially offset the decline, but for the full year, we forecast volume to decline about 15 percent from 2016's level (Exhibit 13). For more on the mortgage market, see our September 2017 Outlook.

What's ahead in 2018 and 2019?

It's unlikely the economic environment will be much more favorable for housing and mortgage markets in 2018 and 2019. We forecast that interest rates will remain low by historical standards, but gradually creep higher over the next two years. We also forecast that housing construction will gradually pick up, helping to supply more homes to inventory-starved markets. More housing supply and modestly higher rates will lead to a moderation in house price growth. Refinance activity will drop to very low levels and the mortgage market will be dominated by purchase activity. After dropping from 2017 to 2018, the mortgage market will return to positive growth in 2019 as refinances stabilize at a low level and home purchase activity drives an expansion in overall activity.

Changes to tax policy could have potentially large effects on the economy. Considering the current level of uncertainty surrounding tax reform, we have not factored in the potential effects of recent tax plans unveiled by both the Senate and House of Representatives into our latest Outlook forecast. Estimates from different analysts show a large variation in estimated impact, based on assumptions about which provisions will be enacted and how the economy will respond. Given the uncertainty around the tax proposals and their impact on the economy, we present a baseline forecast assuming no tax changes.

REFINANCE STATISTICS


Equity extraction remains less than 25 percent of the equity extracted during the peak in 2006

Based on Freddie Mac's third quarter Quarterly Refinance Statistics, “cash-out” borrowers represented 62 percent of refinances. Though cash-out shares have been increasing in recent quarters, they are still below the peak of 89 percent in the third quarter of 2006. According to the flow-of-funds data of the Federal Reserve, home equity reached a new high of $13.9 trillion in the second quarter of 2017. That is a $1.3 trillion increase from the second quarter of 2016.

We estimate $13.5 billion (in 2016 dollars) in net home equity was cashed out in the third quarter of this year during the refinance of conventional, conforming home mortgages, up from an estimated $13.1 billion in the second quarter (Exhibit 14). This compares with a high of about $100.2 billion (in 2016 dollars) in cash-out refinance volume during the second quarter of 2006 when home equity reached $13.1 trillion. So, even if the equity extraction through cash-out refinances has been increasing, it's nowhere near the levels we saw last decade.

Borrowers cut their mortgage rate by about 14 percent, or an average interest-rate reduction of 0.6 percentage points, through refinancing. Furthermore, 31 percent of homeowners refinanced into a shorter-term fully amortizing loan, to pay down principal and build home equity faster than on their previous loan; this is down from 35 percent in the previous quarter (Exhibit 15).

Among the refinanced loans in Freddie Mac's analysis, the median appreciation of the collateral property was 15 percent over the median prior-loan life of 6.1 years. This was the highest appreciation rate since the third quarter of 2008.

More than 95 percent of refinancing borrowers chose a fixed-rate loan. Fixed-rate loans were preferred regardless of what the original loan product had been. For example, 91 percent of borrowers who had a hybrid ARM chose a fixed-rate loan during the third quarter while the remaining 9 percent chose to refinance back into a hybrid ARM.

PREPARED BY THE ECONOMIC & HOUSING RESEARCH GROUP

www.freddiemac.com/research