


Racial and Ethnic Valuation Gaps In Home Purchase Appraisals
To follow up on several stories of potential purchase appraisal1 bias in various news outlets,2 Freddie Mac kicked off a study of whether minorities are more likely to receive an appraisal value that is lower than the contract price during purchase transactions.3
First, we examine the raw differences in the percentage of properties that receive an appraisal value lower than the contract price in minority tracts compared to those in White tracts4. We find substantial appraisal valuation gaps5 for minority versus White tracts. Second, we examine the raw differences in the percentage of applicants that receive an appraisal value lower than the contract price and find that minority applicants are more likely to receive an appraisal value lower than the contract price.
After observing these gaps, we conduct exploratory research to begin to understand what causes the valuation gaps for minority versus White tracts. In the third section, we test whether the observed gaps are driven by only a few appraisers. Our analysis shows gaps for a large fraction of appraisers who provide valuations in both minority and White tracts. In the fourth section, we explore several possible explanations for the observed appraisal gaps in minority neighborhoods. Our research shows that differences in comparable sale (or comp6) distances, comp reconciliation7, variances in sale prices of comps, and possible systematic overpayment for properties by minorities cannot explain the appraisal gaps for minority tracts observed in our data. Finally, in the fifth section we build models to test whether the minority tract flag based on the minority concentration in the tract explains appraisal gaps beyond structural and neighborhood characteristics. Our preliminary modeling results suggest that a property is more likely to receive an appraisal lower than the contract price if it is in a minority tract.
Introduction
An appraisal is meant to opine on the market value of a home, so that lenders have adequate collateral for the loan. The focus of our research is to study whether the appraisal outcome is different for minority groups versus the White group. Our research is based on two assumptions: (1) markets for home sales are functioning well, regardless of the share of minority people living in a neighborhood; and (2) the contract price is a reasonable benchmark in purchase transactions8. With these assumptions, we compare the appraisal value to the contract price, which we take as the benchmark in purchase transactions. In this Research Note, we use the term "appraisal value lower than contract price" to refer to appraised values that are lower than the contract price for home purchases.
We analyze the percentage of properties or applicants receiving "appraisal value lower than contract price." The metric is calculated separately for Black and Latino versus White groups. The term "appraisal gap" has been used in various papers with varying meanings. For the purpose of this Research Note, an “appraisal gap” means the percent difference in the share of properties or applicants receiving “appraisal value lower than contract price” between minority and White groups. A positive gap means that a minority group is more likely to receive an appraised value lower than contract price relative to the White group. We focus on four race and ethnicity groups for this analysis: Black, Latino, White, and Overall. When examining whether appraisal gaps exist, we consider the race and ethnicity of both the tracts in which the properties being appraised are located and of the applicants applying for a loan to buy the property.
1. Is there an appraisal gap in minority neighborhoods?
Appraisers' opinions of value are more likely to fall below the contract price in Black and Latino census tracts, and the extent of the gap increases as the percentage of Black or Latino people in the tract increases.
We examine the appraisal outcomes for properties in Black and Latino tracts versus those in White tracts. Tracts are classified according to the minority share of the population in that tract according to the 2010 census data. We use 50% as the threshold to define minority tracts. Specifically, if the share of Black (or Latino) people in a tract is 50% or more, this tract is categorized as Black (or Latino). In addition, to see how the gaps change as the share of minority people increases, we further classify Black (or Latino) tracts as follows:
- [50%-80%] if the Black (or Latino) share is ≥ 50% and < 80%
- [80%-100%] if the Black (or Latino) share is ≥ 80%.
If the overall minority share9 in a tract is below 50%, the tract is flagged as White.
Exhibit 1, based on data for more than 12 million appraisals for purchase transactions submitted to Freddie Mac from January 1, 2015, to December 31, 2020 through the Uniform Collateral Data Portal (UCDP),10 shows that properties in Black and Latino tracts receive appraisal values lower than the contract price more often than those in White tracts. If the minority group has a higher percent than the White group, that gap is highlighted in orange, indicating an unfavorable outcome for that minority group. For example, 12.5% of the properties in Black tracts receive "appraisal value lower than contract price," compared to 7.4% for those in White tracts, leading to a gap of 5.2%.
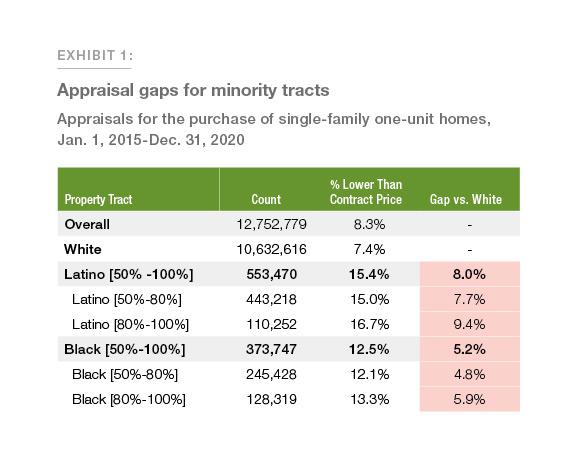
In addition, as the concentration of Black or Latino in a census tract increases, the appraisal valuation gap increases. For example, the gap for properties in Latino tracts increases from 7.7% in the [50%-80%] bucket to 9.4% in the [80%-100%] bucket.
To check whether the appraisal gap patterns in Exhibit 1 are consistent and robust, we perform numerous robustness checks from different perspectives, including by appraisal type (appraisal with interior inspection vs. exterior-only inspection or desktop—no on-site inspection); by occupancy type (owner, tenant, vacant); by property condition, by housing trend indicated in the appraisal report (stable, increasing, declining); and by urbanization level (urban, suburban, rural). In addition, we analyze the top 30 Metropolitan Statistical Areas (MSAs). The patterns we see based on the aggregate national data in Exhibit 1 mostly persist; thus, the appraisal gaps seem pervasive.
2. Is there an appraisal gap for minority applicants?
Black and Latino applicants receive lower appraisal values than the contract price more often than White applicants.
In this section, we use the minority status designated by applicants on their mortgage applications to examine the difference between Black and Latino applicants and White applicants. In purchase transactions, appraisals are completed on sellers' properties, but the information on race and ethnicity is collected from borrowers. This data limitation can potentially result in an underestimation of the appraisal gap. For example, if a Black homeowner's property is valued less than the benchmark and later sold to a White borrower, this transaction will be categorized as "White" instead of "Black" in our dataset. We hope to address this data limitation in future research.
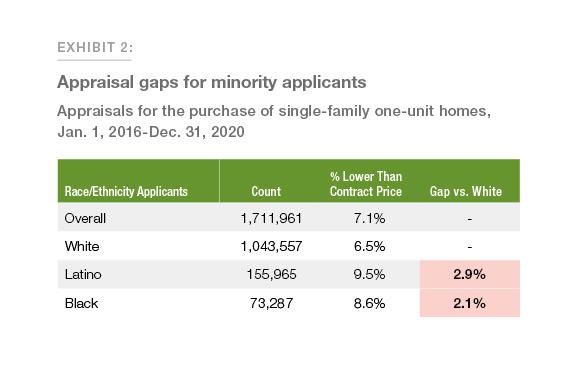
Exhibit 2 is based on a dataset we generate by merging the 12+ million appraisals from UCDP used in the first section with loan application data submitted to Freddie Mac. This merge reduces the UCDP dataset from 12+ million to less than 2 million (due to missing values in the merge field and thus a low merge rate) and includes appraisals from 2016 to 2020 instead of the original time period (2015 to 2020). Exhibit 2 shows that Black and Latino applicants receive “appraisal value lower than contract price” more often than White applicants. For example, 9.5% of the Latino applicants receive “appraisal value lower than contract price”, compared to 6.5% of White applicants, resulting in a gap of 2.9%.
3. Are the appraisal gaps for minority tracts driven by only a small fraction of appraisers?
An analysis of the group of appraisers with enough observations in both minority tracts and White tracts to yield valid t-statistics reveals that a large portion of appraisers are generating statistically significant gaps11.
To know whether a small fraction of appraisers is generating the observed gaps, we calculate the gaps for each individual appraiser who submitted appraisals for properties in both minority tracts and White tracts. In addition, we perform one-sided t-tests to examine which gaps are statistically larger than zero.
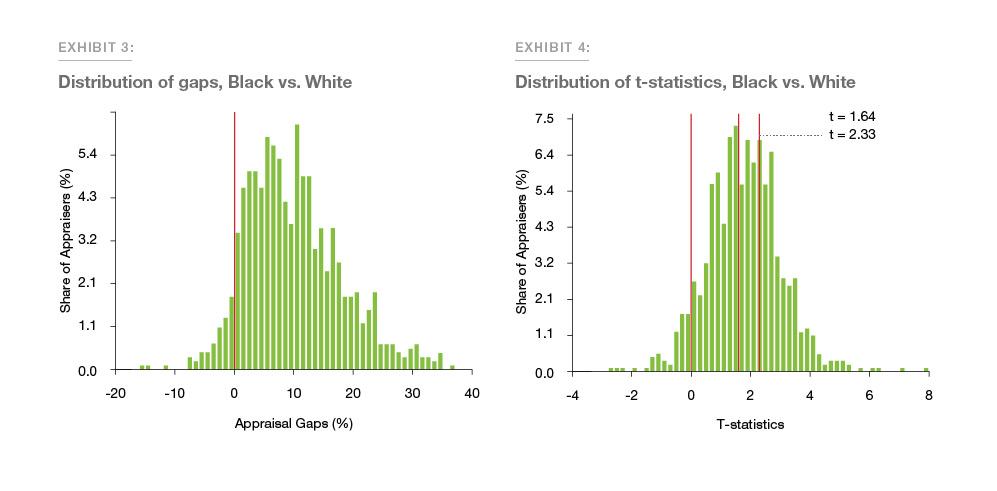
Based on our dataset, 21,058 appraisers submitted appraisal reports in both Black and White tracts; out of this group, 934 appraisers have statistical power and qualify as the Black versus White sample for t-test. Exhibit 3 shows the distribution of the 934 appraisers’ gaps. The x-axis shows the appraisal gap, and the y-axis presents the percentage of the 934 appraisers who exhibit that gap. For example, looking at the 10% appraisal gap bar, about 6% of the 934 appraisers had appraisal reports that show a Black versus White gap of 10%. According to Exhibit 3, the distribution of the 934 appraisers’ gaps is skewed to the right since the majority of appraisers show positive appraisal gaps. This differs from the case of unbiased appraisals, where about half of the appraisers would show negative estimated gaps and the other half show positive estimated gaps.
Exhibit 4 presents the distribution of the t-statistics of the 934 appraisers' appraisal gaps12. The t-statistic can tell whether the gap is statistically significant. According to Exhibit 4, the gaps are significantly larger than zero for 54% (502 / 934) of the appraisers at the 5% significance level, and for 31% (293 / 934) of the appraisers at the 1% significance level. These results suggest that a large portion of appraisers who performed enough appraisals in both Black and White tracts exhibit statistically significant Black versus White gaps.
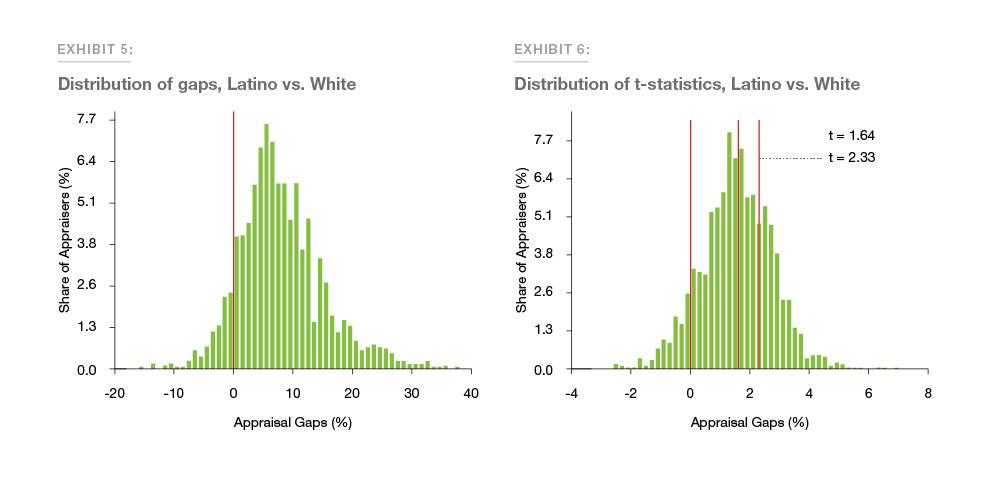
Our dataset includes 18,908 appraisers who submitted appraisal reports in both Latino and White tracts; out of this group, 1,560 appraisers have statistical power and qualify as the Latino versus White sample for t-tests. Exhibit 5 shows the distribution of the 1,560 appraisers' gaps, which is skewed to the right. Exhibit 6 shows the distribution of their t-statistics. The gaps are significantly larger than zero for 47% ( 729 /1,560 ) of the appraisers at the 5% significance level, and for 27% (423 / 1,560) of the appraisers at the 1% significance level. These results suggest that a large portion of appraisers who performed enough appraisals in both Latino and White tracts exhibit statistically significant Latino versus White gaps.
4. What causes the appraisal gap?
We conduct exploratory research to begin to understand what causes the observed gaps for minority versus White tracts. We focus our research on the fact that appraisers primarily determine the appraisal value of a property by comparing the historical sale prices of comps. By leveraging our in-house appraiser and appraisal expertise and through discussions with researchers who are experts on this topic,13 we identified several candidate factors and explored them in isolation, including comp distance, comp reconciliation, comp variance, and purchaser overpayment.
In addition to this exploratory research, in section 5 we also use a model-based approach to examine whether gaps still exist for minority tracts after adjusting for property and neighborhood characteristics.
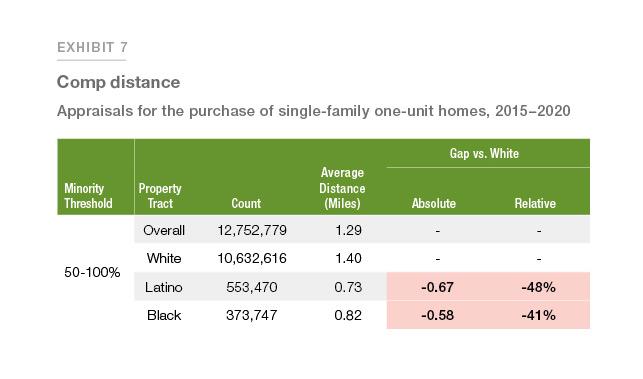
Comp distance
The average distance between a subject property and its comps is substantially smaller when the property is in a Black or Latino tract than in a White tract.
We define "comp distance" as the average distance in miles between the subject property and the comps listed on the appraisal report. It is calculated as  , where n refers to the number of comps. Exhibit 7 shows that the average comp distance is much smaller when the property is in a Black or Latino tract than in a White tract. For example, the average distance for properties in a Latino tract is 0.73 miles, compared to 1.40 miles in a White tract, resulting in a negative gap of 0.67 miles. On a relative basis, this negative gap is 48% (0.67/1.40). We also sort the data into urban, suburban, and rural subsets to check whether the overall pattern in Exhibit 7 persists. We find that the patterns are consistent in both urban and suburban areas.
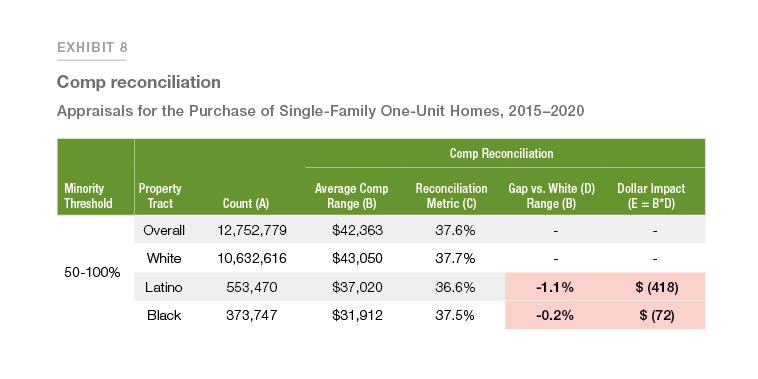
Comp reconciliation
Properties in Black and Latino tracts tend to be reconciled toward the lower end of the comp range compared to those in White tracts, although the dollarized impact is small.
The "comp reconciliation” metric is defined as 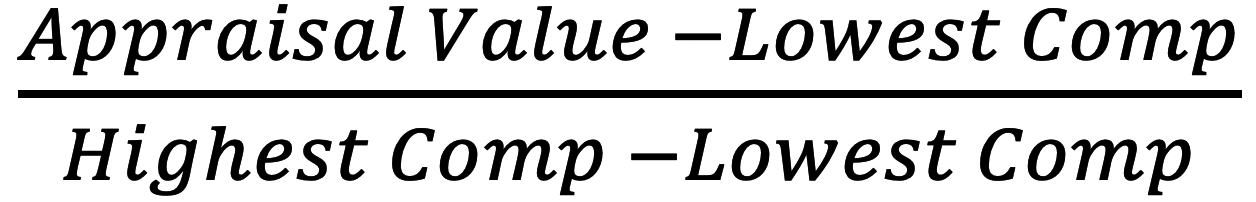 , where the "Highest (Lowest) Comp" refers to the highest (lowest) "Adjusted Sales Price"14 of comps on the appraisal report. Taking the difference between the highest and the lowest Adjusted Sales Price of the comps as the range, it measures how far away the appraisal value is from the lowest comp expressed as a percentage of the range. The higher the metric (%), the farther it is away from the lowest comp and thus the higher in the range. Given that the comp approach is what appraisers use primarily to determine appraisal values, it is important to check whether appraisal values tend to be in the lower end of the Adjusted Sales Price range of the comps when a property is in a minority tract as compared to a White tract. Exhibit 8 shows that appraisals for properties in Black and Latino tracts tend to be slightly closer to the lower end of the comp range. However, the average dollar impact is less than $500.
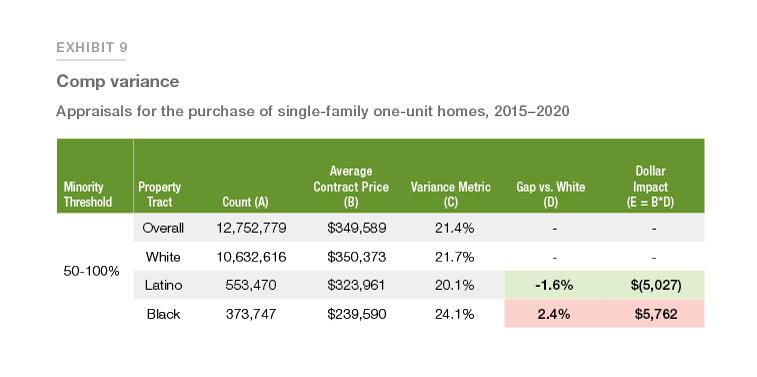
Comp variance
There is more variation in the sales price of comps used in appraisals for properties in Black tracts than White tracts, but there is less variation for Latino tracts.
The "comp variance" metric is defined as 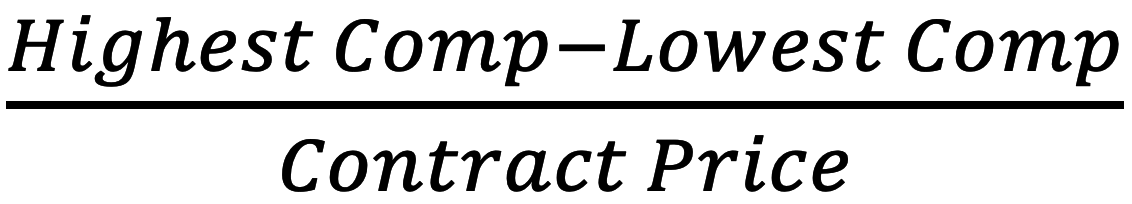 , where the "Highest (Lowest) Comp" refers to the highest (lowest) sales price of the comps. It measures the difference between the highest and the lowest sales price of the comps expressed as a percentage of the contract price. The higher the metric (the higher the percent), the larger the variance. Given the heterogeneity of minority neighborhoods (Lee, 2018), we want to examine whether there is more variation in the sales prices within comps used in appraisals for properties in minority tracts than in White tracts.
Exhibit 9 shows that there is more variation in sales prices for comps used in appraisals for properties in Black tracts than in White tracts; however, there is less variation in Latino tracts. No matter whether there is more or less variation, the average dollar impact of these gaps is less than $6,000.
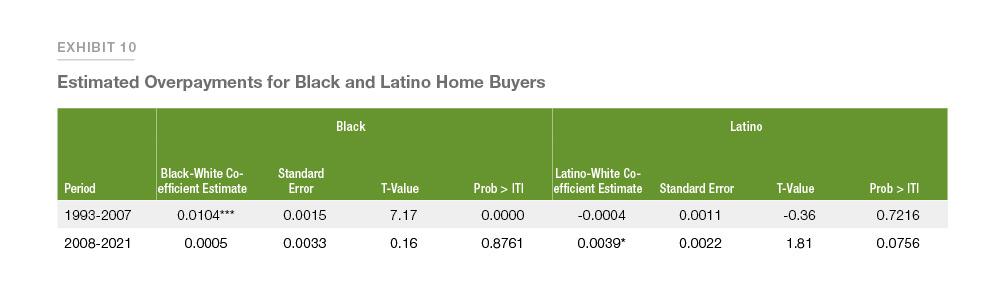
Purchaser overpayment
The estimates of overpayment by Black and Latino home buyers are modest, and consequently would not explain the observed appraisal gaps.
One possible explanation of the differential rate of appraised values being below sales prices is that on average Black and Latino buyers pay more for similar properties than White buyers when purchasing a home. To examine this possibility, we compare and compute differences in the sales prices that buyers of different races and ethnicities pay for comparable housing during the same time period.
The data used in this exercise are from Freddie Mac's mortgages funded from January 1993 to June 2021 for the purchase of owner-occupied properties. We include properties that were sold at least twice during that period and excluded properties where subsequent sales occurred within 36 months. The final data set we analyze has 2,965,495 observations and 36.3% of these are of transaction pairs that span mixed racial/ethnic groups. Also, of the 72,568 census tracts covered by our sample about 86% have transaction pairs that span mixed racial/ethnic groups.
A challenge in this exercise is to properly account for unobserved changes in housing quality over time and housing quality differences across race and ethnicity. To address this, we implement a repeat-sales approach that controls for unobserved housing quality to better isolate racial and ethnic differences in sales prices for comparable homes. We estimate the following equation:15  where
where  is the sale price for buyer i purchasing property j in the census tract n at time t;
  is a vector of indicators for the race and ethnicity of the buyer at time t (White being the base category); is a house-specific fixed effect that controls for changes in house quality over time, and ensures that house price changes are computed for the same properties using the first and second transaction prices;
  denotes a set of fixed effects per census tract over time and allows us to control for tract-level house price changes during the same period; and measures the average premium (or discount) paid by Black and Latino buyers relative to White buyers.
Exhibit 10 reports that the estimated overpayment for Black and Latino home buyers are materially different starting in 2008. Black buyers are estimated to pay 0.05% more than White buyers when buying a home, based on data starting in 2008, but this difference is statistically insignificant16. Similarly, Latino home buyers are estimated to pay 0.39% more than White buyers, based on data starting in 2008. These estimated premiums are small and would not explain the observed appraisal gaps17.
To summarize the results from this section, the factors we have explored explain only a modest amount of the observed gaps.
5. Does the race and ethnicity tract flag explain appraisal gaps beyond structural and neighborhood characteristics?
Our preliminary modeling results suggest that even when taking structural and neighborhood characteristics into consideration, a property is more likely to receive an appraisal lower than the contract price if it is in a minority tract.
It is possible that the appraisal gaps observed in our data could be caused by variations in the characteristics of the properties or neighborhoods. To examine this possibility, we adopt a modeling approach that controls for both property and neighborhood characteristics, thus isolating the effect of racial and ethnic differences in the likelihood of receiving an “appraisal value lower than contract price” for comparable homes. In addition, we control for appraiser fixed effects to remove the impact from random appraiser behaviors.18
We estimate a Light Gradient Boosted Machine (LightGBM) model and an Ordinary Least Square (OLS) model based on the 12+ million appraisals. Our preliminary modeling results indicate that the flags for Black and Latino tracts are significant and the coefficient is positive, which means that a property is more likely to receive an "appraisal value lower than contract price" if it is in a Black or Latino tract. For robustness checks, we estimate a Logistic Regression model and an OLS model based only on the reports submitted by appraisers who have enough reports in both minority (Black or Latino) and White tracts. The model results based on this subset are consistent: that is, a property is more likely to receive an "appraisal value lower than contract price" if it is in a Black or Latino tract than if it is in a White tract.
Implications for further research and housing industry practice
The Freddie Mac research clearly indicates that the topic of a potential appraisal gap is worthy of considerable research. We are committed to building solutions in the following ways. First, our analysis has not yet determined the full root cause of the gap; we plan to continue our research to better understand the key drivers contributing to the gap and share findings with the industry. Second, we continue to explore opportunities to leverage various data collection methods, robust data driven analytics and supporting tools to create new approaches across the valuation spectrum. We are testing whether alternatives to traditional appraisals offer a more objective analysis of property value.
Third, Freddie Mac is a core partner in the Appraisal Institute's19 Appraiser Diversity Initiative, which commits to building a more diverse next generation of appraisers. Fourth, we are part of the Office of the Comptroller of the Currency’s Project REACh initiative, dedicated to financial inclusion through enhanced access to capital.20 Our participation in Project REACh’s appraisal working group is a core component of our commitment.
Finally, we join the industry in exploring several emerging potential solutions. Potential solutions may include a review of appraisal best practices, defining uniform standards for AVMs, addressing consumer disclosure and reconsideration of value processes, and revising fair lending exam procedures and risk assessments.
This Research Note aims to share what we have learned so far. It is also a call to the housing industry to help identify root causes and potential viable solutions that can achieve more consistent valuation outcomes across communities.
References
1 A purchase appraisal is one where the "assignment type" on the appraisal form is for a purchase transaction.
2 "Black Homeowners Face Discrimination in Appraisals," August 25, 2020, The New York Times.
"An Unconscious Bias? Biracial Denver Couple Says They Faced Discrimination on Home Appraisal," November 18, 2020, Denver7.
3 This study focuses on two minority groups, Black and Latino, with the White non-Latino group as the reference. The term "minority" refers to Black or Latino and the term “White” refers to White non-Latino throughout this Research Note.
4 Tracts refer to census tracts. They are small subdivisions within a county typically containing between 1,200 and 8,000 people. In this Research Note, the word "neighborhood" and "tract" are interchangeable.
5 For the purposes of this Research Note, an "appraisal gap" means the percent difference between minority and White groups in the share of properties or applicants receiving "appraisal value lower than contract price."
6 In a residential appraisal, the value is developed primarily by examining other competitive homes that have been sold recently. Those sales are called "comparable sales," commonly called "comps."
7 "Reconciliation" refers to the process used by the appraiser to weight the conclusions of the individual comparable sales and derive a final opinion on the home value.
8 We acknowledge that the sale price is not always equal to market value, and we expect that in all areas some appraisals will report values lower than the contract price. However, research data indicate that a high percentage of appraisals are at or above the purchase contract price (Calem, Lambie-Hanson, and Nakamura, 2017).
9 Anyone who is not White non-Latino is counted in the overall minority group.
10 When there are multiple submissions in the UCDP, this analysis uses the first appraisal. We exclude non–arm-length transactions (i.e., a non-arms-length sale is a sale between related parties), contracts with a concession amount exceeding 3%, and appraisal values or property features outside of the normal range (for example, properties with more than ten bedrooms or more than four stories).
11 Conditions for t-statistics to be valid are as follows: MIN {N1*P1, N1*(1-P1)}>=10 and MIN {N2*P2, N2*(1-P2)}>=10 where N1 =Number of appraisals in Black tracts, P1=Percent of appraisals that have a value lower than the contract price in Black tracts, N2=Number of appraisals in White tracts, P2=Percent of appraisals that have a value lower than the contract price in White tracts.
12 The results in Exhibit 4 and Exhibit 6 are based on the unpooled t-test of proportions in which the variance is calculated separately for each group. We have also performed the pooled t-test and observed very similar results.
13 We thank experts at Better Mortgage, the Urban Institute, and the Brookings Institution for sharing their insights.
14 The appraiser generates the Adjusted Sales Price by comparing the comp to the subject property that is being appraised.
15 This analysis uses the approach described in Bayer et al. (2017).
16 Bayer et al. (2017) examined Chicago, San Francisco, Baltimore/Washington, DC, and Los Angeles using data from 1990 to 2006 and found an overpayment of 1.6% for Black buyers. We estimated a Black-White gap of 1% based on the 1993 to 2007 period.
17 We also examined estimates of overpayment at the MSA level and by share of minorities in the census tract and found no evidence supporting differential biases by MSA. Because even a small overpayment might lead to a false positive result and an overstatement of the appraisal gap, we checked the robustness of the earlier findings by imposing a larger overpayment adjustment of 0.5% and found qualitatively similar results to those in Exhibits 3 and 4.
18 In modeling, "control for appraiser fixed effects" means creating dummy variables for individual appraisers and including them in the model estimation process.
19 Our commitment to the Appraiser Diversity Institute can be found here: JPMorgan Chase commits $3 million to appraiser diversity - HousingWire
20 An overview of the OCC’s Project REACh's can be viewed here:https://occ.gov/topics/consumers-and-communities/ minority-outreach/project-reach.html.
Bayer, P., M. Casey, F. Ferreira, and R. McMillan. 2017. "Racial and Ethnic Price Differentials in the Housing Market." Journal of Urban Economics 102: 91–105.
Calem, P. S., L. Lambie-Hanson, and L. I. Nakamura. 2017. "Appraising Home Purchase Appraisals." Working Paper No. 17-23, Federal Reserve Bank of Philadelphia.
Lee, C. A. 2018. "Heterogeneity in Income: Effects of Racial Concentration on Foreclosures in Los Angeles." Housing Policy Debate 28 (6): 940–62.
Prepared by the following groups: Modeling, Econometrics, Data Science & Analytics; Single-Family Risk Management; and Economic & Housing Research
Melissa Narragon, Senior Director of Fair Lending Analytics, Modeling, Econometrics, Data Science & Analytics
Danny Wiley, Senior Director of Single Family Property Valuation, Single Family Risk Management
Doug McManus, Director of Financial Research, Economic & Housing Research Group
Vivian Li, Senior Manager of Fair Lending Analytics, Modeling, Econometrics, Data Science & Analytics
Kangli Li, Quantitative Analytics Senior, Modeling, Econometrics, Data Science & Analytics
Xue Wu, Quantitative Analytics Senior, Modeling, Econometrics, Data Science & Analytics
Kadiri Karamon, Macro Housing Economics Senior, Economic & Housing Research Group