Freddie Mac First-Time Homebuyer Affordability Map: A Novel Approach to Measure Affordability for Future Borrowers
First-time homebuyers play a critical role in sustaining the housing ecosystem. Unlike repeat homebuyers who have more robust credit history, first-time homebuyers may not qualify for the best mortgage rates in the market. Moreover, they tend to be younger and hence have lower income and savings, which further fuels the challenge of housing affordability. In this research, we build a new methodology to evaluate the local affordability for future first-time homebuyers. Our unique approach enables us to calibrate the affordability measure by race and various income groups, through which we uncover some unexpected patterns.
Introduction
First-time homebuyers play a critical role in sustaining the housing ecosystem. According to Bai, Zhu and Goodman (2015), they allow current homeowners to sell and move to a new town, a new job, a retirement community, or upgrade to a bigger house. Even during the pandemic, the share of first-time homebuyers remained strong at 31 percent according to the National Association of Realtors (NAR). As the economy slowly recovers from the pandemic, affordability for future first-time homebuyers is ambiguous. While mortgage interest rates remained historically low during the pandemic, they’re quickly climbing and other factors such as a weak labor market, higher house prices, very low inventory and student loan debt obligations, will make it challenging for future borrowers to transition into homeownership. While the fiscal stimulus aid may have mitigated the impact of the financial shock on future borrowers somewhat, it is still relatively difficult for borrowers without high credit to obtain conventional mortgages.1 Furthermore, as the nation is recovering, the speed of recovery will vary across localities, making local affordability for future first-time homebuyers even more uncertain.
In this research, we propose a new methodology to evaluate the local affordability for future borrowers based on their credit characteristics and income distribution. The Freddie Mac First-Time Homebuyer Affordability Map (FFTHAM) was developed using uniquely constructed anonymized administrative datasets that measure how many creditworthy renters have enough income to purchase a home that was bought by a recent first-time homebuyer with a comparable credit profile in the area. In addition, our map allows us to specifically investigate the local affordability by race and various income groups. For example, we can examine the local affordability for the low- to moderate-income (LMI) creditworthy population who are generally more challenged to find affordable housing options in their areas.2 Lastly, our map measures affordability over the last decade (i.e., 2012-2020) and allows us to track the extent to which economic shocks, such as the current pandemic, have impacted the local affordability for future borrowers, especially for low income and minority families.
Our FFTHAM rank orders cities into four different affordability categories by income: 1) typically affordable, such as Knoxville, TN, 2) typically unaffordable, such as San Francisco, CA, 3) affordable overall but not affordable to its LMI population, and 4) unaffordable overall but affordable to its LMI population. In particular, we found that there could be material gaps between the affordability for LMI populations and overall population in some areas. For example, certain southern metropolitan statistical areas (MSAs), such as El Paso, TX, that appear overall affordable are unaffordable to their LMI population, predominantly due to their low area median income, making it very challenging for LMI families to afford a home in these cities. In contrast, certain coastal cities such as Baltimore, MD that appear to be overall unaffordable, are affordable to their LMI families, likely due to the availability of many relatively affordable housing options in the area.
Our FFTHAM by race/ethnicity shows that, for a given metro area, creditworthy renters who are White are more likely to have higher affordability than their counterparts who are Hispanic Americans or Black Americans. Furthermore, affordability has declined over time for most future borrowers regardless of race/ethnicity. In particular, Hispanic Americans living in high-cost coastal cities have experienced a sharp decline in affordability since 2012. Lastly, the pandemic crisis triggered a decline in affordability in most cities, likely due to a surge in demand and lack of inventory.
A variety of indexes exist to help us better understand the affordability challenges in the country.3 Common industry level affordability metrics focus on median income and median house prices and are based on the entire population, which includes both renters and homeowners. Very few affordability indexes focus on low-income households. Several authors have pointed out that affordability is a bigger concern in the lower end of the income distribution (Gan and Hill, 2009; Jewkes and Delgadillo, 2010). Quigley and Raphael (2004) show that there is little evidence supporting that housing has become less affordable to a median homeowner or renter in recent years. However, there has been a pronounced increase in the rent burden of low and very-low-income households, adding more constraints to their homeownership potential. Urban Institute’s Housing Affordability for Renters Index (HARI) address some of these shortcomings by considering the entire income distribution rather than the median household. Furthermore, the Urban Institute index evaluates the potential of only the renter population to become first-time homebuyers, which is more forward looking than existing indices.
Our FFTHAM builds upon existing industry statistics and compares the entire income distribution of recent first-time homebuyer and creditworthy renter populations in assessing who can afford a house. To be precise, our map offers improvement on existing methodologies in three ways. First, our unique dataset obtained from a credit bureau allows us to account for credit scores and simple underwriting standards to identify “Mortgage Ready” or creditworthy renters.4 Renters’ creditworthiness not only impacts their ability to secure a mortgage, but also to make their monthly payments (Fannie Mae, 2015). By purging the renters with lower credit scores, higher debt-to-income ratios, and derogatory credit histories, we are able to align our renter population more closely with future borrowers as opposed to HARI, which includes all renters as potential first-time homebuyers. Moreover, our map allows us to investigate how affordability for creditworthy renters varies by various minority and/or income groups and over time.
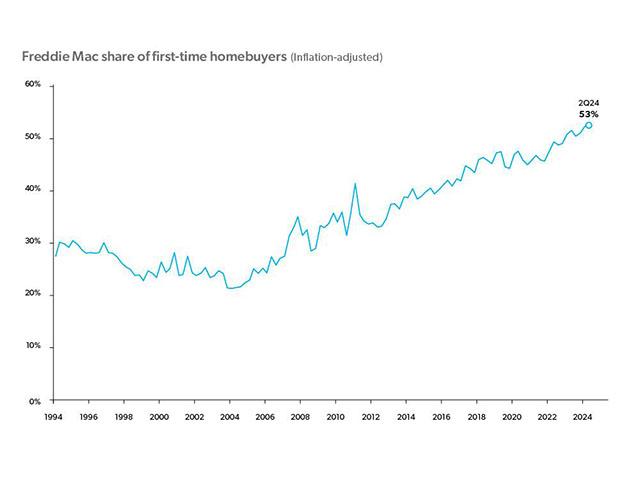
Second, we assess home affordability for current renters based on only those consumers that have recently purchased their first home as a primary residence, unlike HARI, which is based on all recent homeowners. According to Bai, Zhu and Goodman (2015), an average first-time homebuyer is more likely to have smaller loan size, lower credit scores, higher loan-to-value and debt-to-income ratios, thus obtaining higher interest rates compared to an average repeat buyer. This implies we may overestimate the affordability of homes for future borrowers based on recent activities by repeat purchasers. We assume first-time home purchasers, who generally have less experience in the mortgage process relative to repeat borrowers, better represent the future borrowers. Using loan-level data from the National Mortgage Database (NMDB), we define first-time homebuyers as borrowers who have not a had a mortgage in the preceding seven years (see Consumer Financial Protection Bureau report). Exhibit 1 gives the share of home purchase loans originated for first-time homebuyers each year since 2010. First-time homebuyers comprise more than 50 percent of the purchase market coming out of the financial crisis and are crucial for driving future homeownership rates.5 By precisely estimating this sub-group, we are able to make an apples-to-apples comparison of homeownership potential of future borrowers. It can also serve as leading indicator of local trends in homeownership rate. To our knowledge, we are the first to develop a forward-looking affordability measure for creditworthy renters based on information of recent first-time homebuyers. Our map can serve as a leading indicator of future homeownership rates by various localities.

Enlarge Image
Lastly, unlike most indexes and tools, our focus is on evaluating the local affordability by various sub-populations. We calibrate the affordability map of renters based on their income relative to the area median income to compare the affordability of LMI across cities. An area that appears to be overall affordable may not be affordable to its LMI population, especially if it is a high-cost area with a low Area Median Income (AMI). Local affordability can serve as indicators for future homeownership and foreclosures. Wang and Immergluck (2019) investigate the relationship between location affordability, a measure of housing and transportation affordability combined, and foreclosure resilience across metropolitan areas post-financial crisis. They find foreclosure rates dropped substantially in high-density areas where location affordability is high, but not in low-density areas.
Literature Review
Most of the housing affordability map metrics are constructed by comparing the amount a household can afford for housing to the cost of housing. If the affordable amount is bigger than the cost, then it indicates affordability.
One of the most widely used approaches is the ratio approach. It is based on the idea that if a household pays more for housing than a certain percentage of its income, then it will not have enough to meet for other non-housing needs. In the definitional terminology used by the United States Department of Housing and Urban Development (HUD) if total annual housing costs, including principal and interest payments on the mortgage, property taxes, utilities and insurance, exceed 30 percent of gross annual income, then the household is “housing cost burdened.” HUD’s measure is widely used as a legislative and regulatory standard to qualify applicants for housing assistance, such as allocation of low-income tax credits and housing vouchers. The National Low-Income Housing Coalition uses information from HUD to develop Housing Wage that estimates a worker’s ability to afford the Fair Market Rent in a given area (Pelletiere, 2008). Despite that, HUD’s measure is criticized as it fails to take into consideration cost-of-living variables or control for quality of housing over time (Bogdon & Can, 1997; Linneman & Megbolugbe, 1992, Pelletiere, 2010, Jewkes and Delgadillo, 2010).
Other popular industry measures of affordability are as follows. NAR’s Housing Affordability Index is an indicator of housing affordability that measures whether or not a typical family could qualify for a mortgage loan on a typical home, under the assumption of 20 percent down payment and that the monthly principal and interest payment on the mortgage does not exceed 25 percent of the median family monthly income (Linneman & Megbolugbe, 1992). The National Association of Home Builders (NAHB)/Wells Fargo Home Opportunity Index and the California Association of Realtors (CAR) Housing Affordability Index are based on the share of available affordable housing stock for typical families. They assume 28 percent and 30 percent, respectively, of gross area median income as the affordable amount for a typical family and consider property taxes and property insurance for a home in a given area along with the mortgage payment. Bourassa and Haurin (2016) improvised on NAR and NAHB indexes by developing an index that includes income tax deductions for mortgage interest and property taxes as well as accounts for the effect of expected house price changes on affordability of housing. Recently, the Federal Housing Finance Agency developed its affordability index, which estimates a unique affordable ratio for each MSA by extracting expenditure from income using detailed data sources (see Chung et al, 2018). They consider debt and funds available for down payment, as well as future growth in income, house price and expenses.6
Both NAR and CAR affordability indexes have variants focusing on affordability of first-time homebuyers. In particular, NAR’s First-Time Homebuyer Index, HAI, is a scaled-down version of its general HAI, since it is based on 85 percent of median house prices, 65 percent of median income, 10 percent down payment and corresponding primary mortgage insurance premium.7 By contrast, CAR’s First-Time Homebuyer HAI assumes adjustable mortgage rates with accompanying points and fees and qualifying income ratio at 40 percent. Related to these, Goldman Sachs developed a methodology to assess the affordability of “marginal borrowers,” who lack the incomes and credit scores to qualify for low mortgage rates.8
A second approach of measuring housing affordability is the residual income approach, which is based on the idea that households have affordability issues if they cannot meet a threshold of non-housing consumption after covering their housing costs. These thresholds vary by level of income, household size and household types. Stone (1990, 1993, 2006) introduced the term “Shelter Poverty” as occurring when housing costs are so high that households cannot afford non-housing necessities under the Bureau of Labor Statistics low-budget standards. Kutty (2005) introduces “housing-induced poverty,” which is based on the minimum of non-housing consumption at two-third of the U.S. Census Bureau’s poverty threshold.9 The VA home loan program uses residual income as a credit underwriting factor to determine the cost burden on potential borrowers (see VA Pamphlet 26-7).10 Herbert, Hermann and McCue (2018) show that while the residual income approach yields comparable results to simple measures like HUD’s 30 percent of income standard for overall levels of affordability, it does a better job in gauging housing affordability challenges for high-cost markets and for higher-income and smaller households.
A third approach involves amenity-based affordability indexes, which incorporate certain location-based amenities in housing cost estimates. Fisher, Pollakowski and Zabel (2009) adjust their affordability index to account for town-specific amenities such as job accessibility, school quality and safety. They use a hedonic price equation to estimate implicit prices of these amenities. Their index focuses on the new entrants to the market, specifically households earning 50 percent or more of AMI.11 HUD and Department of Transportation’s Location Affordability Index uses a statistical modeling framework that considers other factors, such as car and transit usage, as potentially related to things that may drive affordability as well as important determinants of affordability at the census tract level12.
Lastly, the Urban Institute’s Housing Affordability for Renters Index (HARI) is based on income distribution and has fewer assumptions than approaches discussed above (Goodman, Li, and Zhu 2018). It does not assume or estimate the percentage of the income that can be spent on housing. It also does not use the area median income and median house price to calculate the affordable income and housing cost. Instead, it measures how many renters have enough income to purchase a home by comparing renters’ income distribution to recent borrowers’ income distribution. If a renter has income greater than or equal to the income earned by households who recently purchased a home using a mortgage, then this renter can afford a house in the area. Using this methodology, HARI can be constructed at various geographic levels to understand how affordable an area is for renters already living in the area compared to renters outside the area (Goodman and Zhu, 2019, 2020).
Data and Methodology
To identify creditworthy renters, we use a uniquely constructed consumer credit dataset that combines anonymized individual credit bureau records with credit bureau’s marketing data for the period of 2012-2020. The core credit bureau data—onto which the anonymized marketing data are merged—spans through the entire universe of credit visible population in the United States present in each archive. The dataset contains detailed debt and credit information, as well as a wealth of demographic information, such as race and ethnicity, age, gender, and geographic location. Please see Appendix A for more details.
Using this dataset, we define future borrowers or “Mortgage Ready” as those who do not currently own a mortgage but have observable credit attributes that may allow them to qualify for a mortgage.13 For example, a “Mortgage Ready” renter should meet the following criteria: age 45 and below and currently have no mortgages, have a credit score of 660 or higher, a debt-to-income ratio of 25 percent or less, no bankruptcies or foreclosures, and no severe delinquencies in the last 12 months (see Freddie Mac report, 2021). Renters tend to have lower credit scores than the overall borrowers on average. However, “Mortgage Ready” renters are more likely to have credit profiles similar to the recent first-time homebuyers. Thus, “Mortgage Ready” population can better represent future borrowers.
On the borrower side, we focus on the first-time homebuyers as opposed to a broader set of recent borrowers. We assume first-time homebuyers, who generally have less experience in the mortgage process relative to repeat borrowers, are more comparable to the “Mortgage Ready” renters. We use the administrative and credit data from NMDB to identify first-time homebuyers. We define a first-time homebuyer as someone who has not had an active mortgage in the past seven years14 and less than 45 years old. To avoid seasonality, we include the full-year home purchase originations in the year of estimation.
Our map is based on the idea that a “Mortgage Ready” consumer could afford a house purchased by a first-time homebuyer with the same or less income in the area, because they have the same resources to cover the cost. For each MSA, we construct an equal number of income buckets such that each bucket has the same share of “Mortgage Ready” renters. Therefore, the thresholds for each income bucket varies across cities. We use this approach for two reasons. First, since income distribution varies widely across the cities, using fixed income thresholds across cities can likely lead to misrepresentation of local affordability. Further, fixing the share of “Mortgage Ready” by income buckets makes it easy to compare affordability across cities. Second, this approach ensures robust ranking across MSAs by affordability regardless of the choice of the number of income buckets (see Appendix B for robustness check).
Mathematically, we first compute the share of “Mortgage Ready” renter in income bucket to purchase a mortgaged home sold to a recent first-time homebuyer with similar income. This is given by the multiplier of the probability of being “Mortgage Ready” in income bucket
(measured by the share of people in bucket
in the MR population), and the probability to afford a home as a first-time homebuyer (measured by accumulative share of first-time homebuyer up to income bucket
). Then, we compute the FFTHAM as a cumulative sum of these probabilities over all income buckets:

Enlarge Image

Enlarge Image
where is the share of people in bucket
in the MR Cohort and
is the share of first-time homebuyers in bucket
and
is the total share of first-time homebuyers with income less than the maximum income of the MR cohort. We choose N=20 and cohort can vary by area median income buckets (Overall, LMI, Middle Income) and/or race/ethnicity (Non-Hispanic White Americans, Black Americans, Hispanic Americans, Asian Americans).
Let us look at a simple example of a hypothetical MSA to illustrate our methodology in Exhibit 2. We divide the “Mortgage Ready” renters in this MSA into 20 buckets with equal share in each income bucket in column 2. Based on the corresponding income cutoff, we find the percentage of FTHBs in each income bucket in column 3. We then aggregate the borrower probability for each income bucket to get the cumulative borrower probability in col 4. For example, in income bucket 20, the cumulative borrower probability is 100 percent, i.e., “Mortgage Ready” consumers in this income bucket can afford all homes sold to recent first-time homebuyers in this MSA. Lastly, we aggregate the product of “Mortgage Ready” share and cumulative FTHB share to derive our affordability map. For instance, the FFTHAM for this MSA is 50.7 percent. That is, 50.7 percent of the “Mortgage Ready” population in MSA can afford a house purchased by the first-time homebuyers.
We can repeat this methodology by various area median income and/or racial/ethnic buckets to calculate affordability by different sub-groups.

Enlarge Image
Affordability by various localities and over time
We have a total of 380 MSAs in our sample. Exhibit 3 (upper panel) displays the FFTHAM for the overall population along with the “Mortgage Ready” counts in 2019 for all the 380 MSAs. The size of the bubble gives the “Mortgage Ready” counts and the color of the bubble gives the value of FFTHAM, which ranges from 10.62 percent (red) to 51.9 percent (green). Similarly, Exhibit 3 (lower panel) displays the FFTHAM and number of “Mortgage Ready” renters for the LMI population (i.e., people whose income is at or below 80 percent area median income) in all the 380 MSAs. Again, the size and color of the bubble gives the “Mortgage Ready” counts of LMI “Mortgage Ready” population and the value of the LMI affordability which ranges from 2.57 percent (red) to 29.63 percent (green). In both exhibits, the higher is the percent value, the more affordable is the metro area for its respective “Mortgage Ready” population. The coastal areas have higher count of “Mortgage Ready” consumers, but affordability is threatened in those areas. Not surprisingly, midwestern and southern cities are overall more affordable than the coastal ones. However, the LMI households in many southern cities do not fare much better than their counterparts in the coastal cities.

Enlarge Image
To compare the affordability across MSAs, we rank them based on their affordability overall and the LMI population respectively. Exhibit 4 shows the LMI ranking against the overall ranking for select MSAs15. The lower the rank value, the more affordable is the MSA among these selected cities. Furthermore, each MSA is also colored based on the ratio of median house price over area median income — a quick measure of cost of living in a given area, and the larger ratio indicates higher cost of living.
We can rank order the MSAs into four groups of cities. The first group of MSAs are in the bottom left quadrant. These are the average American neighborhoods that are affordable to everyone, including its LMI population. They are mainly the low-cost cities (lower house price-to-income ratio) in the South and the mid-West, such as Cleveland, OH, Knoxville, TN, and Louisville, KY. The second group of MSAs are in the top right quadrant. These cities are the typical high-cost areas, i.e., they are unaffordable to most people living there. They are mainly the high-cost coastal cities such as Seattle, WA, San Francisco, CA, and New York, NY. The third group, the MSAs in the top left quadrant, are affordable to most but not to the low income. Example of such cities are El Paso, TX, Charleston, SC, and Tampa, FL. Lastly, the fourth group of cities are MSAs in the bottom right quadrant, such as Baltimore, MD, Philadelphia, PA, and Minneapolis, MN. These are overall unaffordable, but relatively more affordable to its LMI population.

Enlarge Image
To get some intuition, we look at the distribution of first-time homebuyer loans in these cities in Exhibit 5. Note that we have 20 buckets, and each bucket represents 5 percent of the “Mortgage Ready” renters. If the entire mass of first-time homebuyers lies in bucket 1, the value of FFTHAM will be 100 percent, i.e., it’s perfectly affordable to everyone. In contrast, if the entire mass of first-time homebuyers lies in bucket 20, the value of FFTHAM will be close to 0, i.e., it’s unaffordable to almost everyone. Any distribution of first-time homebuyers that lie in between these two extremes will have an affordability value between 0 and 100 percent. While Knoxville and El Paso have more evenly distributed share of first-time homebuyers in Exhibit 5 making them overall affordable, the distribution of first-time homebuyer loans is more skewed to the left in San Francisco and Baltimore, making them overall unaffordable.
Next, we look at LMI affordability in these cities. The red dashed line marks the LMI cut-off for each metro area. If the line lies to the right of bucket 10, it means most “Mortgage Ready” renters are low-to-moderate income population. As the bar chart suggests, both San Francisco and Baltimore have comparable area median income as well as similar share of “Mortgage Ready” renters who are LMI. However, Baltimore is much more affordable to its LMI “Mortgage Ready” renters as 55 percent of loans originated to first-time homebuyers are from LMI population (in contrast to 15 percent in San Francisco). It suggests that there are more housing choices for LMI population in Baltimore than in San Francisco. In contrast, El Paso is unaffordable to its LMI population despite being overall affordable. As we can see in the chart, very few of El Paso’s LMI population are “Mortgage Ready.” LMI families make less than $40,000 annually in El Paso, making it very challenging for them to afford a home.

Enlarge Image
Next, we look at the trends in FFTHAM starting post-financial crisis time and spanning through the pandemic (2012-2020) in Exhibit 6. We investigate the trends in overall and LMI FFTHAM values for the select group of metros listed in Exhibit 4. For MSAs such as Seattle, San Francisco, Tampa, Minneapolis affordability declined significantly over time for everyone. In these MSAs, increasingly more first-time homebuyers have higher income level than “Mortgage Ready” renters. This implies likelihood of future borrowers to afford a home recently bought by a first-time homebuyer in these areas is decreasing. This could potentially be due to lack of adequate housing stock leading to bidding wars and pricing out the future borrowers belonging to lower income buckets. An exception to this pattern is Cleveland, where affordability went up significantly overall as well as for its LMI population since 2012. In MSAs such as Knoxville, Louisville, El Paso and Charleston, affordability was stable over this time period. For many MSAs, the affordability declined post pandemic, possibly due to surge in demand relative to supply.

Enlarge Image
Affordability by race/ethnicity and over time
Using our methodology, next we calculate the FFTHAM by various race/ethnicities. Exhibit 7 gives the trends in FFTHAM for top 20 metros with the highest count of “Mortgage Ready” population in 2020 that are Non-Hispanics White Americans. As the figure suggests, affordability of several cities, such as Atlanta, Phoenix, Miami, Denver, Portland, Seattle, Los Angeles, and San Francisco, have declined over time. Further, for almost all the cities, affordability took a hit in 2020. Nonetheless, cities that continue to be affordable for Non-Hispanic White Americans are St. Louis, Detroit, Pittsburgh, Philadelphia, Phoenix and Atlanta.

Enlarge Image
Next, we look at the trends in affordability in top 20 cities that are concentrated with “Mortgage Ready” Black Americans in Exhibit 8. The left panel lists some of the cities with the highest affordability for Black Americans, such as St. Louis, Detroit, New Orleans, Charlotte. In contrast, the right panel lists the cities with lower affordability for Black Americans, such as San Francisco. While Atlanta topped the list of most affordable cities in 2012 with an affordability value of 42 percent, it experienced significant decline over past 8 year with an affordability value of 32 percent by 2020. Other metro areas that experienced decline in affordability for Black Americans are Minneapolis, Miami, Richmond, Dallas, Los Angeles, and San Francisco. Lastly, almost all the cities experienced decline in affordability post pandemic.

Enlarge Image
Exhibit 9 gives the trends in FFTHAM in top 20 cities with the highest count of “Mortgage Ready” Hispanic Americans as of 2020. Compared to other race/ethnicities, Hispanic future borrowers experienced the biggest decline in affordability since 2012. Noticeably, most of the cities concentrated with “Mortgage Ready” Hispanic Americans are high-cost cities where affordability has been declining in past few years due to significant house price appreciation. Nonetheless, a few cities that have relatively high affordability for Hispanic future borrowers as of 2020 are San Antonio, Atlanta, Las Vegas, Orlando, and Chicago.

Enlarge Image
Lastly, we present trends in affordability for Asian Americans since 2012 in Figure 9. Asian future borrowers also experienced a decline in affordability in past few areas since they are also concentrated in high-cost areas, similar to the Hispanic Americans. There are, however, some exceptions to this rule where affordability has remained more or less stable. A few examples of those cities are Philadelphia and Baltimore. As of 2020, the cities that are most affordable to Asian future borrowers in this list are Detroit, Phoenix and Atlanta.

Enlarge Image
Affordability Map and Homeownership Rate
In the last part of our report, we test the credibility of our affordability map by examining its predictive power of future homeownership (Goodman, Li and Zhu 2018). Intuitively, a place where most of its “Mortgage Ready” population can afford a house, should have higher homeownership rate. To test this hypothesis, we compute the correlation between lagged values of our affordability map and homeownership rate for the 74 largest MSAs available for the years 2019 and 2020. Exhibit 11 indicates a strong positive relationship between FFTHAM and homeownership rate both before and after covid, confirming our expectations. A simple linear regression suggests that a one-percent increase in the affordability map implies a 0.36 to 0.44 percent increase in the homeownership rate. The coefficients are statistically significant and the variation in FFTHAM explains about 44-53 percent of the variation in the homeownership rate. Based on this exercise, we feel confident our affordability map could be a useful measure in predicting future homeownership rates across metro areas.

Enlarge Image
Conclusion
In this report, we propose a new income-based affordability map for most relevant populations at local geographic level. For a given metro area, our FFTHAM calculates the share of “Mortgage Ready” renters that have enough income to purchase a home bought by a recent first-time homebuyer. Further, it complements existing indexes by separately measuring affordability by various area median income and racial/ethnic buckets as well as analyzing trends in housing affordability over the last decade.
Our methodology has some limitations. While we consider the anonymized income and credit scores of “Mortgage Ready” renters, we do not consider other potential barriers such as perceptions regarding down payment requirements. Renters usually overestimate the amount of down payment required to qualify for loans and may have difficulty in saving for one (Goodman et. al, 2018). Despite that, our creditworthy renters’ ability to meet down payment requirements is more likely to be aligned with that of first-time homebuyers. Using NMDB, we find most first-time homebuyers put less than 6 percent down towards their mortgages. In addition, counseling and financial literacy programs can help educate the future borrowers to take advantage of an array of low-down payment products available to potential first-time homebuyers.
In summary, our map uses a very targeted approach in investigating how affordable a city is to its future borrowers. It provides insights to researchers, policy makers and practitioners on what areas are best suited for expanding access to credit to low-income families or for closing minority homeownership gaps. Lastly, using this affordability map on an ongoing basis, we will continue to track the extent to which the pandemic will impact affordability for future borrowers.
Appendix A: Data Description
We obtained deidentified consumer credit data from one of the three major credit bureaus. The credit data included age, various credit scores, and modeled measures of income and total debt-to-income. The modeled measure of tax-reported income is based on the credit bureau’s proprietary model, which includes consumer’s credit-based attributes as model inputs. It is inclusive of all income sources, such as wages, investment income, alimony, rental income, and so on. In most cases, the income source also includes spousal income if taxes are filed jointly. We also have the number, dollar amounts, and payment status of mortgage, auto, credit card, student loan, and other bank or retail debt. The credit file identifies credit inquiries, public-record bankruptcies, and foreclosures. The data include some geographic information, including zip code, county, and state.
Because the credit records data do not have information on consumers’ race or ethnicity and other demographic information, besides those mentioned, the credit bureau matched each consumer in the data set to their marketing data to get additional household-level data. The match rate was close to 100 percent. The marketing data consists of information on race, ethnicity, education level, gender, and marital status for the individuals living in the housing unit. These socio-demographic characteristics are based on credit bureau’s proprietary models which include consumer’s first and last name as well as geographic location amongst others as model inputs.16 To protect consumer privacy, all personal identification information such as name and address were removed, leaving only information on select attributes and those with match success.
Note that our data represents the universe of consumers with available credit data, not the U.S. population. The credit bureaus have data only for those U.S. residents who have applied for or taken out a loan (auto, credit card, student loan, mortgage, or home equity line of credit). The data may also include individuals with public records such as bankruptcies and collections. Our data is likely to understate the percentage of those who have no credit history, no items in collections, including recent immigrants with little or no credit history in the United States, because of credit invisibles with no records at any of the three major credit bureaus. Nonetheless, the data include individuals with so-called thin files.
Appendix B: Robustness Check
We conducted a robustness check on the sensitivity of our results responding to the choice of the number of income levels. First, we found insensitive affordable rankings to the choice of income grouping levels. Figure A1 compares the affordable value of all MSAs under three choices of equal sized income grouping levels: 4 vs. 10 vs. 20.17 It plots the affordable map value under different scenarios against rankings of all MSAs under the scenario of 4 equal share of income groups. In the 4 equal share case, the plot is a smooth line – toped ranked MSAs correspond to large affordable map value and vice versa. In the 10 equal share case, the plot shifts lower. Though the affordable map value decreases somewhat more for some MSAs than others and creates a slightly less smooth line, the mostly parallel shifting indicates similar magnitude of changes for all MSAs and thus the overall rankings for them can retain. For the case of 20 equal share, the line further parallelly shifted down but at a much minor magnitude. The shifting is predicted to converge after some large number of income buckets.
Second, as discussed above, the affordable map value is sensitive to the number of income buckets chosen. The choice of a larger number of income buckets would result in a lower affordable map value. For example, assuming an individual with income x dollars, this person falls in the in the bucket of pct25-pct50 under the scenario of 4 levels, and under the scenarios of 10 levels in the bucket of pct30-pct40. Based on the construction of the map, in the former case, this person can afford all homes recently purchased by FTHB with income less than pct50 of the MR income distribution, which is a larger percent of homes that are affordable to this person than if pct40 is used instead as in the latter case. Thus, the former case will produce larger affordable map values than the latter case as shown in Figure below.
The choice of the number of income levels evolves a balance of precision and restrictions that we would like to consider. On one hand, the more detailed income groupings would provide some precisions on the range of homes affordable to people based on their incomes. On the other hand, the more granular income groupings can impose a tight restriction on the homes that are affordable to people, especially given the likelihood of hidden income resources. In the example above, this person’s income matches more precisely to the range of pct30-pct40; but this person is restricted to only afford homes purchased by people with income less then pct40 rather than those purchased by people with income pct40-pct50. Therefore, we used the author’s judgment on the choice of the number of income levels.

Enlarge Image
Appendix C: Rank of FFTHAM for All vs. LMI for Selected MSAs

Enlarge Image
-
References
Bai, Bing, Jun Zhu, and Laurie Goodman. 2015. “A Closer Look at the Data on First-Time Homebuyers.” Washington, DC: Urban Institute.
Bogdon, Amy S., and Ayse Can. 1997. Indicators of Local Housing Affordability: Comparative and Spatial Approaches. Real Estate Economics 25(1):43–80.
Bourassa, Steven C., and Donald R. Haurin. 2016. “A Dynamic Housing Affordability Index.” International Real Estate Review (January).
C. Chung, A. V. Leventis, W. M. Doerner, D. Roderer, M. Barba, 2018, A New Home Affordability Estimate: What Share of Housing Stock Can Families Afford? Federal Housing Finance Agency working paper.
Fannie Mae. 2015. “Housing Affordability Primer.” Washington, DC: Fannie Mae.
Fisher, Lynn, Henry Pollakowski, and Jeffrey Zabel. 2009. “Amenity-Based Housing Affordability Indexes.” Real Estate Economics, 37(4): 705-746. Chung, Chi-Cheol, Andrew V. Leventis, William M.
Gan, Quan and Robert Hill. 2009. “Measuring housing affordability: Looking beyond the median.” Journal of Housing Economics, 18(2): 115-125.
Goodman, Laurie, and Jun Zhu. 2019. Housing Affordability for Renter Index: Local Perspective and Migration. Urban Institute.
Goodman, Laurie, Wei Li, and Jun Zhu. 2018. Housing Affordability: Local and National Perspectives. Urban Institute.
Goodman, Laurie, and Jun Zhu. 2020. What the Housing Affordability for Renters Index Tells Us about Homeownership Prospects for Newark Renters, Urban Institute.
Goodman, Laurie, Alanna McCargo, Edward Golding, Bing Bai, and Sarah Strochak. Barriers to Accessing Homeownership: Down Payment, Credit, and Affordability. 2018. Urban Institute Report.
C. Herbert, A. Hermann and D. Mccue, 2018, Measuring Housing Affordability: Assessing the 30 Percent of Income Standard, Joint Center for Housing Studies, Harvard University
HUD. 2019. Location Affordability Index. https://www.hudexchange.info/programs/location-affordability-index/documentation/#data-and-methodology.
Jewkes, Melanie and Lucy Delgadillo. 2010. “Weaknesses of Housing Affordability Indices Used by Practitioners.” Journal of Financial Counseling and Planning, 21(1): 43-52.
Kutty, Nandinee. 2005. “A new measure of housing affordability: Estimates and analytical results.” Housing Policy Debate, 16(1): 113-142.
Kyungsoon Wang, and Dan Immergluck 2019, Neighborhood Affordability and Housing Market Resilience: Evidence from the U.S. National Foreclosure Recovery, Journal of the American Planning Association 85(4): 544-563, 2019
Linneman, Peter D., and Isaac F. Megbolugbe. 1992. Housing Affordability: Myth or Reality.
Urban Studies 28(3/4):369–92.NAHB. Housing Opportunity. https://www.nahb.org/News-and-Economics/Housing-Economics/Indices/Housing-Opportunity-Index.
NATIONAL ASSOCIATION OF REALTORS®. Affordability Distribution Curve and Score. https://www.nar.realtor/research-and-statistics/housing-statistics/realtors-affordability-distribution-curve-and-score/methodology.
NATIONAL ASSOCIATION OF REALTORS®. Housing Affordability Index. https://www.nar.realtor/research-and-statistics/housing-statistics/housing-affordability-Index/methodology.
Pelletiere, Danilo. 2008. Getting to the Heart of Housing’s Fundamental Question: How Much Can a Family Afford? A Primer on Housing Affordability Standards in US Housing Policy. Washington, DC: National Low Income Housing Coalition.
Quigley, John, and Steven Raphael. 2004. “Is Housing Unaffordable? Why isn’t it More Affordable?” Journal of Economic Perspectives, 18(1): 129-152.
Stone, Michael E. 1990. One-Third of a Nation—A New Look at Housing Affordability in
America. Washington, DC: Economic Policy Institute.Stone, Michael E. 1993. Shelter Poverty: New Ideas on Housing Affordability.
Philadelphia: Temple University Press.Stone, Michael E. 2006. “What is Housing Affordability? The Case for the Residual Income Approach?” Housing Policy Debate, vol. 17, no. 1, pp. 151–184.
-
Footnotes
1 Mortgage Credit Availability Map published by Mortgage Bankers Association declined significantly since March 2020 which is indicative of tightening lending standards. See https://www.mba.org/news-and-research/research-and-economics/single-family-research/mortgage-credit-availability-index-x241340. Also see https://www.urban.org/urban-wire/pandemic-shrinking-mortgage-credit-box.
2 Low- to moderate-income population refers to those who made 80 percent or less area median income.
3 See Linneman and Megbolugbe, 1992; Bogdan and Can, 1997; Fannie Mae 2015; Haurin 2016; Jewkes and Delgadillo, 2010.
4 Our approach to define “Mortgage Ready” consumers is a research-based criterion and not underwriting criterion. While there may be an overlap, we do not know how many “Mortgage Ready” renters will go through underwriting or consider underwriting. For details, see https://www.freddiemac.com/research/insight/20211021-future-borrowers.
5 Our estimates of first-time homebuyer share differ from NAR’s estimate of around 31 percent in 2020. There are two main reasons for this discrepancy. First, while our measure is based on loan-level administrative data, NAR’s measure is based on survey results. Second, while our loans are limited to first-lien, owner-occupied originations for home purchase, NAR’s survey includes owner-occupied homes, investor properties, vacation homes and all-cash purchases.
6 FHFA’s tool offers improvement from NAR, NAHB and CAR tooles as it incorporates real contemporary and historical data on income, debt and funds available for down payments. It also allows to evaluate affordability at different income distributions other than the median income.
8 See https://blogs.wsj.com/economics/2014/05/22/why-housing-isnt-as-cheap-as-it-looks/
9 While Kutty’s method uses pre-tax income measures to compute nonshelter costs, Stone’s method uses after-tax income. Further, Kutty’s choice of nonshelter standard based on federal poverty threshold is lower than BLS lower-budget standard used by Stone.
10 Residual income is calculated as the amount of net income remaining after deductions of debts and obligations and monthly shelter expenses to cover family living expenses such as food, health care, clothing and gasoline.
11 After accounting for local amenities, their tool reveals major shifts in effective affordability. For households earning 80 percent of AMI, they find substantial shifts in affordability away from towns with poor job accessibility, poor schools and lack of safety.
12 We do acknowledge that transportation and energy costs are important factors in determining affordability. Since our methodology is based on the income approach as opposed to the cost approach, we implicitly assume the recent first-time homebuyers took these costs into consideration when making their purchase decisions.
13 Note that the actual underwriting might consider other factors in evaluating a borrower’s mortgage readiness.
14 It is a stricter requirement than GSE’s traditional definition for first-time homebuyers, which requires no active mortgage in the past three years.
15 MSAs are selected if they have at least 200 FTHB loans originated in 2019. This selection results in a total of 85 cities. For illustration purpose, Exhibit 4 only shows 12 cities. The whole 85 cities view can be find in Appendix C.
16 Using names and addresses to model race and ethnicity has been used by others such as the Consumer Financial Protection Bureau, for instance. See https://files.consumerfinance.gov/f/201409_cfpb_report_proxy-methodology.pdf.
17 In the case of 4 income levels, it is 25 percent of the population in each income level, and 10 percent and 5 percent respectively for the choices of 10 and 20 income levels.
Prepared by Single-Family Client and Community Engagement
Jaya Dey, Principal Economist, Director
Sijie Li Hickly, Senior Economist