


Will the homeownership rate fall below 50 percent?
In this month's Outlook, we review recent economic developments and their impact on our projections for the remainder of 2016 and all of 2017. We then shift our focus to the future of the homeownership rate. Finally, we highlight recent trends in refinancing.
Economy seeks to gain traction; inflation and labor market creating headwinds
The surprisingly weak June employment report has spooked markets and put the Fed on hold. Nonetheless, other indicators suggest economic growth is poised to pick up from the anemic pace of the first quarter. Personal consumption expenditures were up 1 percent in April led by strong vehicle sales and recovering gasoline prices. This marks the fastest pace since August 2009. Retail sales were also up 1.3 percent for the month of April after falling 0.3 percent in March; yet another indication that consumers are driving the economy forward in the second quarter. Finally, crude oil prices have also stabilized somewhat, and are now at their highest level since October of last year. Given these recent data, we still expect growth rebound in the remaining quarters of 2016. Our outlook calls for gross domestic product to grow at 1.9 and 2.3 percent in 2016 and 2017, respectively.
Inflation remains persistently low, even as gasoline prices rose 8.1 percent in April. Overall, the Consumer Price Index for April continues a trend of anemic growth rising only 0.4 percent and 1.1 percent over 12 months. Other inflation measures, such as the Core PCE price index, up only 1.6 percent year-over-year, are also falling well short of the targeted 2 percent inflation mark set by the Fed. As a result, we are still expecting inflation to stay around 1.4 percent in 2016 and to move up to 1.9 percent in 2017.
Even with weak price growth, the improving economic conditions in recent months added to the speculation of a Fed rate-hike occurring as early as June. However, May's employment report halted all such speculation, once again putting into question when the Federal Reserve will lift rates. Growth in total nonfarm payroll employment was limited to 38,000 in May, the lowest since September 2010. Losses in the mining, information (due to an employee strike), and manufacturing sectors were the major causes. Downward revisions in March and April equaling 59,000 contributed to the disappointing report. The average growth in job gains for the past five months has now fallen to 150,000 per month, much less than the average pace of 229,000 for 2015.
Additionally, the decline in the unemployment rate to 4.7 percent was not due to more people working, but to fewer people actively seeking jobs. One of the few positive takeaways from the May jobs report was average hourly earnings, which rose 2.5 percent over the past year. Future revisions may soften the blow, but we believe May's report was enough to put the Fed on hold for at least another month. Nonetheless, we believe that May's report will not be enough to heavily impact our outlook and we still maintain that unemployment will average 4.9 percent in 2016 and 4.8 percent in 2017.
Low mortgage rates boost demand, but supply remains tight
Domestic and international investors continued to flock to the safety of U.S. Treasury bonds keeping yields around 1.8 percent in May, unchanged from April. The 30-year fixed-rate mortgage, which closely follows the 10-year Treasury yield, fell 1 basis point in May to 3.6 percent, marking yet another low point for 2016 and the lowest monthly average since May 2013. Despite rates stalling over the past two months, we still believe they will move up in June, allowing for the 30-year fixed to reach 3.7 percent in the second quarter and averaging 3.9 percent in 2016 and 4.5 percent in 2017. For short-term rates, we are still assuming a rate hike in the third quarter.
The persistence of low rates has benefited the housing market as seen in various April releases. Housing starts rose 6.6 percent in April to a seasonally adjusted annual rate of 1.17 million units. Starts continue to trend upward since the end of the recession as builders attempt to meet increasing demand. Existing-home sales for April came in at an annual rate of 5.45 million homes, 1.7 percent above March's upwardly revised figure of 5.36 million. New home sales grew a very impressive 16.6 percent in April to a seasonally-adjusted annual rate of 619,000 units, the highest rate since January of 2008. The strong demand in April marks the start of the spring home buying season and it was amplified by historically-low borrowing costs. This surging demand for housing does imply that continuing supply constraints will create some upward pressure on house prices. Therefore, we have increased our house price appreciation forecast in 2016 by 20 basis points to 5.0 percent, and in 2017 by 40 basis points to 4.0 percent.
Will the U.S. homeownership rate fall below 50 percent?
We have been saying 2016 will be the best year for housing in a decade. This month's forecast continues on that same theme with home sales and national house prices projected to reach their highest levels since 2006. Despite a generally weak economy, we expect housing to be an engine of growth. Residential investment will directly boost growth, and higher home equity will bolster consumer confidence, which should lead to higher consumer expenditures.
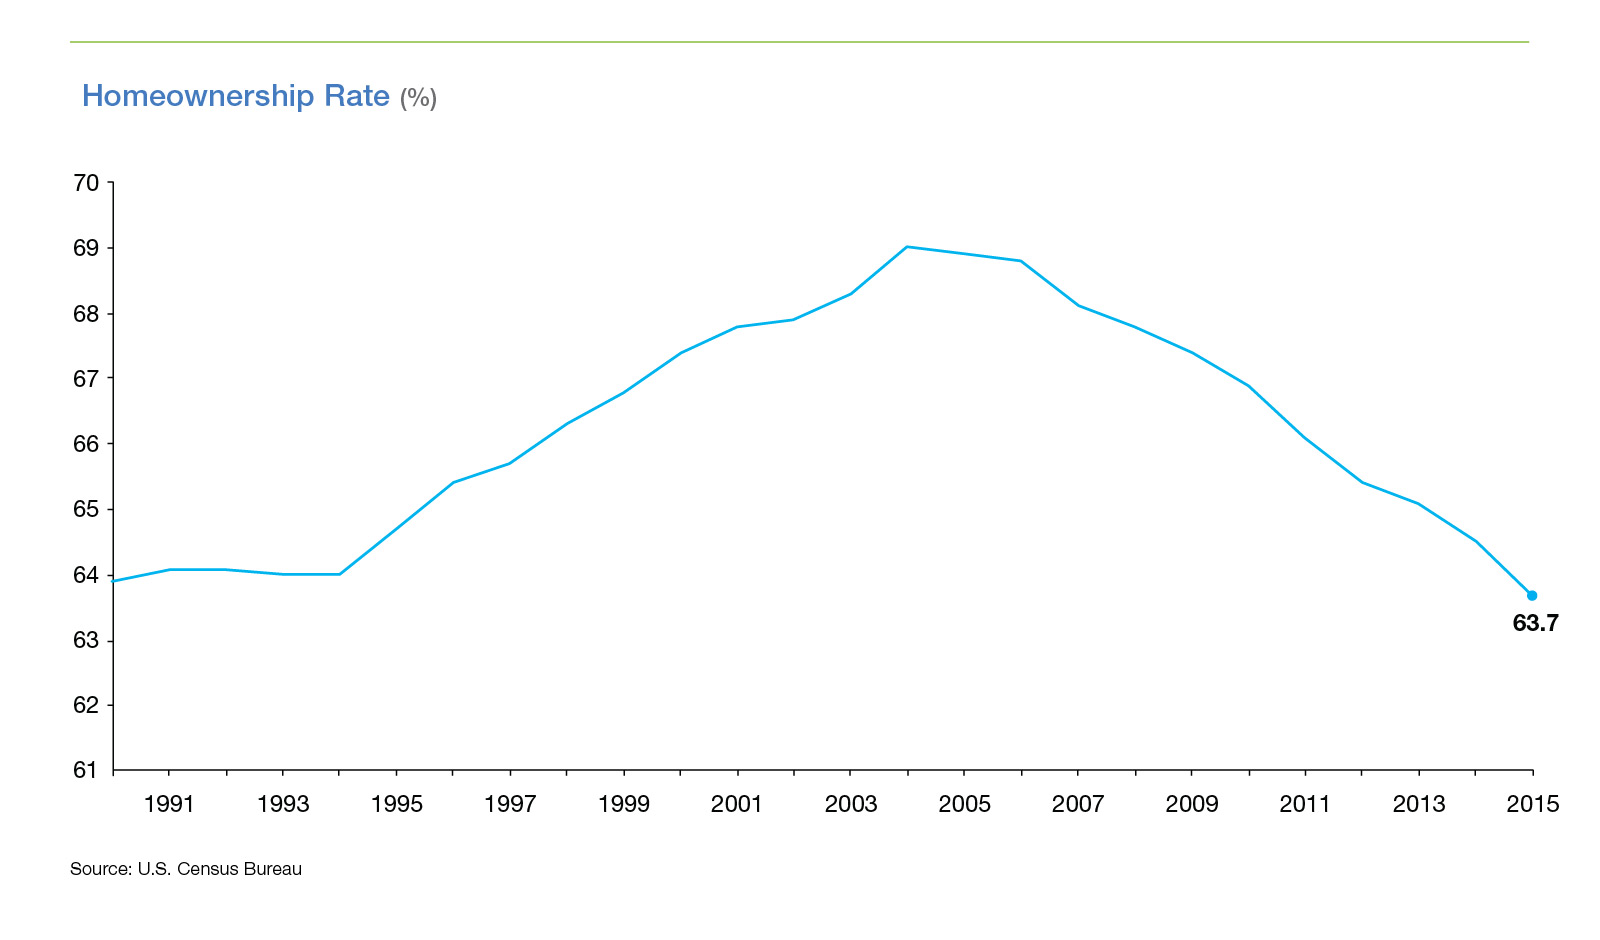
Yet even if our forecasts are met or exceeded, the outlook for homeownership is mixed. The national homeownership rate declined precipitously over the past decade. After reaching a peak of 69 percent the homeownership rate has plummeted, falling to a 40-year low a few quarters ago and remaining below 64 percent for the past several quarters. Looking ahead many analysts expect to see the homeownership rate fall even further.
But how far? Could the homeownership rate fall below 50 percent?
Most analysts do not expect the U.S. homeownership rate to fall below 50 percent, but there are a range of plausible scenarios where that could happen. Recently, in a series of provocative articles1234, several prominent housing economists analyzed whether the U.S. homeownership rate would fall below 50 percent by 2050. They agreed that a 20 percentage point decline in the homeownership rate was not the most likely scenario, but a variety of factors could made that scenario plausible.
The focal point of the discussion was if the homeownership rate could fall—if at all—as much as 20 percentage points. Acolin, Goodman, and Wachter believe it is plausible in a market where rents and house prices increase somewhat faster than inflation. The paper points to California as a representative of what the nation could become.
Sandy beaches and a Mediterranean climate probably aren't in the cards for Nebraska or Vermont, but rather the United States of the future is expected to have a similar demographic makeup to the one found in California today. Additionally, California has high rental costs and home prices relative to income. The high cost of home prices could result in less people opting to own a home due to the lack of monetary freedom to prepare for a larger down payment. This could even include those that may qualify for Freddie Mac's three percent down payment Home Possible product. Furthermore, they believe that if this trend continues it will preclude renters from ever becoming homeowners.
Ultimately, Acolin, Goodman, and Wachter conclude the long term outlook is the homeownership rate will continue to decrease. Some experts agreed with the qualitative outcome but differed on the severity and emphasized different drivers. Nelson (2016) believes that homeownership rates will continue to decrease, and the current trends driving down homeownership will be difficult to reverse. Similarly, Myers and Lee (2016) believe the effects of the Great Recession will echo forward for decades driving down homeownership. However, they believe a major decrease in homeownership is unlikely. Myers and Lee state that a major cataclysmic event such as a 35-year perpetual recession would be necessary for a 20 percentage point decrease.
Haurin (2016) contends that a 20 percent decrease in homeownership is unlikely. Haurin does acknowledge that homeownership may experience another one to two-point decrease by 2020, but suggests that a gradual increase should occur after 2020, countering the decline debate. He explains that a 20 percent decline would require a combination of plunging rents, surging user costs of ownership (e.g. higher house prices and/or mortgage rates), and adverse demographic changes, all of which Haurin argues are unlikely to occur. Furthermore, he contends that in about a decade, potential homeowners will have adjusted to the need for higher credit and larger down payments.
Factors driving the homeownership rate
There are several factors that will drive the homeownership rate. In this section we review some of the most important drivers.
Income growth
Median household income growth has been weak throughout the economic recovery. In 2014, after adjusting for inflation, real median household income in the United States is at about the same level as in 1996. Lack of income growth hinders homeownership by constraining homebuyer affordability.
Higher rents and housing costs
Housing cost burdens continue to increase. The Joint Center for Housing Studies' State of the Nation's Housing has documented the rapid increase in housing cost burdens, particularly for renter-households. High renter-cost burdens make it difficult for prospective homebuyers to save up for a down payment and other expenses related to a home purchase. High home prices make the entry point into homeownership difficult for prospective homebuyers.
High student loan debt
As documented by the New York Federal Reserve Bank of New York and others5, outstanding student debt burdens have risen substantially. The evidence on how much student debt has hindered homeownership has been mixed6, but certainly rising debt burdens are a major issue, and rising debt burdens could weigh on the homeownership rate.
Constrained credit
Credit conditions have tightened over the past decade, reducing access to credit. Last decade households could attain a mortgage with weak credit, little to no money down, and without documenting income. For good reasons, credit conditions have tightened following the Great Recession. However, most believe credit conditions have swung too far in the other direction. Moreover, new regulations have increased the cost of originating a mortgage from $4,700 in 2008 to $7,000 in 2015 according the Mortgage Banker Association's Annual Mortgage Bankers Performance Report. Higher origination and servicing costs have left many lenders cautious about lending to only those with pristine credit scores. Another concern among lenders has been mortgage repurchases - a last resort if a quality control review finds a mortgage didn't meet Freddie Mac's underwriting requirements at the time of sale. However, one of the industry's best-kept secrets is the steady decline in mortgage repurchase activity, at least for the mortgages Freddie Mac buys. The number of loans Freddie Mac has required seller/servicers to repurchase has come down dramatically over the last four years. Completed repurchases have dropped from a peak of $4.2 billion in 2010 to about $400 million in 2015, a 95 percent drop.
This downward repurchase trend is good for seller/servicers, Freddie Mac and taxpayers. It's also good for borrowers. When seller/servicers sell Freddie Mac loans with greater certainty, they are more likely to make loans that take advantage of the full extent of our credit box, and thereby increasing access to credit.
Loss of confidence in wealth attainment via homeownership
Traditionally, homeownership has been viewed as an important channel for wealth attainment for many households, particularly low-income households7. Following the Great Recession that perception might have changed8. If households do not view homeownership as a means to wealth attainment, then the desirability of homeownership will be reduced, particularly in the face of:
Desired mobility
Because of the high transaction costs involved with buying a selling a home, desired mobility will decrease the desirability of homeownership. The Millennial generation9 has been more likely to move into urban areas than earlier generations were. Also, Millennials have tended to marry later and have children later.
Age cohort momentum
Housing analysts have known for a long time that cohort momentum is important in understanding homeownership10. Cohorts who come of age during a recession carry the effects of the recession throughout the rest of their lives and may only gradually—if ever—see their cohort homeownership rates match that of more fortunate cohorts who came of age in an economic expansion. Looking ahead to the evolution of the homeownership rate, cohort effects are likely to be a major contributor to housing market dynamics.
Change in demographic composition
The shifting demographic composition of the U.S. will have profound impacts on the homeownership rate11. The U.S. population is becoming more diverse, with proportionally fewer Non-Hispanic White households who have traditionally had a higher homeownership rate than other ethnic and racial groups. The extent to which minority households close the homeownership gap will have a major impact on the future of the homeownership rate.
Multigenerational housing
Due to rising cost burdens, an aging population, and the demographic shift in the ethnic and racial composition of U.S. households, multigenerational housing may rise in importance12. A record number of young adults are now living at home with parents; living at home with parents is the most common living arrangement for 18- to 34-year olds. If these living arrangement persists, homeownership rates could suffer. Our recent research on the attitudes of homeowners and renters ages 55+ sheds some light on likely trends in multigenerational housing. According to our research, only 4 percent of homeowners say it is very likely, and 8 percent say it is somewhat likely, to have an adult child move in with them in the next five years.
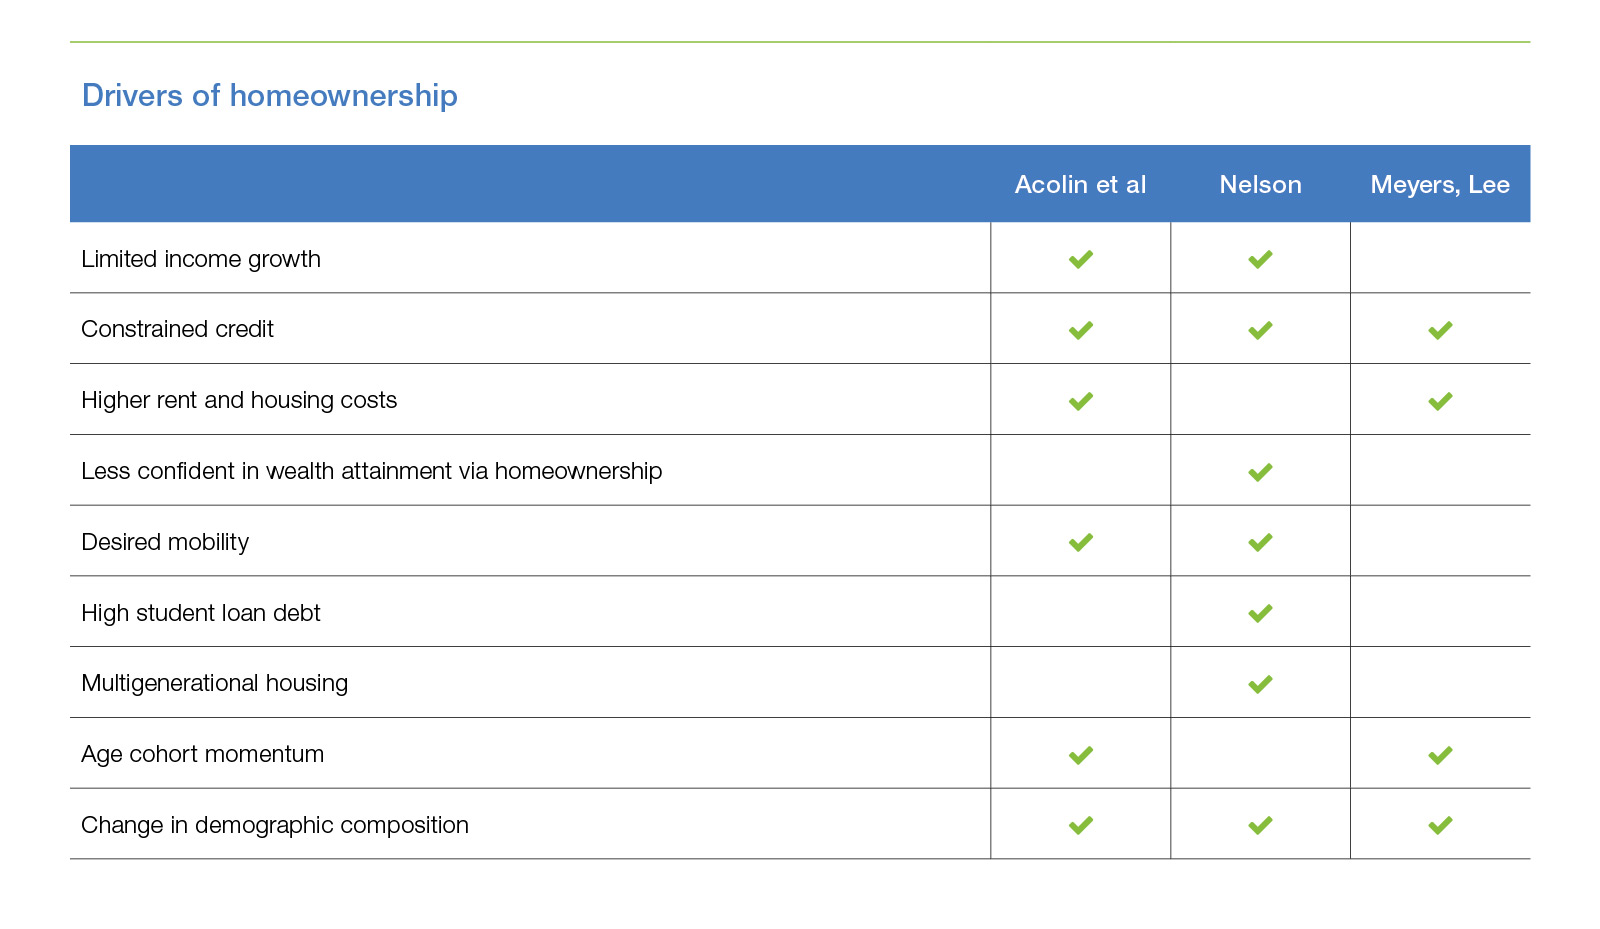
One or more of these factors were explicitly considered by the researchers projecting the homeownership rate. The table below summarizes which factors were stressed by the different authors.
Projections for the homeownership rate are summarized in the table below:
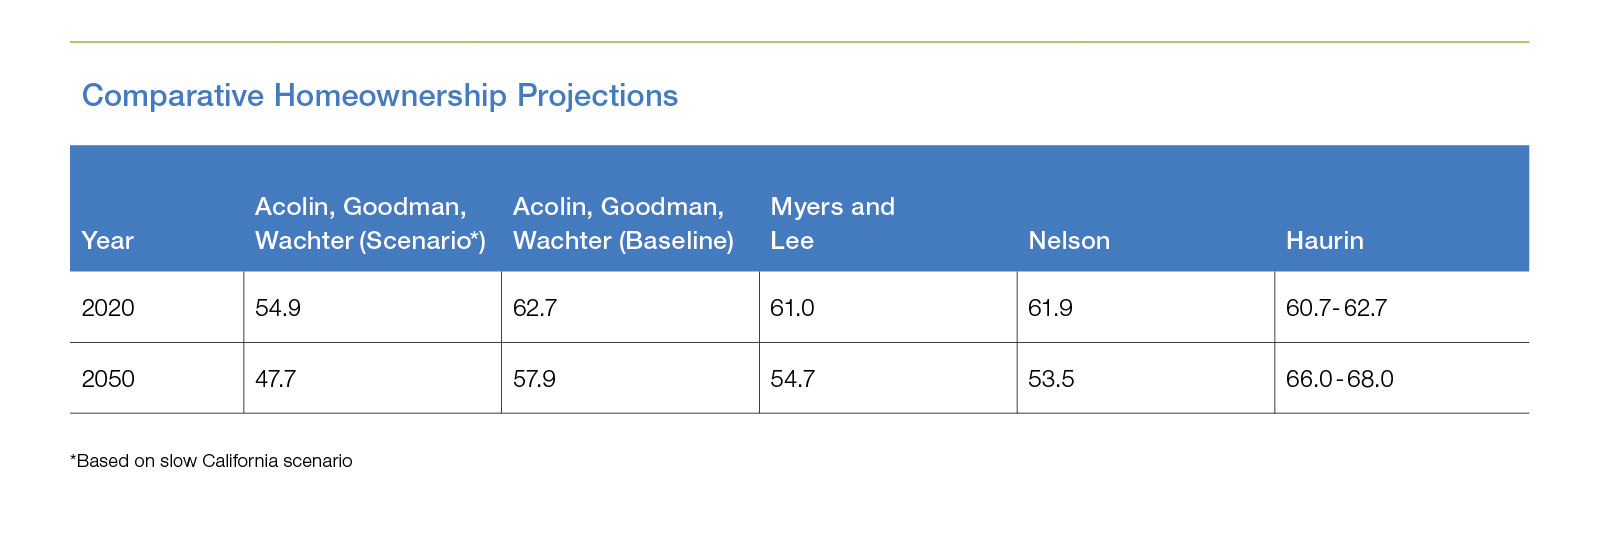
*Based on slow California scenario
As seen above, there are widely varying opinions for the future of homeownership rate. This is largely because the projection of homeownership rates requires making predictions about the effects of many uncertain parameters. The wide variations in plausible scenarios make it difficult to say with much confidence how the homeownership rate will evolve.
We're presently conducting our own research into the factors that will drive the homeownership rate. In future articles, we plan to weigh in with additional details on how these factors might affect homeownership and the future of the housing market.
First Quarter 2016 Refinance Statistics
Refinance statistics for the first quarter of 2016 are now available. Freddie Mac's quarterly refinance statistics are based loans Freddie Mac funded. More information about the report's methodology and the refinance statistics included in the report are available on Freddie mac web site: http://www.freddiemac.com/research/datasets/refinance-stats/index.html
Full details are available at the above link, but there are a couple of key trends worth mentioning:
Following the financial crisis, for most quarters between 2010 and 2013, the “cash-out” share has fallen and ranging between 15-to-20 percent. In recent quarters the share of mortgage with loan amounts that were at least five percent higher than the original mortgage balance, has been rising – marking 42 percent in the fourth quarter of last year and 40 percent in the first quarter of 2016. During the first quarter of this year an estimated $10.9 billion net dollars of home equity were converted to cash during the refinance of conventional prime-credit home mortgages, down from $11.0 billion in the fourth quarter of 2015 and substantially less than during the peak cash-out refinance volume of $84.0 billion during the second quarter of 2006.
Despite the increase in cash-out refinances in the recent quarters, there is little risk of overleveraging in the conventional conforming prime market. The median loan-to-value ratio for all prime conventional cash-out refinances was 69 percent in the first quarter of 2016. For comparison, it was 74 percent in 2000, 73 percent in 2001, and 71 percent in 2002. As we mentioned in last month's Insight increased leverage—including greater utilization of cash-out refinancing—is an important trend to monitor. The latest quarterly data show no worrisome cash-out trends.
References
- Nelson, A. C. (2016). Point of Contention: Declining Homeownership. Cityscape, 18(1), 125.
- Myers, D., & Lee, H. (2016). Cohort momentum and future homeownership: The outlook to 2050. CityScape, 18(1), 131.
- Acolin, A., Goodman, L. S., & Wachter, S. M. (2016). A Renter or Homeowner Nation?. Cityscape, CityScape, 18(1), 145.
- Haurin, D. R. (2016). The Future Course of US Homeownership Rates. Cityscape, 18(1), 159.
- See for example, our September 2015 Insight for discussion: http://www.freddiemac.com/fmac-resources/research/pdf/sep_2015_public_outlook.pdf
- See for example: Mezza, A., Sommer, K., & Sherlund, S. (2014). Student loans and homeownership trends. Federal Reserve Board of Governors, FEDS Notes, October, 15. and Mezza, A., Ringo, D. R., Sherland, S., & Sommer, K. (2016). On the Effect of Student Loans on Access to Homeownership.
- Herbert, C. E., McCue, D. T., & Sanchez-Moyano, R. (2013). Is Homeownership Still an Effective Means of Building Wealth for Low-income and Minority Households? (Was it Ever?). Homeownership Built to Last.
- Bracha, A., & Jamison, J. C. (2012). Shifting confidence in homeownership: The great recession. BE Journal of Macroeconomics.
- See for example: Council of Economic Advisors, The. 2014. 15 Facts About Millennials. Washington, DC: The White House. https://obamawhitehouse.archives.gov/sites/default/files/docs/millennials_report.pdf
- For an early example see: Pitkin, John R., and George S. Masnick. 1980.Projections of Housing Consumption in the U.S., 1980 to 2000, by a Cohort Method. Annual Housing Survey Studies, No. 9. Washington, DC: Department of Housing and Urban Development.
- See for example Drew, R. B. (2015). Effect of changing demographics on young adult homeownership rates. Joint Center for Housing Studies Harvard University. http://www.jchs.harvard.edu/sites/jchs.harvard.edu/files/w15-2_drew.pdf
- Fry, Richard, Kim Parker, Jeffrey S. Passel, and Molly Rohal. 2014. In Post-Recession Era, Young Adults Drive Continuing Rise in Multi-Generational Living. Washington, DC: Pew Research Center. http://www.pewsocialtrends.org/2014/07/17/in-post-recession-era-young-adults-drive-continuing-rise-in-multi-generational-living/